EUROPEAN ORGANISATION FOR NUCLEAR RESEARCH
CERN-PH-EP-2007-016
3rd May 2007
Inclusive Jet Production in Photon-Photon
Collisions at from to GeV
The OPAL Collaboration
Abstract
Inclusive jet production () is studied in collisions of quasi-real photons radiated by the LEP beams at centre-of-mass energies from 189 to 209 GeV. Jets are reconstructed using the jet algorithm. The inclusive differential cross-section is measured as a function of the jet transverse momentum, , in the range 5 40 GeV for pseudo-rapidities, , in the range -1.5 1.5. The results are compared to predictions of perturbative QCD in next-to-leading order in the strong coupling constant.
(Submitted to Physics Letters B)
The OPAL Collaboration
G. Abbiendi2, C. Ainsley5, P.F. Åkesson7, G. Alexander21, G. Anagnostou1, K.J. Anderson8, S. Asai22, D. Axen26, I. Bailey25, E. Barberio7,p, T. Barillari31, R.J. Barlow15, R.J. Batley5, P. Bechtle24, T. Behnke24, K.W. Bell19, P.J. Bell1, G. Bella21, A. Bellerive6, G. Benelli4, S. Bethke31, O. Biebel30, O. Boeriu9, P. Bock10, M. Boutemeur30, S. Braibant2, R.M. Brown19, H.J. Burckhart7, S. Campana4, P. Capiluppi2, R.K. Carnegie6, A.A. Carter12, J.R. Carter5, C.Y. Chang16, D.G. Charlton1, C. Ciocca2, A. Csilling28, M. Cuffiani2, S. Dado20, A. De Roeck7, E.A. De Wolf7,s, K. Desch24, B. Dienes29, J. Dubbert30, E. Duchovni23, G. Duckeck30, I.P. Duerdoth15, E. Etzion21, F. Fabbri2, P. Ferrari7, F. Fiedler30, I. Fleck9, M. Ford15, A. Frey7, P. Gagnon11, J.W. Gary4, C. Geich-Gimbel3, G. Giacomelli2, P. Giacomelli2, M. Giunta4, J. Goldberg20, E. Gross23, J. Grunhaus21, M. Gruwé7, A. Gupta8, C. Hajdu28, M. Hamann24, G.G. Hanson4, A. Harel20, M. Hauschild7, C.M. Hawkes1, R. Hawkings7, G. Herten9, R.D. Heuer24, J.C. Hill5, D. Horváth28,c, P. Igo-Kemenes10, K. Ishii22, H. Jeremie17, P. Jovanovic1, T.R. Junk6,i, J. Kanzaki22,u, D. Karlen25, K. Kawagoe22, T. Kawamoto22, R.K. Keeler25, R.G. Kellogg16, B.W. Kennedy19, S. Kluth31, T. Kobayashi22, M. Kobel3,t, S. Komamiya22, T. Krämer24, A. Krasznahorkay Jr.29,e, P. Krieger6,l, J. von Krogh10, T. Kuhl24, M. Kupper23, G.D. Lafferty15, H. Landsman20, D. Lanske13, D. Lellouch23, J. Lettso, L. Levinson23, J. Lillich9, S.L. Lloyd12, F.K. Loebinger15, J. Lu26,b, A. Ludwig3,t, J. Ludwig9, W. Mader3,t, S. Marcellini2, A.J. Martin12, T. Mashimo22, P. Mättigm, J. McKenna26, R.A. McPherson25, F. Meijers7, W. Menges24, F.S. Merritt8, H. Mes6,a, N. Meyer24, A. Michelini2, S. Mihara22, G. Mikenberg23, D.J. Miller14, W. Mohr9, T. Mori22, A. Mutter9, K. Nagai12, I. Nakamura22,v, H. Nanjo22, H.A. Neal32, S.W. O’Neale1,∗, A. Oh7, M.J. Oreglia8, S. Orito22,∗, C. Pahl31, G. Pásztor4,g, J.R. Pater15, J.E. Pilcher8, J. Pinfold27, D.E. Plane7, O. Pooth13, M. Przybycień7,n, A. Quadt31, K. Rabbertz7,r, C. Rembser7, P. Renkel23, J.M. Roney25, A.M. Rossi2, Y. Rozen20, K. Runge9, K. Sachs6, T. Saeki22, E.K.G. Sarkisyan7,j, A.D. Schaile30, O. Schaile30, P. Scharff-Hansen7, J. Schieck31, T. Schörner-Sadenius7,z, M. Schröder7, M. Schumacher3, R. Seuster13,f, T.G. Shears7,h, B.C. Shen4, P. Sherwood14, A. Skuja16, A.M. Smith7, R. Sobie25, S. Söldner-Rembold15, F. Spano8,y, A. Stahl13, D. Strom18, R. Ströhmer30, S. Tarem20, M. Tasevsky7,d, R. Teuscher8, M.A. Thomson5, E. Torrence18, D. Toya22, I. Trigger7,w, Z. Trócsányi29,e, E. Tsur21, M.F. Turner-Watson1, I. Ueda22, B. Ujvári29,e, C.F. Vollmer30, P. Vannerem9, R. Vértesi29,e, M. Verzocchi16, H. Voss7,q, J. Vossebeld7,h, C.P. Ward5, D.R. Ward5, P.M. Watkins1, A.T. Watson1, N.K. Watson1, P.S. Wells7, T. Wengler7, N. Wermes3, G.W. Wilson15,k, J.A. Wilson1, G. Wolf23, T.R. Wyatt15, S. Yamashita22, D. Zer-Zion4, L. Zivkovic20
1School of Physics and Astronomy, University of Birmingham,
Birmingham B15 2TT, UK
2Dipartimento di Fisica dell’ Università di Bologna and INFN,
I-40126 Bologna, Italy
3Physikalisches Institut, Universität Bonn,
D-53115 Bonn, Germany
4Department of Physics, University of California,
Riverside CA 92521, USA
5Cavendish Laboratory, Cambridge CB3 0HE, UK
6Ottawa-Carleton Institute for Physics,
Department of Physics, Carleton University,
Ottawa, Ontario K1S 5B6, Canada
7CERN, European Organisation for Nuclear Research,
CH-1211 Geneva 23, Switzerland
8Enrico Fermi Institute and Department of Physics,
University of Chicago, Chicago IL 60637, USA
9Fakultät für Physik, Albert-Ludwigs-Universität
Freiburg, D-79104 Freiburg, Germany
10Physikalisches Institut, Universität
Heidelberg, D-69120 Heidelberg, Germany
11Indiana University, Department of Physics,
Bloomington IN 47405, USA
12Queen Mary and Westfield College, University of London,
London E1 4NS, UK
13Technische Hochschule Aachen, III Physikalisches Institut,
Sommerfeldstrasse 26-28, D-52056 Aachen, Germany
14University College London, London WC1E 6BT, UK
15School of Physics and Astronomy, Schuster Laboratory, The University
of Manchester M13 9PL, UK
16Department of Physics, University of Maryland,
College Park, MD 20742, USA
17Laboratoire de Physique Nucléaire, Université de Montréal,
Montréal, Québec H3C 3J7, Canada
18University of Oregon, Department of Physics, Eugene
OR 97403, USA
19CCLRC Rutherford Appleton Laboratory, Chilton,
Didcot, Oxfordshire OX11 0QX, UK
20Department of Physics, Technion-Israel Institute of
Technology, Haifa 32000, Israel
21Department of Physics and Astronomy, Tel Aviv University,
Tel Aviv 69978, Israel
22International Centre for Elementary Particle Physics and
Department of Physics, University of Tokyo, Tokyo 113-0033, and
Kobe University, Kobe 657-8501, Japan
23Particle Physics Department, Weizmann Institute of Science,
Rehovot 76100, Israel
24Universität Hamburg/DESY, Institut für Experimentalphysik,
Notkestrasse 85, D-22607 Hamburg, Germany
25University of Victoria, Department of Physics, P O Box 3055,
Victoria BC V8W 3P6, Canada
26University of British Columbia, Department of Physics,
Vancouver BC V6T 1Z1, Canada
27University of Alberta, Department of Physics,
Edmonton AB T6G 2J1, Canada
28Research Institute for Particle and Nuclear Physics,
H-1525 Budapest, P O Box 49, Hungary
29Institute of Nuclear Research,
H-4001 Debrecen, P O Box 51, Hungary
30Ludwig-Maximilians-Universität München,
Sektion Physik, Am Coulombwall 1, D-85748 Garching, Germany
31Max-Planck-Institute für Physik, Föhringer Ring 6,
D-80805 München, Germany
32Yale University, Department of Physics, New Haven,
CT 06520, USA
a and at TRIUMF, Vancouver, Canada V6T 2A3
b now at University of Alberta
c and Institute of Nuclear Research, Debrecen, Hungary
d now at Institute of Physics, Academy of Sciences of the Czech Republic
18221 Prague, Czech Republic
e and Department of Experimental Physics, University of Debrecen,
Hungary
f and MPI München
g and Research Institute for Particle and Nuclear Physics,
Budapest, Hungary
h now at University of Liverpool, Dept of Physics,
Liverpool L69 3BX, U.K.
i now at Dept. Physics, University of Illinois at Urbana-Champaign,
U.S.A.
j and The University of Manchester, M13 9PL, United Kingdom
k now at University of Kansas, Dept of Physics and Astronomy,
Lawrence, KS 66045, U.S.A.
l now at University of Toronto, Dept of Physics, Toronto, Canada
m current address Bergische Universität, Wuppertal, Germany
n now at University of Mining and Metallurgy, Cracow, Poland
o now at University of California, San Diego, U.S.A.
p now at The University of Melbourne, Victoria, Australia
q now at IPHE Université de Lausanne, CH-1015 Lausanne, Switzerland
r now at IEKP Universität Karlsruhe, Germany
s now at University of Antwerpen, Physics Department,B-2610 Antwerpen,
Belgium; supported by Interuniversity Attraction Poles Programme – Belgian
Science Policy
t now at Technische Universität, Dresden, Germany
u and High Energy Accelerator Research Organisation (KEK), Tsukuba,
Ibaraki, Japan
v now at University of Pennsylvania, Philadelphia, Pennsylvania, USA
w now at TRIUMF, Vancouver, Canada
x now at DESY Zeuthen
y now at CERN
z now at DESY
∗ Deceased
1 Introduction
We have studied the inclusive production of jets in collisions of two quasi-real photons at centre-of-mass energies from 189 to 209 GeV, with a total integrated luminosity of 593 collected by the OPAL detector at LEP. The transverse momentum111OPAL uses a right-handed coordinate system where the -axis points in the direction of the e- beam and the -axis points to the centre of the LEP ring. The polar angle and the azimuthal angle are defined relative to the -axis and -axis, respectively. In cylindrical polar coordinates, the radial coordinate is denoted . The transverse momentum is defined as the component of the momentum perpendicular to the -axis. The pseudo-rapidity is defined as . of the jets provides a scale that allows such processes to be calculated in perturbative QCD. Calculations at next-to-leading order (NLO) in the strong coupling constant, , for this process are available [1, 2]. Comparisons of these calculations to the data presented in this paper provide tests of perturbative QCD for the observables and kinematical region considered. Leading order (LO) Monte Carlo (MC) generators are used to estimate the influence of soft underlying processes not included in the NLO calculation. Furthermore the measured jet cross-sections may be used in studies evaluating the hadronic structure of the photon, which are beyond the scope of this paper.
The jets are reconstructed using the jet algorithm [3]. Inclusive jet cross-sections in two-photon interactions have previously been measured at from 130 to 136 GeV by OPAL [4], and at from 189 to 209 GeV by L3 [5]. In [5] an excess at high transverse momenta was observed in the data over the QCD calculations, for kinematical conditions very similar to those used in the present paper.
At LEP the photons are radiated by the beam electrons222Positrons are also referred to as electrons., and carry mostly small negative four-momenta squared, . In this paper events are considered only if the electrons are scattered at small angles and are not detected. Both photons are therefore quasi-real ( GeV2). The interactions can be modelled by assuming that each photon can either interact directly or appear resolved through its fluctuations into hadronic states. In leading order QCD this model leads to three different event classes for interactions: direct, single-resolved and double-resolved, where resolved means that the incoming photon interacts through its partonic structure (quarks or gluons).
2 The OPAL detector
A detailed description of the OPAL detector can be found elsewhere [6]. The central tracking was performed inside a solenoidal magnet which provided a uniform axial magnetic field of 0.435 T along the beam axis. Starting from the innermost components, the tracking system consisted of a high precision silicon micro-vertex detector, a precision vertex drift chamber, a large volume jet chamber with 159 layers of axial anode wires and a set of chambers measuring the track coordinates along the beam direction. The transverse momenta, , of tracks were measured with a precision parametrised by ( in GeV) in the central region . The position of the primary vertex is determined from the tracks.
The magnet was surrounded in the barrel region () by a lead-glass electromagnetic calorimeter (ECAL) and a hadronic sampling calorimeter (HCAL), which in turn were surrounded by muon chambers. Similar layers of detectors were installed in the endcaps (). The small-angle region from 47 to 140 mrad around the beam pipe on both sides of the interaction point was covered by the forward calorimeters (FD) and the region from 33 to 59 mrad by the silicon-tungsten luminometers (SW). The latter were used to determine the luminosity by counting small-angle Bhabha scattering events.
3 Kinematics and MC simulation
The properties of the two interacting photons () are described by their negative squared four-momenta and the invariant mass of the photon-photon system, . Each is related to the electron scattering angle relative to the beam axis by
| (1) |
where and are the four-momenta of the beam electrons and the scattered electrons, respectively, and and are their energies. Events with one or both scattered electrons detected (single-tagged or double-tagged events) are excluded from the analysis. Driven by the angular acceptance of the FD and SW calorimeters, a value of GeV2 is used in this analysis as the maximum possible . The median resulting from this limit cannot be determined from data, since the scattered electrons are not tagged, but is predicted by MC simulations to be of the order of GeV2. The invariant mass of the photon-photon system, , can be obtained from the energies and momenta of the final state hadrons.
All signal and background Monte Carlo samples used for detector corrections and background determinations were passed through a full simulation of the OPAL detector [7]. They are analysed using the same reconstruction algorithms as are applied to the data.
The Monte Carlo generator PYTHIA 5.722 [8, 9] was used to simulate the signal processes for the determination of detector corrections, as large samples with full detector simulation and reconstruction were available. For all other purposes the more modern PYTHIA 6.221 was used to generate signal samples. PYTHIA is based on LO QCD matrix elements for massless quarks with the addition of parton showers and hadronisation. The following generators were used for the simulation of the six background processes that contribute significantly after the event selection described below: PYTHIA for and ; BDK [10] for ; HERWIG [11] for deep-inelastic electron-photon scattering (); KORALZ [12] for and GRC4F [13] for events.
4 Jet definition and event selection
The data presented were collected by the OPAL detector at centre-of-mass energies 189 - 209 GeV and represent a total integrated luminosity of 593 . For the purpose of this analysis, the difference between the data taken at the various values of is small and therefore the distributions for all energies have been added. The luminosity-weighted average centre-of-mass energy is 198.5 GeV. The efficiency to trigger jet events in the selected kinematical region is close to 100% [4].
In this analysis, a sum over all particles in the event or in a jet means a sum over two kinds of objects: tracks satisfying the quality cuts detailed below, and all calorimeter clusters, including those in the FD and SW calorimeters. A track is required to have a minimum transverse momentum of 120 MeV and at least 20 hits in the central jet chamber. The point of closest approach to the origin must have a distance of less than 25 cm in and a radial distance, , of less than 2 cm from the -axis. For tracks with a transverse momentum larger than 5 GeV, is required to be less than 0.15 cm, to ensure a good momentum measurement. Calorimeter clusters have to pass an energy threshold of 100 MeV in the barrel section or 250 MeV in the endcap section of the ECAL, 600 MeV for the barrel and endcap sections of the HCAL, 1 GeV for the FD, and 2 GeV for the SW. An algorithm is applied to avoid double-counting of particle momenta in the central tracking system and their energy deposits in the calorimeters [4]. The measured hadronic final state for each event consists of all objects thus defined.
Events with at least one jet are first preselected before the final event selection based on maximum likelihood distribution functions [14] is applied. The preselection criteria are as follows.
-
•
Using the jet algorithm, the event must contain at least one jet with and a transverse momentum GeV. In this algorithm the distance measure between any pair of objects to be clustered is taken to be
(2) Throughout this analysis we set . The of the reconstructed jet, , is calculated as the sum of the transverse momenta of all the particles in the jet.
-
•
The total summed energy deposited in the ECAL and the HCAL has to be less than 80 GeV. This removes most of the hadronic decays, including events with a radiative return to the peak.
-
•
To remove events with scattered electrons in the FD or in the SW calorimeters, the total energy sum measured in the FD has to be less than 55 GeV, and the total energy sum measured in the SW calorimeter has to be less than 40 GeV.
-
•
The position of the primary vertex is required to satisfy cm and the net charge of the event calculated from adding the charges of all tracks is required to be to reduce background due to beam-gas interactions.
-
•
To remove events originating from interactions between beam electrons and the beam-pipe the radial distance of the primary vertex from the beam axis has to be less than 3 cm.
-
•
The event must lie in the allowed ranges for the input variables of the maximum likelihood selection, as detailed below.
The final event selection uses seven input variables for the likelihood function:
-
1.
The visible invariant mass measured in the ECAL only, (in the range [0-80] GeV);
-
2.
The visible invariant mass calculated from the entire hadronic final state, (in the range [0-120] GeV);
-
3.
The number of tracks (in the range [6-70]);
-
4.
The sum of all energy deposits in the ECAL (in the range [0-80] GeV);
-
5.
The sum of all energy deposits in the HCAL (in the range [0.1-55] GeV);
-
6.
The missing transverse momentum of the event calculated from the measured hadronic final state (in the range from zero to );
-
7.
To improve the rejection of background coming from hadronic decays, an invariant mass, , is calculated from the jet with highest in the event and the four-vector sum of all hadronic final state objects in the hemisphere opposite to the direction defined by this jet (considered in the range [0.1-100] GeV).
In comparing the preselected events to MC simulations, the signal MC generator PYTHIA 5.722 underestimates the normalisation of the cross-section by about 50% in this process, and is scaled up accordingly. A similar deficiency was also observed in our previous study on di-jets [15]. Furthermore previous studies have shown that the prediction of MC generators for jet events in photon-photon collisions where one of the photons is virtual is too low by about a factor of two [16]. The prediction of the contribution from events has been scaled up accordingly, resulting in an adequate description of all quantities used in the analysis.
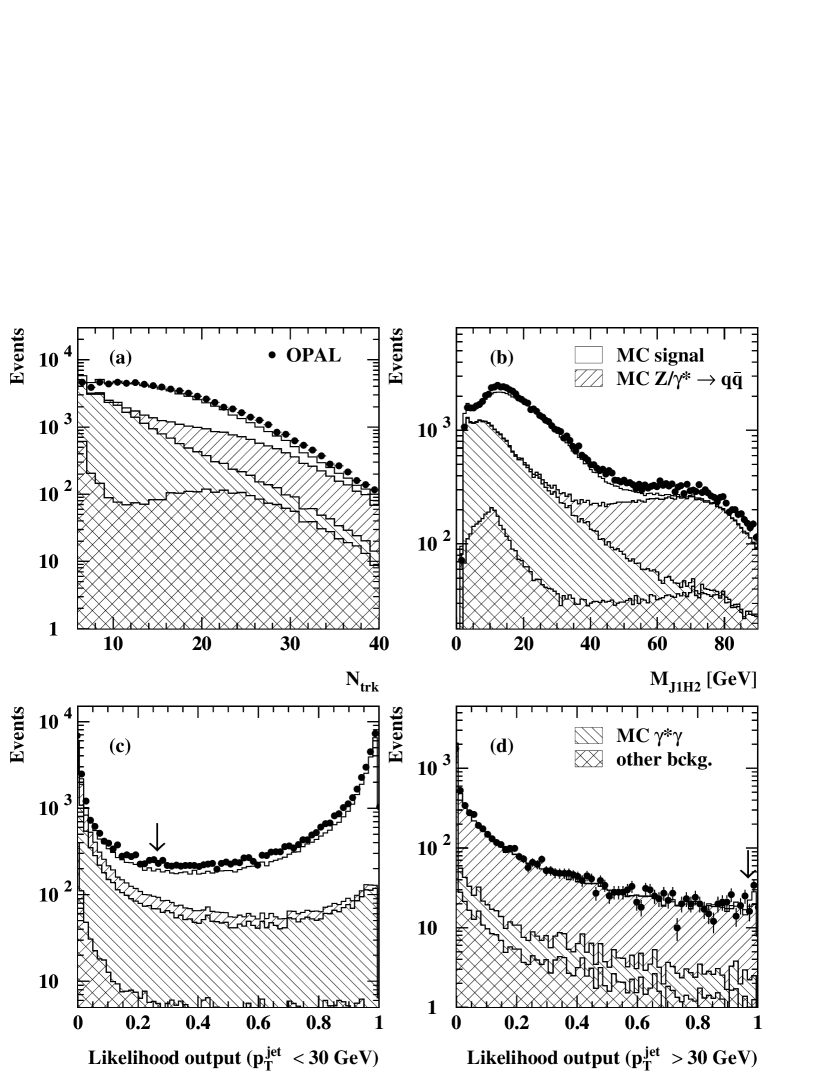
Figure 1 (a) and (b) show two examples of the input distributions used for the likelihood selection, which is performed separately for events with the highest smaller than 30 GeV and events with the highest larger than 30 GeV. The region of high , where most of the discrepancy with NLO QCD is observed in [5], is strongly affected by background from which is not important at lower . A separate optimization of the selection is hence necessary to maximize the reach of the analysis in . The output of the likelihood functions for the data and all simulated processes is shown in Figure 1 (c) and (d). The cuts on the likelihood outputs are chosen to be 0.26 and 0.98 for the low and high region, respectively. Applying these cuts reduces the background by 99.5% while reducing the signal by 71% in the high region; in the low region, these reductions are 91% and 27%, respectively.
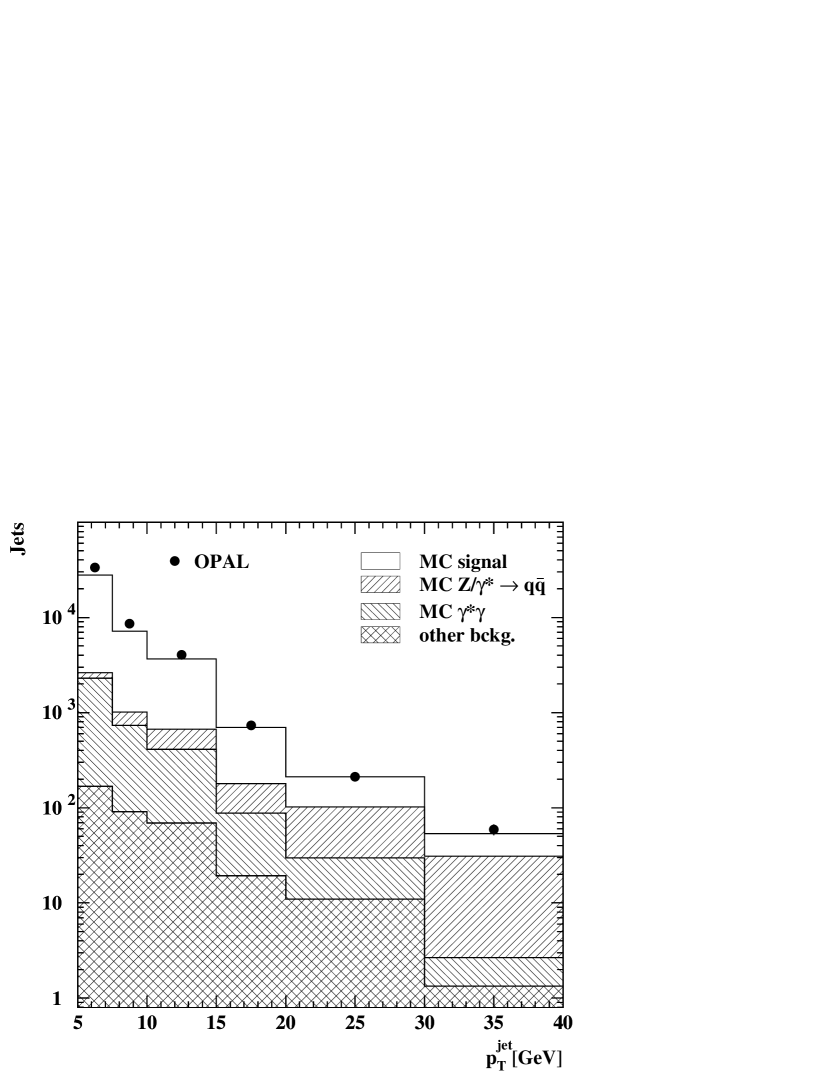
The distribution after the event selection is shown in Figure 2. The dominant background at low is due to events, while for high the background is dominated by events. To measure the cross-section, the background is subtracted bin-by-bin.
The measured transverse momentum distributions still have to be corrected for the losses due to event and track selection cuts, the acceptance and the resolution of the detector. This is done using the PYTHIA 5.722 signal Monte Carlo events which were processed by the full detector simulation and reconstruction chain. The data are corrected by multiplying the experimental distribution with correction factors which are calculated as the bin-by-bin ratio of the generated and the reconstructed Monte Carlo distributions. This method only yields reliable results if migration effects between bins due to the finite resolution of the measurement are small. The bins of the -distribution have therefore been chosen to be significantly larger than the detector resolution, obtained from the Monte Carlo simulation.
5 Systematic uncertainties
The systematic uncertainties for each bin in can be found in Table 1. The values for each bin were averaged with the results from its two neighbours (single neighbour for endpoints) to reduce the effect of bin-to-bin fluctuations. The sources of systematic uncertainties considered are given below. The total systematic uncertainty for each bin is calculated by adding the contributions in quadrature.
-
•
The absolute energy scale of the ECAL is known to about 3% [17] for the jet energy range in this analysis. To estimate the influence of this uncertainty, the energy scale of the data is varied by this amount, and the analysis is repeated.
-
•
To assess the uncertainty associated with the subtraction of background events, all backgrounds – except for – have been varied by . The prediction of the contribution from events has been scaled up by a factor of two, as described earlier. By comparing the MC predictions in regions where this background dominates we conclude that this scaling factor can not be varied by more than about 30% while keeping a good description of the data. The scaling factor is varied accordingly. The resulting uncertainty is dominated by the distributions from and background.
-
•
To test the event selection’s dependence on the simulation of the signal, the signal MC has been re-weighted to have a -slope in which it significantly either over- or underestimates the data at high and the analysis has been repeated. The difference between using the original MC and the re-weighted MC is included in the systematic uncertainty.
-
•
The cut on the likelihood output value is varied down to 0.23 and up to 0.29 for the low region and down to 0.88 for the high region.
-
•
The uncertainty on the determination of the integrated luminosity is less than 1%, and is neglected.
6 Multiple parton interactions and hadronisation corrections
The NLO calculations do not take into account the possibility of an underlying event, which leads to an increased energy flow and therefore to a larger cross-section above any given threshold in the jet transverse momentum. PYTHIA 6.221 has been used to study the effect of either considering (default) or leaving out multiple interactions for the signal MC. In PYTHIA the underlying event is modelled by multiple parton interactions (MIA). At the lowest transverse momenta considered the signal MC cross-section increases by up to 20% when including MIA. This effect reduces to less than 10% for transverse momenta larger than 7 GeV.
The measured inclusive jet cross-section will be compared to NLO QCD calculations which describe jet cross-sections for partons, while the experimental cross-section is presented for hadrons. There is as yet no rigorous way to use the MC generators to correct the NLO predictions for this process so that they can be compared to the data, because the partons in the MC generators and the partons in the NLO calculations are defined in different ways. But because the use of MC generators is the only available option so far, they are used to approximate the size of this hadronisation correction. Hadronisation corrections have been estimated with PYTHIA 6.221333The use of the cluster fragmentation model as implemented in HERWIG as an alternative in studies carried out in [15] for similar kinematic conditions yields corrections compatible with or smaller than those determined using PYTHIA.. At 5 GeV the correction is about 15%. The correction decreases with increasing and is below 5% in our study for 20 GeV. Disabling MIA in PYTHIA while determining the hadronisation corrections leads to values of the correction factors within 2% of those determined with MIA enabled.
7 Differential cross-section
Inclusive jet cross-sections have been measured for the photon-photon kinematical region of invariant masses of the hadronic final state GeV, and a photon virtuality 4.5 GeV2. The data are compared to predictions of PYTHIA 6.221 and NLO perturbative QCD [1, 2].
The NLO cross-sections are calculated using the QCD partonic cross-sections in NLO for direct, single- and double-resolved processes, convoluted with the Weizsäcker-Williams effective photon distribution. The hadronisation corrections discussed in the previous section are applied to the NLO calculation before it is compared to the data. The GRV-G HO parametrisation of the parton densities of the photon [18] is used with MeV. The renormalisation and factorisation scales in the calculation are set equal to . The cross-section calculations were repeated for the kinematic conditions of the present analysis. The calculations shown below are obtained from [1]. We have verified that using the independent calculation presented in [2] yields results within 5%, except in the lowest bin in , where it predicts a cross-section about 25% higher.
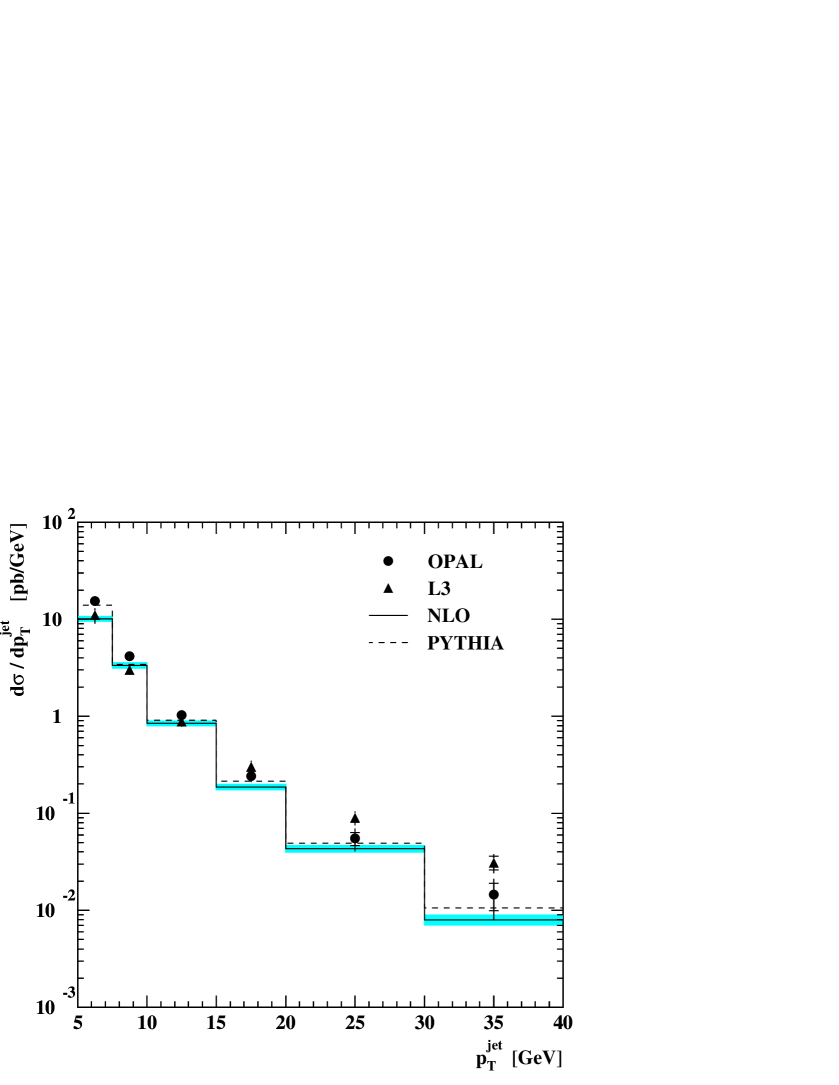
Figure 3 and Table 2 show the cross-section as a function of for . Both PYTHIA 6.221 and the NLO calculation achieve a good description of the data, with the exception of the lowest bin in , where the NLO calculation is too low.
To facilitate a comparison with a recent measurement by the L3 collaboration, a measurement of the same quantity as presented in Figure 3 is shown in Figure 4 for . While the L3 data points are compatible with the present measurement, they lie below the OPAL data points at low and above the OPAL data points at high , and there is a discrepancy in shape between the L3 data and the NLO calculation. This difference in shape has been reported in the L3 publication and leads to a significant disagreement between the L3 data and the NLO calculation at the highest of up to 50 GeV studied in [5]. The present analysis finds the region of GeV to be dominated by background and hence no measurement is presented for this region.
In contrast to the conclusion in [5], the present analysis finds good agreement between data and calculations for of up to 40 GeV, leading to the conclusion that perturbative QCD in NLO is adequate to describe the process under study.
Acknowledgements
We thank Michael Klasen and Stefano Frixione for providing the NLO calculations and for
many useful discussions.
We particularly wish to thank the SL Division for the efficient operation
of the LEP accelerator at all energies
and for their close cooperation with
our experimental group. In addition to the support staff at our own
institutions we are pleased to acknowledge the
Department of Energy, USA,
National Science Foundation, USA,
Particle Physics and Astronomy Research Council, UK,
Natural Sciences and Engineering Research Council, Canada,
Israel Science Foundation, administered by the Israel
Academy of Science and Humanities,
Benoziyo Center for High Energy Physics,
Japanese Ministry of Education, Culture, Sports, Science and
Technology (MEXT) and a grant under the MEXT International
Science Research Program,
Japanese Society for the Promotion of Science (JSPS),
German Israeli Bi-national Science Foundation (GIF),
Bundesministerium für Bildung und Forschung, Germany,
National Research Council of Canada,
Hungarian Foundation for Scientific Research, OTKA T-038240,
and T-042864,
The NWO/NATO Fund for Scientific Research, the Netherlands.
References
-
[1]
M. Klasen, T. Kleinwort and G. Kramer,
Eur. Phys. J. Direct C1 (1998) 1;
M. Klasen, private communications. -
[2]
S. Frixione, et. al,
Nucl. Phys. B507 (1997) 295;
S. Frixione, G. Ridolfi, Nucl. Phys. B507 (1997) 315;
L. Bertora, PhD thesis, Genova University, Italy, 2004;
S. Frixione, L. Bertora, private communications. -
[3]
S. Catani, Yu.L. Dokshitzer, M.H. Seymour and
B.R. Webber,
Nucl. Phys. B406 (1993) 187;
S.D. Ellis, D.E. Soper, Phys. Rev. D48 (1993) 3160. - [4] OPAL Collaboration, K. Ackerstaff et al., Z. Phys. C 73 (1997) 433.
- [5] L3 Collaboration, P. Achard et al., Phys. Lett. B 602 (2004) 157.
-
[6]
OPAL Collaboration, K. Ahmet et al.,
Nucl. Instrum. Methods A305 (1991) 275;
S. Anderson et al., Nucl. Instrum. Methods A403 (1998) 326;
OPAL Collaboration, G. Abbiendi et al., Eur. Phys. J. C14 (2000) 373;
OPAL Collaboration, G. Abbiendi et al., Eur. Phys. J. C33 (2004) 173. - [7] J. Allison et al., Nucl. Instrum. Methods A317 (1992) 47.
-
[8]
T. Sjöstrand,
Comp. Phys. Comm. 82 (1994) 74;
T. Sjöstrand, LUND University Report, LU-TP-95-20 (1995). -
[9]
G.A. Schuler and T. Sjöstrand,
Z. Phys. C73 (1997) 677;
G.A. Schuler and T. Sjöstrand, Nucl. Phys. B407 (1993) 539. -
[10]
F.A. Berends, P.H. Daverveldt and
R. Kleiss,
Nucl. Phys. B253 (1985) 421;
F.A. Berends, P.H. Daverveldt and R. Kleiss, Comp. Phys. Comm. 40 (1986) 271;
F.A. Berends, P.H. Daverveldt and R. Kleiss, Comp. Phys. Comm. 40 (1986) 285;
F.A. Berends, P.H. Daverveldt and R. Kleiss, Comp. Phys. Comm. 40 (1986) 309. -
[11]
G. Marchesini et al.,
Comp. Phys. Comm. 67 (1992) 465;
G. Corcella et al., JHEP 0101 (2001) 010. - [12] S. Jadach, B.F.L. Ward and Z. Was, Comp. Phys. Comm. 79 (1994) 503.
- [13] J. Fujimoto et al., Comp. Phys. Comm. 100 (1997) 128.
- [14] D. Karlen, Computers in Physics 12:4 (1998) 380.
- [15] OPAL Collaboration, G. Abbiendi et al., Eur. Phys. J. C31 (2003) 307.
-
[16]
A.M. Rooke (for the OPAL collaboration),
Proceedings of Photon ’97, Egmond aan Zee, The Netherlands, 10-18 May
1997, edited by A.Buijs and F.C.Erné, World Scientific (Singapore) 1997,
p465;
A.M. Rooke, University College London, PhD Thesis, September 1998. - [17] OPAL Collaboration, G. Abbiendi et al., Eur. Phys. J. C14 (2000) 199.
-
[18]
M. Glück, E. Reya and A. Vogt,
Phys. Rev. D45 (1992) 3986;
M. Glück, E. Reya and A. Vogt, Phys. Rev. D46 (1992) 1973.
| ECAL | Background | Cut | Signal | Total | |||
|---|---|---|---|---|---|---|---|
| [GeV] | energy [%] | subtraction [%] | selection [%] | rew. [%] | [%] | ||
| 5.0 | – | 7.5 | 3.2 | 4.4 | 0.1 | 2.6 | 6.0 |
| 7.5 | – | 10.0 | 3.5 | 4.6 | 0.2 | 2.2 | 6.2 |
| 10.0 | – | 15.0 | 3.6 | 5.3 | 0.8 | 1.4 | 6.6 |
| 15.0 | – | 20.0 | 3.7 | 6.2 | 1.7 | 3.1 | 8.0 |
| 20.0 | – | 30.0 | 9.1 | 7.7 | 3.7 | 4.0 | 13.2 |
| 30.0 | – | 40.0 | 12.2 | 8.6 | 4.7 | 5.0 | 16.5 |
| Background | ||||||
| [GeV] | [GeV] | [%] | [pb/GeV] | |||
| 5.0 | – | 7.5 | 5.9 | 13.8 0.1 | (15.3 0.1 0.9) | |
| 7.5 | – | 10.0 | 8.5 | 17.4 0.3 | (41.5 0.8 2.4) | |
| 10.0 | – | 15.0 | 11.8 | 21.6 0.4 | (10.3 0.3 0.6) | |
| 15.0 | – | 20.0 | 16.9 | 28.8 0.9 | (24.1 1.6 1.6) | |
| 20.0 | – | 30.0 | 23.3 | 47.6 1.8 | (55.0 8.4 6.2) | |
| 30.0 | – | 40.0 | 33.0 | 57.0 3.6 | (14.5 4.5 2.0) | |
| 5.0 | – | 7.5 | 5.9 | 14.9 0.1 | (21.7 0.2 1.3) | |
| 7.5 | – | 10.0 | 8.5 | 19.3 0.2 | (58.5 0.9 3.6) | |
| 10.0 | – | 15.0 | 11.8 | 22.5 0.4 | (14.3 0.3 0.9) | |
| 15.0 | – | 20.0 | 16.9 | 28.9 0.9 | (31.8 1.9 2.6) | |
| 20.0 | – | 30.0 | 23.5 | 47.1 1.6 | (70.3 10.2 9.3) | |
| 30.0 | – | 40.0 | 33.0 | 57.1 3.2 | (15.7 4.7 2.6) | |