The role of HST in the study of near- and mid-infrared-selected galaxies
Abstract
Because of their unique quality, Hubble Space Telescope (HST) data have played an important complementary role in studies of infrared (IR) galaxies conducted with major facilities, as VLT or Spitzer, and will be as well very valuable for future telescopes as Herschel and ALMA. I review here some of the most recent works led by European astronomers on IR galaxies, and discuss the role that HST has had in the study of different IR galaxy populations. I particularly focus the analysis on the GOODS fields, where the multiwavelength data and unique HST coverage have enabled to jointly put constraints on the evolution of star formation activity and stellar-mass growth with cosmic time.
1 Introduction
Studies of galaxy populations much benefit from the coordinated efforts of multiwavelength observations, which allow for a deeper insight into different galaxy properties and evolution. One of the best examples of these coordinated efforts is the Great Observatories Origins Deep Survey (GOODS) (P.I.: M. Giavalisco), with 320 arcmin2 of the sky fully covered with deep observations from X-rays through radio wavelengths. Both North and South GOODS fields have been designed to be a unique case of HST coverage: they have deep and homogeneous maps in four broad-band Advanced Camera for Surveys (ACS) filters and . The large amount of science produced over the last years using GOODS data demonstrates the importance of HST Treasury and other major-telescope Legacy programs.
Near and mid-IR selected galaxies constitute quite unbiased tracers of two different astrophysical properties: stellar mass and star-formation/AGN activity, respectively. Although, in general, these galaxies populations are studied separately, a joint analysis of results allows to better understand the interplay between star formation, AGN activity and stellar-mass growth at different cosmic times. In the study of near- and mid-IR-selected galaxies, deep HST data have had a major role in the following aspects: 1) the determination of optical spectral energy distributions (SEDs), 2) the computation of precise () photometric redshifts, as a complement to existing spectroscopic redshifts and 3) galaxy morphology. The two former aspects have been of key importance to conduct complete studies of galaxy luminosity evolution and stellar mass assembly.
2 Near-IR-selected galaxies
An important landmark in the study of near-IR-selected galaxies has been the K20 survey cim02 , which included part of the GOODS-South among their fields. The first science results obtained by the K20 survey have soon been extended after the progressive public releases of the deeper ISAAC-VLT and -band data in the GOODS-South (P.Is.: C. Cesarsky, E. Giallongo). Finally, after the launch of Spitzer in 2003 (P.I.: M. Werner), both GOODS fields have been observed with IRAC at 3.6, 4.5, 5.8 and 8.0 (P.I.: M. Dickinson).
At the typical depths of the GOODS data (21-22 Vega mag), -selected galaxies mostly span the redshift range , but of these galaxies are found at higher redshifts cap05 cap06k gra06 . The latter include Extremely Red Galaxies (ERGs), which have been the subject of many studies looking for the progenitors of present-day massive ellipticals cap05 smail02 roch03 cap04 roch06 .
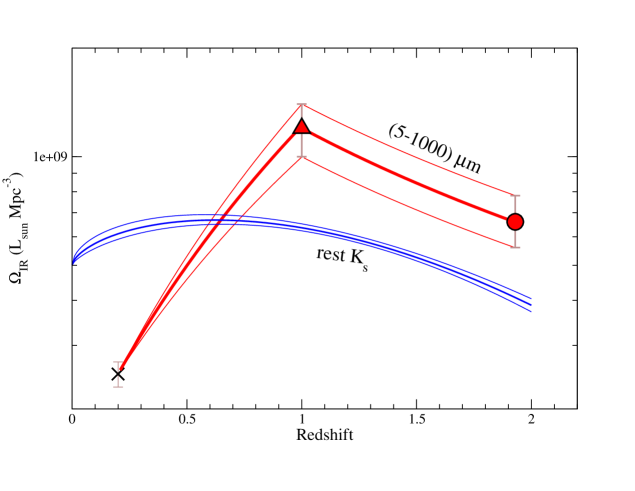
The evolution of the rest-frame -band luminosity function (LF) has been studied up to with the K20 survey pozz03 , and then extended up to redshift using GOODS and other datasets cap05 cap06k sar06 arn07 . All these works agree in a mild but still significant increase of the bright end of this LF from to . At the same time, the overall number density of galaxies decreases, making the near-IR luminosity density to be nearly constant with redshift (cf. Figure 1).
Multiwavelength SED modelling has also allowed to obtain stellar-mass estimates for near-IR-selected galaxies. The redshift evolution of galaxy number densities is differential with stellar mass: while the density of moderately massive galaxies () continuosly increases from redshift down to , virtually all of the most massive () galaxies appear to be in place by cap06k sar05 tho05 fran06 ren06 pozz07 . The formation epoch of the most massive galaxies seems to be constrained to the redshift range , as no evidence of such galaxies has been found at in the GOODS-South field, indicating that these objects must be very rare (if any exists) at very high redshifts dun07 .
Moreover, during the last years, a general consensus has been achieved on the redshift evolution of the total stellar mass density: half of the stellar mass has been assembled in galaxies before the Universe was 30-40% of its present age cap05 cap06k fon04 .
3 Mid-IR-selected galaxies and their link to near-IR galaxies
The study of mid-IR selected galaxies has been a subject of major interest in European astronomy since the launch of the Infrared Space Observatory (ISO) e.g. aus99 gen00 fra01 . The amount of energy contained in the extragalactic IR background () is comparable to that in the optical background dole06 , which emphasizes the importance of understanding the role of mid- and far-IR galaxy populations in the general context of galaxy evolution.
After ISO set the first constraints on the mid-IR Universe up to redshift , Spitzer has allowed us to prove that mid-IR galaxies have in fact a significant contribution up to higher redshifts, e.g.cap06b . A sort of ‘downsizing’ effect is observed in the typical stellar masses of the galaxies hosting the bulk of IR activity: at , most of the IR activity is found in galaxies, while at , an important fraction of the IR activity is concentrated in intermediate-mass galaxies, with cap06b ham05 .
A result that might have come as a surprise is the large fraction of massive galaxies that are experiencing an ultra-luminous IR phase at high redshifts daddi05 cap06c . Very recent results suggest that the AGN contribution to this IR phase at might be much more important than previously thought daddi07 .
The mid-IR LF strongly evolves from to 1 lefl05 cap07 . But, after removing to our best current knowledge the AGN contribution at high redshifts, the mid-IR LF associated with star formation shows only a modest evolution from to cap07 . This is reflected in the observed evolution of the bolometric IR () luminosity density, as shown in Figure 1. From this figure, it is clear that the amount of energy associated with on-going star formation is significantly larger than the light produced by the stars already locked in galaxies at , while the balance is reversed at lower redshifts. The luminosity related to star formation can be interpreted as the gradient of the evolution of the assembled stellar mass. By , 80% of the present-day stellar mass is already in place cap06k , so there is only a minor amount of star formation still needed afterwards to finish assembling our local Universe.
References
- (1) Cimatti, A., Mignoli, M., Daddi, E., et al., 2002, A&A, 392, 395
- (2) Caputi K.I., Dunlop, J.S., McLure, R.J., Roche, N.D., 2005, MNRAS, 361, 607
- (3) Caputi K.I., McLure, R.J., Dunlop J.S., et al., 2006, MNRAS, 366, 609
- (4) Grazian, A., Fontana, A., de Santis, C., et al., 2006, A&A, 449, 951
- (5) Smail I., Owen, F.N., Morrison, G.E., et al., 2002, ApJ, 581, 844
- (6) Roche, N.D., Dunlop, J.S., Almaini, O., 2003, MNRAS, 346, 803
- (7) Caputi K.I., Dunlop, J.S., McLure, R.J., Roche, N.D., 2004, MNRAS, 353, 30
- (8) Roche, N.D., Dunlop J.S., Caputi K.I., et al., 2006, MNRAS, 370, 74
- (9) Pozzetti, L., Cimatti, A., Zamorani, G., et al., 2003, A&A, 402, 837
- (10) Saracco, P., Fiano, A., Chincarini, G., et al., 2006, MNRAS, 367, 349
- (11) Arnouts, S., Walcher, C.J., Le Fèvre, O., et al., 2007, A&A, submitted (arXiv:0705.2438)
- (12) Saracco, P., Longhetti, M., Severgnini, P., et al., 2005, MNRAS, 357, L40
- (13) Thomas, D., Maraston, C., Bender, R., et al., 2005, ApJ, 621, 673
- (14) Franceschini, A., Rodighiero, G., Cassata, P., et al., 2006, A&A, 453, 397
- (15) Renzini, A., 2006, ARA&A, 44, 141
- (16) Pozzetti, L., Bolzonella, M., Lamareille, F., et al., 2007, A&A, submitted (arXiv:0704.1600)
- (17) Dunlop, J.S., McLure, R.J., Cirasuolo, M., 2007, MNRAS, 376, 1054
- (18) Fontana, A., Pozzetti, L., Donnarumma, I., et al., 2004, A&A, 424, 23
- (19) Aussel, H., Cesarsky, C.J., Elbaz, D., et al., 1999, A&A., 342, 313
- (20) Genzel, R. & Cesarsky, C.J., 2000, ARA&A, 38, 761
- (21) Franceschini, A., Aussel, H., Cesarsky, C.J., et al., 2001, A&A., 378, 1
- (22) Dole, H., Lagache, G., Puget, J.-L., et al., 2006, A&A, 451, 417
- (23) Caputi K.I., Dole, H., Lagache, G., et al., 2006, ApJ, 637, 727
- (24) Hammer F., Flores, H., Elbaz, D., et al., 2005, A&A, 430, 115
- (25) Daddi, E., Dickinson, M., Chary, R., et al., 2005, ApJ, 631, L13
- (26) Caputi, K.I., Dole, H., Lagache, G., et al., 2006, A&A, 454, 143
- (27) Daddi, E., Alexander, D. M. , Dickinson, M., et al., 2007, ApJ, submitted (arXiv:0705.2832)
- (28) Le Floc’h, E., Papovich, C., Dole, H., et al., 2005, ApJ, 632, 169
- (29) Caputi, K.I., Lagache, G., Yan, L., et al., 2007, ApJ, 660, 97