Cold -Process in Neutrino-Driven Winds
Abstract
The -process in a low temperature environment is explored, in which the neutron emission by photodisintegration does not play a role (cold -process). A semi-analytic neutrino-driven wind model is utilized for this purpose. The temperature in a supersonically expanding outflow can quickly drop to a few K, where the ()-() equilibrium is never achieved during the heavy -nuclei synthesis. In addition, the neutron capture competes with the -decay owing to the low matter density. Despite such non-standard physical conditions for the cold -process, a solar-like -process abundance curve can be reproduced. The cold -process predicts, however, the low lead production compared to that expected in the traditional -process conditions, which can be a possible explanation for the low lead abundances found in a couple of -process-rich Galactic halo stars.
Subject headings:
nuclear reactions, nucleosynthesis, abundances — stars: abundances — stars: neutron — supernovae: general1. Introduction
It has been generally believed that the high entropy supernova ejecta (neutrino-driven wind) is the likely site for the rapid neutron-capture (-) process (Woosley & Hoffman, 1992; Meyer et al., 1992; Woosley et al., 1994; Takahashi et al., 1994). In the previous nucleosynthesis calculations related to the neutrino-driven wind scenario, the -process has been examined in sufficiently high temperature conditions, such that (where is the temperature in units of K). This physical condition, as well as the high neutron number density ( cm-3), has long been considered as the physical requirements to account for the solar -process abundance curve (Mathews & Cowan, 1990; Kratz et al., 1993). However, if the neutrino-driven outflow becomes supersonic, the temperature can quickly fall below (Arcones et al., 2007).
Wanajo et al. (2002) have examined the -process in such supersonically expanding outflows by introducing the “freezeout temperature” (or in units of K) that mimics the abrupt wind deceleration by the preceding supernova ejecta. In their calculations, the solar -process curve around the third abundance peak () was best reproduced with , and the lower (down to 0.6) resulted in forming a lower shifted peak. As shown in Arcones et al. (2007), however, it is quite possible that the wind temperature drops to a few K before deceleration.
In this Letter, the -process in such a low temperature environment (hereafter “cold -process”) is explored. A semi-analytic neutrino-driven wind model (Duncan et al., 1986; Qian & Woosley, 1996; Cardall & Fuller, 1997; Otsuki et al., 2000; Wanajo et al., 2001; Thompson et al., 2001) is used to obtain the thermodynamic histories of outflows (§ 2). Nucleosynthesis calculations in the winds are performed with various including a rather low value that has not been considered in previous works (§ 3). Fundamental behaviors of the cold -processing are then discussed in some detail. In § 4, a possible abundance feature in the cold -process is discussed. Finally, implications of this study are presented (§ 5).
2. Nucleosynthesis in Winds
The wind trajectories are obtained using the semi-analytic, spherically symmetric, general relativistic model of neutrino-driven winds (Wanajo et al., 2001, 2002). The rms average neutrino energies are taken to be 10, 20, and 30 MeV, for electron, anti-electron, and the other flavors of neutrinos, respectively. The mass ejection rate at the neutrino sphere is determined so that the wind becomes supersonic through the sonic point.
The neutron star mass is taken to be . The radius of neutrino sphere is assumed to be as a function of neutrino luminosity , where , , and . This mimics the early time evolution of in hydrodynamic simulations (Woosley et al., 1994). The wind trajectories are calculated for 39 constant with the interval of . In order to link the series of constant trajectories to realistic time-evolving winds, is defined as , where is the post bounce time and s.
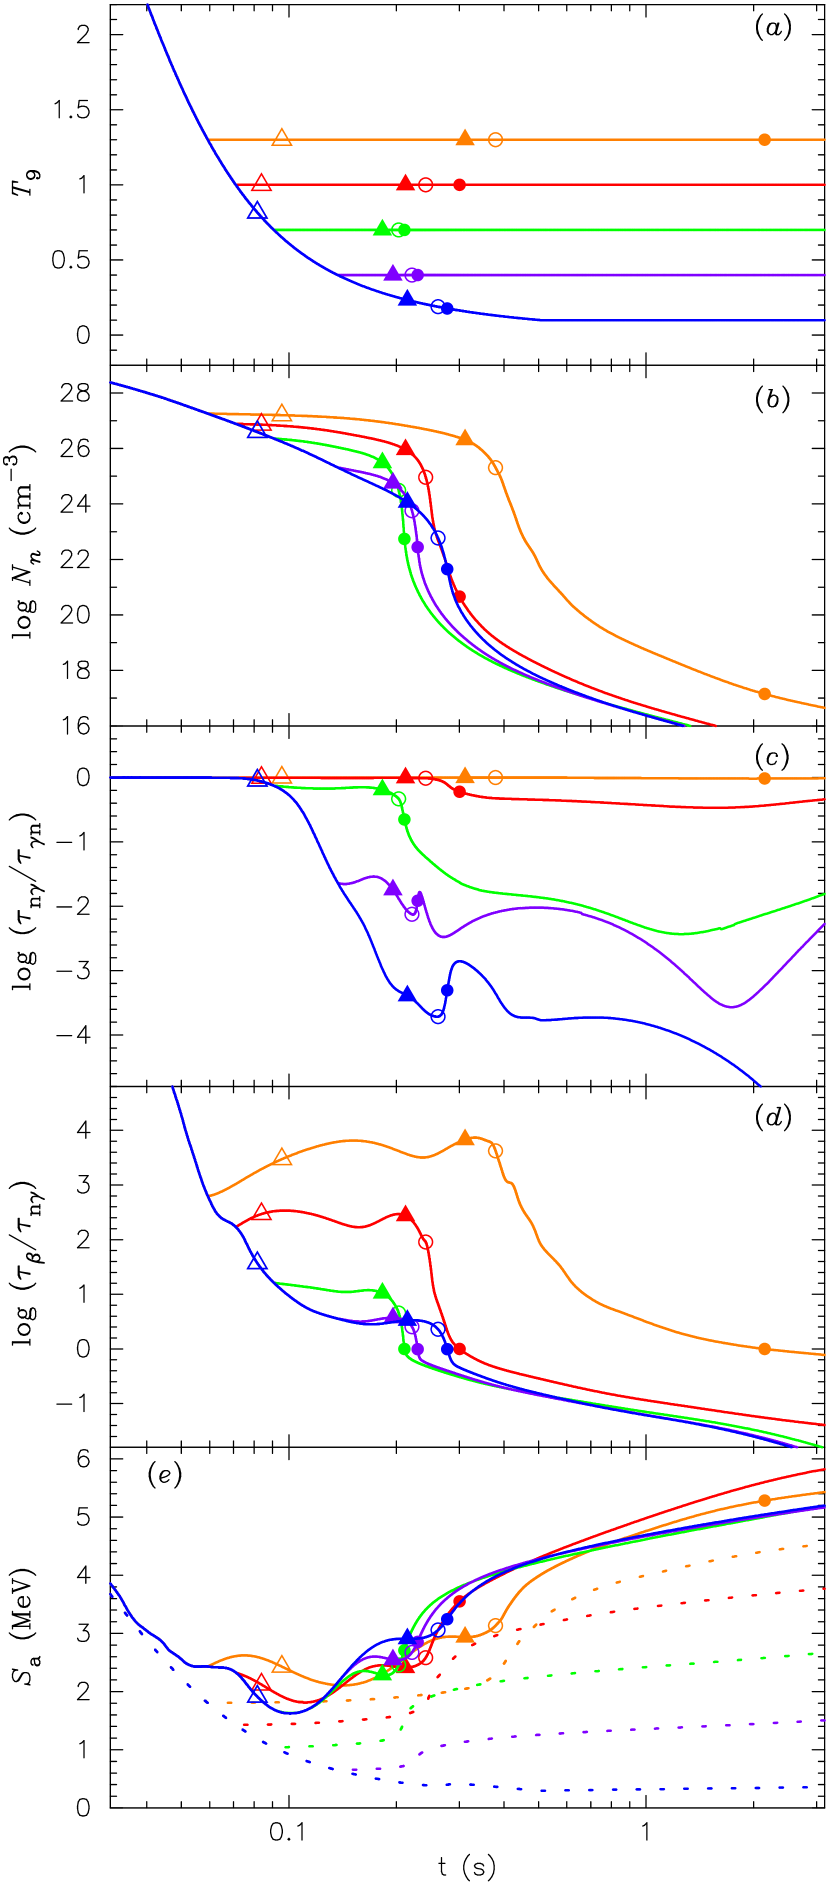
The temperature and density in each wind are set to be constant when decreases to a given freezeout temperature (Fig. 2a), in order to mimic the wind deceleration by the preceding ejecta. In this study, is taken to be 1.3, 1.0, 0.7, 0.4, and 0.1.
The nucleosynthetic yields in each wind are obtained by solving an extensive nuclear reaction network code. The network consists of 6300 species between the proton and neutron drip lines predicted by a recent mass formula (HFB-9, Goriely et al., 2005), all the way from single neutrons and protons up to the isotopes (see Wanajo, 2006, for more detail). The -decay chains and spontaneous fission processes are taken into account only after the freezeout of all other reactions (Cowan et al., 1999; Wanajo et al., 2002). Neutron-induced and -delayed fissions, as well as the contribution of fission fragments to the lighter nuclei, are neglected.
Each nucleosynthesis calculation is initiated when the temperature decreases to , at which only free nucleons exist. The initial compositions are then given by the initial electron fraction (number of proton per nucleon). In order to mimic the hydrodynamic results (Woosley et al., 1994; Arcones et al., 2007), is assumed to be . and are taken to be 0.50 and 0.15, respectively. The latter is rather smaller than that in hydrodynamic results (e.g., in Woosley et al., 1994). This extreme assumption is to obtain the heavy -nuclei abundances with a typical neutron star mass () for the current purpose.
3. Hot -Process vs. Cold -Process
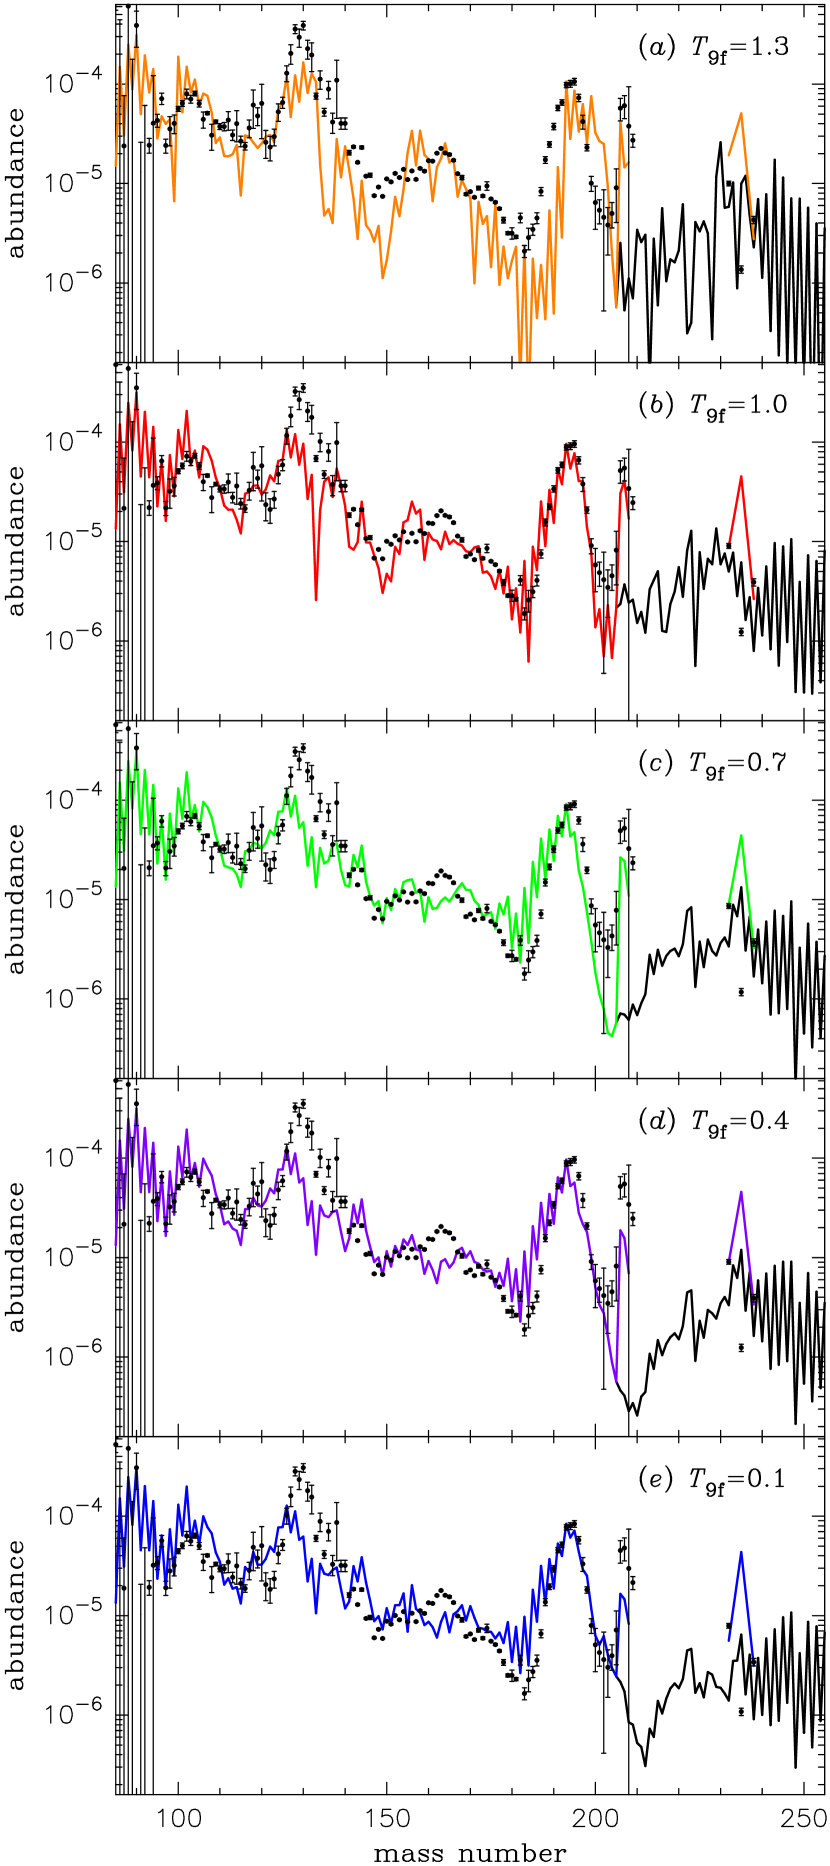
The nucleosynthetic yields in each case are mass-averaged over the 39 wind trajectories weighted by . Figure 1 compares the mass-averaged yields with the solar -process abundances as functions of atomic mass number. We find that, for (Fig. 1a), the third-peak abundances shift to the high side from . In addition, the abundance curve is unacceptably jagged compared to the solar -process pattern. For (Fig. 1b), the third-peak abundances fit the solar -process pattern quite well. For (Fig. 1c), however, the third-peak abundances slightly shift to the low side from .
This can be understood within the classical picture of -process, in which the - equilibrium is justified. That is, for lower , the -process path locates at the more neutron-rich side on the nuclide chart. As a result, the freezeout at takes place at lower (i.e., lower ). Among the above three cases, can be regarded as a reasonable choice to reproduce the heavy -process nuclei in the solar system. We find, however, that this interpretation does not hold in the lower cases. The (Fig. 1d) case reproduces the third-peak abundances even better than the case. Moreover, for (Fig. 1e), the third-peak abundances nicely fit the solar -process curve. This is a consequence of the cold -processing as discussed below.
Figure 2 shows some key physical quantities as functions of time ( at ) in the case. The asymptotic entropy per nucleon in this wind is only 92 (in units of the Boltzmann constant). However, the (artificial) low initial () leads to a high neutron-to-seed ratio () at the beginning of the -process (). Here, and are the abundances of free neutrons and the heavy nuclei (), respectively. At , the abundance-averaged mass number of the heavy nuclei is 103. This is thus taken to be representative of the third-peak forming winds. On each line in Figure 2, open and filled triangles denote the times when decreases to 80 and 10, respectively. The former and latter approximately correspond to the epochs at which the second () and third () peaks form, respectively. Open circles denote the time when decreases to unity, which is referred to as “-exhaustion”. No heavier nuclei are synthesized beyond this stage, but the rearrangement of the local abundance distribution continues.
The ratios and in each case are shown in Figures 2c and 2d, where , , and are the abundance-averaged mean lifetimes of , , and -decay for nuclei, respectively (see eqs. (3) and (4) in Wanajo et al., 2004). These represent the lifetimes of the dominant species at a given time. The condition is referred to as “freezeout” (filled circles; Fig. 2). The abundance curve fixes at this time. Note that the classical -process is characterized by the conditions and .
As can be seen in Figure 2c, the second peak forms at s in all cases, where . This means that the second peak forms under the condition of the - equilibrium. For , this condition holds during the whole stage of the -process. For , slightly decreases after -exhaustion and a quasi - equilibrium continues until freezeout. For , slightly decreases after the second-peak formation and a quasi equilibrium continues by the third-peak formation. In these cases, therefore, the temperature is enough high to maintain the (quasi) - equilibrium during the major -process phase. Hereafter, the case is taken to be representative of the -process in a high temperature environment (hereafter “hot -process”).
In contrast, in lower cases, quickly drops below unity and the - equilibrium is never achieved after the second-peak formation. This is due to the quickly decreasing and , in which the - condition abruptly falls off the “waiting point validity boundary” (Cameron et al., 1983; Mathews & Cowan, 1990; Goriely & Arnould, 1996). The temperature does not play any roles in such an environment, which is thus designated as the cold -process. Hereafter, the case is taken to be representative of the cold -process. One may consider that, without photodisintegration, the -process path approaches the neutron-drip line and the third peak shifts to the rather low side from .
The reason for this misunderstanding can be found in Figure 2d, where the lifetimes of -decay and of neutron capture are compared. The hot -process satisfies the classical -process condition . In the cold -process, however, is only a few times larger than , in which the neutron capture competes with the -decay. This is due to the quickly decreasing in the supersonically expanding wind. Consequently, the nucleosynthetic path of the cold -process is pushed back and locates at a similar position to that of the hot -process.
This is clearly seen in Figure 2e that shows the -process path in each case in terms of the neutron separation energy. Here, (two-neutron separation energy divided by two) is abundance-averaged for the nuclei (), which approximately represents the nucleosynthetic path at a given time111The animations for and 0.1 are available from http//supernova.astron.s.u-tokyo.ac.jp/~wanajo/research.html.. That is, is the neutron-drip line, while a higher locates at closer to the -stability. The path obtained from the - equilibrium condition (, eq. (3) in Goriely & Arnould, 1996) for each is also plotted, which poorly predicts the real path for the cold -process. The cold -process takes a significantly higher than owing to a push-back by -decay. As a result, both the cold and hot -processes trace similar histories. Notably, the freezeout in the and 0.1 cases takes place at similar values. As a consequence, similar -process curves appear as can be seen in Figures 1b and 1e. Note that, for , freezeout occurs at . Hence, any cases would result in the identical abundance curve.
4. Abundance Feature in the Cold -Process
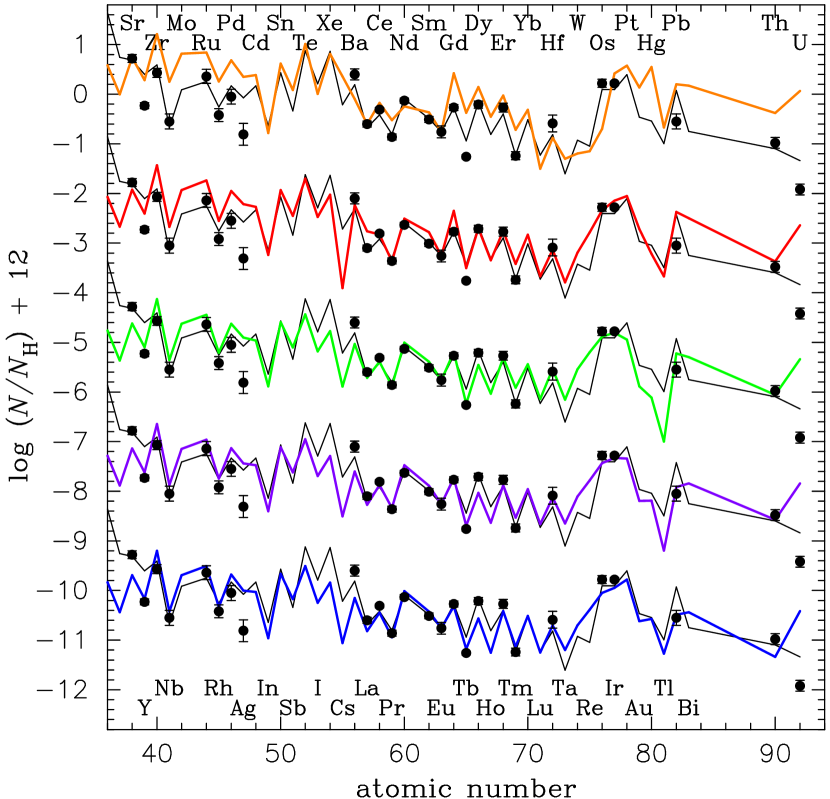
The abundance differences between the hot and cold -processes become further small when plotted as functions of atomic number. Figure 3 compares the mass-averaged abundances with the solar -process curve and the measured elements in the -process-rich Galactic halo star CS 31082-001. All cases, except for , are in reasonable agreement with the solar -process and measured patterns. This may support the robustness of the abundance curves found in the -process-rich stars. Note that the total mass of the -process nuclei () is the same for all cases (), since the seed abundances () are already produced at (). The mass fractions of some measurable elements (and 195Pt) are presented in Table 1, which also shows a small variation between the hot and cold -processes (up to a factor of two, except for ). These differences are small enough, when considering the uncertainties in the nuclear data as well as in the outflow conditions.
We can see, however, a distinctive feature in the abundance curves around (before -decay; black lines in Fig. 1) between the hot and cold -processes. This is due to their different freezeout histories (Fig. 2e). The hot -process (red line) follows a low ( MeV) path at -exhaustion. At this path, a trough at appears in the abundance curve (before -decay, Fig. 1b). This is a consequence that the nuclei at are predicted to be unstable against neutron capture (see the iso- curves in Fig. 6, Wanajo et al., 2004). On the other hand, the cold -process (blue line) takes a high ( MeV) path at -exhaustion (Fig. 2e). Therefore, the trough shifts to . The trough is further eroded by neutron capture without push-back by photodisintegration. As a consequence, the parent nuclei of Pb ( and 234; Fig. 1e) result in being significantly deficient. This may lead to a visible difference in the Pb production (Fig. 3 and Table 1), despite the similar Th+U values222There is a local problem in the odd-even behaviors for (Fig. 1) when the current nuclear data set is utilized. This leads to an unusual pattern among 232Th, 235U, and 238U, which however does not affect the initial Pb abundance. Therefore, only the sum of Th and U are presented..
| Zr | Ba | Eu | Os | Ir | 195Pt | Pb | Th+U | |
|---|---|---|---|---|---|---|---|---|
| 1.3 | 7.58 | 0.56 | 0.14 | 0.19 | 2.59 | 1.86 | 1.67 | 1.40 |
| 1.0 | 7.97 | 1.89 | 0.20 | 2.04 | 3.24 | 1.69 | 2.06 | 1.27 |
| 0.7 | 8.04 | 1.49 | 0.31 | 2.90 | 3.51 | 1.05 | 1.45 | 1.26 |
| 0.4 | 8.02 | 1.32 | 0.32 | 2.71 | 3.49 | 1.25 | 0.97 | 1.31 |
| 0.1 | 7.97 | 1.32 | 0.36 | 2.34 | 2.97 | 1.58 | 0.92 | 1.25 |
5. Implications
In this Letter, the -process in a low temperature environment (; cold -process) was investigated, which is characterized by the conditions and . Despite the fundamental difference of the cold -process compared to the traditional (hot) -process, a solar-like -process curve can be reproduced quite well. These physical conditions are realized in the supersonically expanding neutrino-driven outflows. In particular, the winds from a low-mass progenitor that has a steep core density gradient easily expand to a large distance (and thus to low ) before colliding to the preceding supernova ejecta (Arcones et al., 2007). Therefore, the low-mass end of supernova progenitors (e.g., ) may be the most likely site of the cold -process. The low-mass supernovae have been also suggested to be the -process site from Galactic chemical evolution studies (Mathews & Cowan, 1990; Ishimaru & Wanajo, 1999).
Among the six -process-rich Galactic halo stars currently reported, CS 31082-001 (Plez et al., 2004) and HE 1523-0901 (upper limit, Frebel et al., 2007) appear to have the low Pb abundances compared to the scaled solar -process curve. The upper limit of Pb for BD +17∘3248 (Cowan et al., 2002) is still consistent to the scaled solar value. The other three, CS 22892-052 (Sneden et al., 2003), HD 115444 (Westin et al., 2000), and HD 221170 (Ivans et al., 2006) have the measured Pb abundances consistent to the (high) scaled solar value. The variation of the Pb production may be attributed to the different types of (cold and hot) -processes. The low Pb abundance in CS 31082-001 has been in fact a most worrisome aspect, when the U/Th value is applied for the age dating (Plez et al., 2004). This is hardly explained from the classical (or hot) -process view, in which a low ( MeV) event is inevitable for the third-peak formation. In this regard, the cold -process might enables us to consistently treat the Pb, Th, and U abundances for the cosmochronology.
Finally, it is noted that the cold -process brings us an additional challenge to the theoretical -process study. In most of previous -process calculations, the uncertainties in neutron-capture rates have not been considered seriously. This is reasonable for the hot -process, in which uncertainties even by a factor of ten would not cause a serious problem (see Fig. 2d). In the cold -process, however, the neutron capture competes with the -decay, and thus accurate neutron-capture (as well as -decay) rates will be required to predict reliable -process abundances.
References
- Arcones et al. (2007) Arcones, A., Janka, H. -Th., & Scheck, L. 2007, A&A, 467, 1227
- Burris et al. (2000) Burris, D. L., Pilachowski, C. A., Armandroff, T. E., Sneden, C. Cowan, J. J., & Roe, H. 2000, ApJ, 544, 302
- Cameron et al. (1983) Cameron, A. G., Cowan, J. J., & Truran, J. W. 1983, Ap&SS, 91, 235
- Cardall & Fuller (1997) Cardall, C. Y. & Fuller, G. M. 1997, ApJ, 486, L111
- Cowan et al. (1999) Cowan, J. J., et al. 1999, ApJ, 521, 194
- Cowan et al. (2002) Cowan, J. J., et al. 2002, ApJ, 572, 861
- Duncan et al. (1986) Duncan, R. C., Shapiro, S. L., & Wasserman, I. 1986, ApJ, 309, 141
- Frebel et al. (2007) Frebel, A., Christlieb, N., Norris, J. E., Thom, C., Beers, T. C., & Rhee, J. 2007, ApJ, 660, L117
- Goriely & Arnould (1996) Goriely, S. & Arnould, M. 1996, A&A, 312, 327
- Goriely et al. (2005) Goriely, S., Samyn, M., Pearson, J. M., & Onsi, M. 2005, Nucl. Phys. A, 750, 425
- Hill et al. (2002) Hill, V., et al. 2002, A&A, 387, 560
- Ishimaru & Wanajo (1999) Ishimaru, Y. & Wanajo, S. 1999, ApJ, 511, L33
- Ivans et al. (2006) Ivans, I. I., Simmerer, J., Sneden, C., Lawler, J. E.,Cowan, J.J., Gallino, R., & Bisterzo, S. 2006, ApJ, 645, 613
- Ivarsson, S. et al. (2003) Ivarsson, S., et al. 2003, A&A, 409, 1142
- Käppeler et al. (1989) Käppeler, F., Beer, H., & Wisshak, K. 1989, Rep. Prog. Phys., 52, 945
- Kratz et al. (1993) Kratz, K. -L., Bitouzet, J., -P., Thielemann, F. -K.,Möller, P., & Pfeiffer, B. 1993, ApJ, 403, 216
- Mathews & Cowan (1990) Mathews, G. J. & Cowan, J. J 1990, Nature, 345, 491
- Meyer et al. (1992) Meyer, B. S., Mathews, G. J., Howard, W. M., Woosley, S. E., & Hoffman, R. D. 1992, ApJ, 399, 656
- Otsuki et al. (2000) Otsuki, K., Tagoshi, H., Kajino, T., & Wanajo, S. 2000, ApJ, 533, 424
- Qian & Woosley (1996) Qian, Y. -Z. & Woosley, S. E. 1996, ApJ, 471, 331
- Sneden et al. (2003) Sneden, C., et al. 2003, ApJ, 591, 936
- Plez et al. (2004) Plez, B., et al. 2004, A&A, 428, L9
- Takahashi et al. (1994) Takahashi, K., Witti, J., & Janka, H. -T. 1994, A&A, 286, 857
- Thompson et al. (2001) Thompson, T. A., Burrows, A., & Meyer, B. S. 2001, ApJ, 562, 887
- Wanajo et al. (2001) Wanajo, S., Kajino, T., Mathews, G. J., & Otsuki, K. 2001, ApJ, 554, 578
- Wanajo et al. (2002) Wanajo, S., Itoh, N., Ishimaru, Y., Nozawa, S., & Beers, T. C. 2002, ApJ, 577, 853
- Wanajo et al. (2004) Wanajo, S., Goriely, S., Samyn, M., & Itoh, N. 2004, ApJ, 606, 1057
- Wanajo (2006) Wanajo, S. 2006, ApJ, 647, 1323
- Westin et al. (2000) Westin, J.,Sneden, C., Gustafsson, B.,Cowan, J. J. 2000, ApJ, 530, 783
- Woosley & Hoffman (1992) Woosley, S. E. & Hoffman, R. D. 1992, ApJ, 395, 202
- Woosley et al. (1994) Woosley, S. E., Wilson, J. R., Mathews, G. J., Hoffman, R. D., & Meyer, B. S. 1994, ApJ, 433, 229