Free flux flow magneto-resistance of single crystal BSCCO
Abstract
Measurement of the free flux flow resistance in monocrystalline highly anisotropic BSCCO reveals a low field magneto-resistive effect nearly times that expected from a naive application of the Bardeen-Stephen rule . Furthermore in the vortex solid phase it saturates to a constant value at about as if the vortices were moving times faster than expected. An attempt to account for this behavior by a combination of sheared planar vortex flow obeying the BS rule and the quasi-particle axis conductivity between the Josephson coupled superconducting planes is only partially successful. In particular it is unable to account for the saturation feature which occurs in both optimally and underdoped samples in the low temperature vortex solid phase.
pacs:
74.72.Hs, 74.25.Fy, 74.25.Qt, 74.25.SvI Introduction
High Tc cuprate superconductors differ from their low Tc counterparts in their extreme type II character with a Ginzburg-Landau parameter corresponding to extremely short coherence length nm and high upper critical fields T. The small Abrikosov vortex core size of order results in a series of bound states with energies situated in the gap whose mean energy spacing is of order where is the superconductor gap energy (modulus of the order parameter), the Fermi energy and the effective mass. The core structure can affect the mobility for translational motion of the vortices by modifying the spectral properties of the electron momentum transfer.
Dissipation in type II superconductors in magnetic field in slowly varying electromagnetic fields is dominated by the dynamics of Abrikosov vortices kop . Material details of the superconductor enter mainly via the “friction coefficient” that gives the vortex velocity in terms of the driving Magnus-Lorentz force. The friction is controlled by the spectral density and relaxation properties of the low-lying “core states”, i.e., quasiparticle states localized to the vortex core. In dirty superconductors, where the mean free path , the friction coefficient is related to the normal state resistivity by the Bardeen-Stephen (BS) rule bar :
| (1) |
where is the flux flow resistivity arising from vortex motion in the absence of pinning, is the normal state resistivity, is the magnetic field, the upper critical field and . A more careful examination of the core states allowed the extension of Eq. (1) with to the moderately clean limit as well kop . The BS law has been experimentally confirmed for a broad range of conventional (-wave) superconductors par .
In unconventional superconductors with gap nodes, BCS theory suggests a high density of core states at the Fermi energy. Nevertheless calculation Kopnin and Volovik (1997) of the flux-flow resistivity revealed that as long as one stays in the moderately clean limit, Eq. (1) remains valid with a possible enhancement of but still of order . Recent measurements alp on several anisotropic non-high- superconductors that most likely exhibit gap nodes confirm Eq. (1) with a moderately enhanced
The problem of low-temperature vortex dynamics in BSCCO (Bi2Sr2CaCu2O is particularly interesting in this respect in the light of the recent results on the structure of the vortices in this material. Scanning tunneling microscope (STM) spectroscopy mag revealed that the zero-energy peak in the density of core states is missing. This, together with the results of inelastic neutron scattering Lake et al. (2001) and NMR Mitrovic et al. (2001) experiments, led to the suggestion that some concurrent, non superconducting, order exists at the vortex cores when the superconducting order parameter is suppressed Kivelson et al. (2002). The idea received direct support from STM spectroscopyHoffman et al. (2002) where a periodic modulation of the local density of electronic states around the vortex cores was observed. Since the decay length of this modulation is much longer than the superconducting coherence length, not only the structure of the core, but also the structure of the flow field for vortex transport should be different from conventional Abrikosov vortices with probable consequences for the velocity-force relation.
The experimental situation in the high- superconductors, and in particular in BSCCO, is not clear. Low-frequency transport measurements Xiao et al. (1998) in the vortex liquid phase close to the critical temperature are in reasonable agreement with the BS law. Microwave and millimeter wave impedance measurements Mallozzi et al. (1998) at low temperatures, on the other hand, indicate a large and nearly -independent dissipation in a broad field range.
To clarify the situation and to see if these very special aspects of the vortex structure influence the dynamics, we have performed a systematic investigation of the flux-flow resistance in BSCCO single crystals by measuring the - plane voltage-current (-) characteristics up to currents well above the threshold current for dissipation in -directed magnetic field. The free flux-flow resistance as measured on an face can be approximately described as for low fields followed by saturation (becomes field independent) above about 1 T in the low-temperature vortex solid phase. As the saturated value corresponds quite well with the extrapolation of the normal resistance to low temperatures, it might be naively interpreted as reflecting in Eq. (1), at least at 1 T, indicating that vortices move at up to two orders of magnitude faster than predicted by BS law in low fields. Although it is known that vortex velocities much larger than the BS value may result from a nonlinear instability at high vortex velocities Larkin and Ovchinnikov (1975), not only does its onset in BSCCO filmsXiao et al. (1998) occur at current densities about two orders of magnitude higher than investigated in this study, the characteristic signature Xiao et al. (1998); Kunchur (2002) of a nonlinear runaway in the - curve is absent in our case.
II Experiment
Measurements were made on nine single crystals from three different batches of Bi2Sr2CaCu2O8+δ fabricated by a melt cooling technique sam . The typical dimensions of the crystals were mm3 with the shortest dimension corresponding to the poorly conducting axis. Most of the crystals have been close to optimal doping with a resistance-determined critical temperature K and transition width about 2 K in zero field. The diamagnetism in a Oe field set in in a uniformly progressive way below to near at low temperature. Two underdoped crystals exhibited a resistive K and K with width 6-8 K and slow initial diamagnetism onset to about K before proceeding to about flux exclusion at low temperature.
The resistance measurements were made in the usual four point configuuration on an face of the crystals. The contacts to inject and withdraw the current are either on the top - face or encompass the ends of the crystal extending to both opposing - faces. The features reported here are common to both geometries. Four more contacts on the same - face as the current injection serve to measure the voltage parallel and transverse to the current flow. The contacts are made by bonding 25 gold wires with silver epoxy fired at K in an oxygen atmosphere resulting in contact resistances of less than 3 for the current contacts. The sample is inserted in the bore of a superconducting magnet with the field along the direction.
To measure at the high currents required for the free flux flow regime without significant Joule heating, we apply short (typically 50 s or less) current pulses of isosceles triangular shape with a repetition period of 0.2 to 1 s. Further technical details are given and the issue of Joule heating for the such experimental conditions is analyzed in Ref. Sas et al. (2000) with the conclusion that the temperature change in the area between the voltage contacts is negligible for the duration of the pulse.
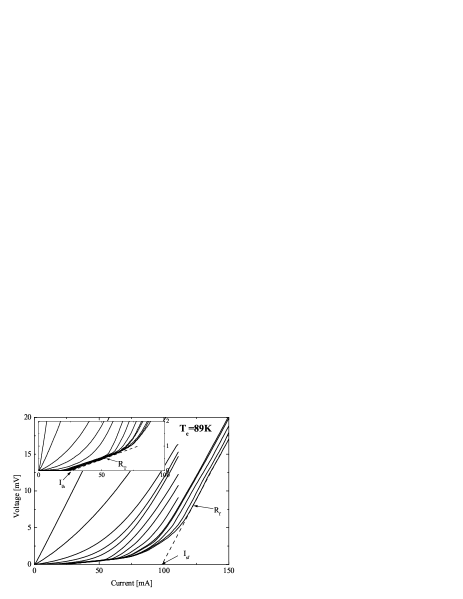
Typical - characteristics measured at different temperatures and in a field of 3 T are shown in Fig. 1. At temperatures below the vanishing of zero current resistance, which we interpret as the freezing of the vortex system (in T this happens at K), dissipation sets in abruptly beyond a sharply defined threshold current . Usually, but not always Sas et al. (2000), a linear segment appears above the threshold current (see insert) the slope of which we denote by . At higher currents, the differential resistance increases further and saturates at a value in the high-current limit. The high-current linear segment of the - characteristic extrapolates to finite current at zero voltage. Above the melting temperature, a finite differential resistance is observed in the limit. The - curve, however, is still nonlinear and is finite up to a temperature situated between the melting temperature and the critical temperature .
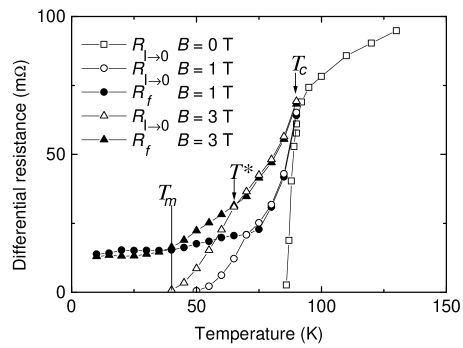
The temperature dependence of the low-current and high-current differential resistances, and , are shown in Fig. 2 for two magnetic fields. Between and a field dependent characteristic temperature , these two differential resistances are identical (the - curve is linear). At the two resistance curves bifurcate; decreases rapidly with decreasing temperature and reaches zero ( ) at what is taken to be the melting temperature, , while the high-current resistance remains finite and varies smoothly across the melting line. The “pinned liquid” domain extends over where signs of pinning are still present. Below , in the vortex solid phase, is zero and attains a finite, temperature-independent value visible in Fig. 2. Moreover, this value is the same for 1 T and 3 T and agrees reasonably with a linear extrapolation of the normal phase resistance to low temperature.
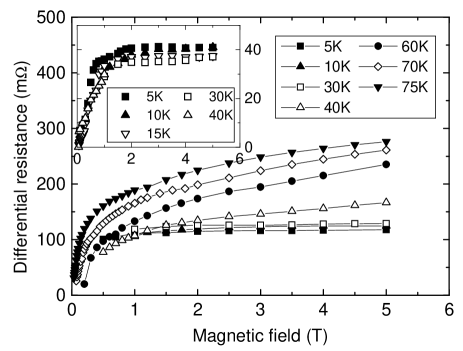
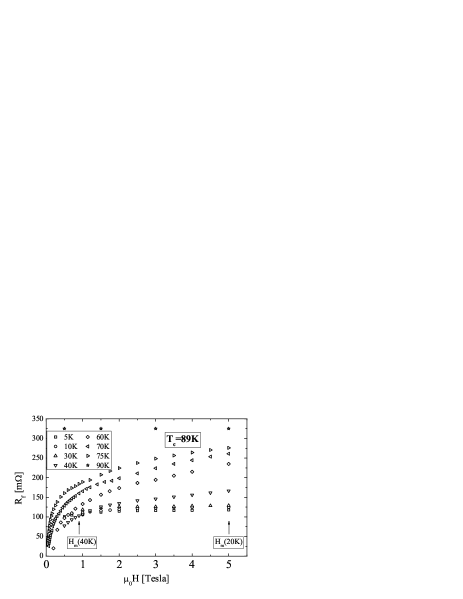
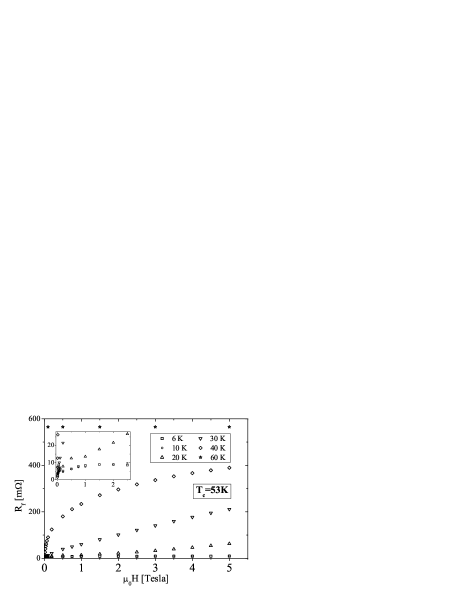
More insight on the low-temperature saturation of the high-current resistance is gained from its field dependence for several temperatures shown in Fig. 2. In the liquid phase, we find an approximately field dependence over the whole field range. In the solid phase, however, becomes independent of magnetic field above about 1 T. On one sample the measurements were extended to 17 T at 5 K and no variation of in excess of the experimental uncertainties of about 10 % were found in the field range 1 to 17 T, in contrast to the 17-fold increase predicted for the resistivity by Eq. (1). The differential resistance close to the threshold current, , behaves similarly (see inset). In fact, in the parameter range where both quantities can be measured, we find a field and temperature independent proportionality between and .
The behavior of the characteristic currents and further corroborates the similarities of the dissipation mechanisms close to threshold and in the high-current limit. The similarity is again underlined by the same field dependence for both quantities in the low temperature region. All these observations suggest that the same mechanism is responsible for the dissipation in the vicinity of the threshold current as in the high-current limit. The similarity of behavior is attributed to the way in which the resistive front propagates from the current contacts towards the middle of the sample as the current is increasedPethes et al. (2003). The current distribution reaches the resistive limit characterised by only after the two resistive fronts meet. As described earlierSas et al. (2000) at low temperature there is a difference between field cooled (FC) and zero field cooled (ZFC) preparation. The ZFC data for both and exhibit a characteristic peak at the same line in the plane which defines a low temperature region where the FC prepared state is only metastable. Both FC and ZFC preparations give rise to the same .
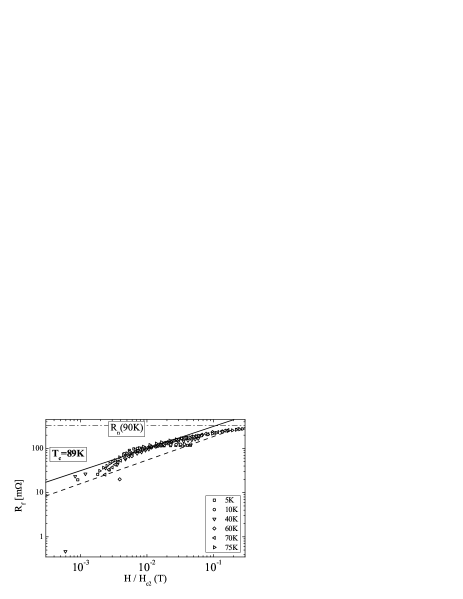
A first analysis to get our bearings consists of normalizing the resistance to the resistance measured in the normal phase and the field to A refinement on this is to estimate what the normal resistance would have been at the temperature of the measurement were the sample not superconducting. Following this procedure and noting that when the magnetoresistance value saturates with field its value approximates the expected normal resistance, it has been hypothesised to be just that and the value used to better interpolate the normal resistance. For the upper critical field, we use the form yielding T/K Li et al. (1993). To estimate in the range, we use a quadratic interpolating function to connect with the range on the hypothesis that the field saturation value for corresponds to . For the very low field data below about T where we could not apply sufficient current to reach the asymptote, we used the temperature and field independent scaling factor between and found at higher fields to estimate from the measurement of The flux flow resistance data treated in this way are displayed in Fig. 4.
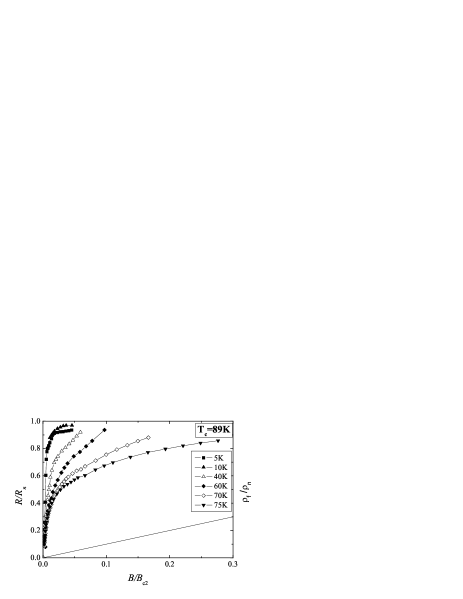
It is evident from Fig. 4 that the ratio of flux flow resistance to normal resistance is very different from the field proportional BS resistivity ratio of Eq. (1), ranging from a like variation at low field to a saturation value for the low temperature vortex solid phase. Nonetheless there is a trend that with increasing temperature, in the vortex liquid phase, the saturation feature disappears, at least for the field values accessible to us. In the solid phase at low temperatures there is strictly no field dependence of whatsoever above about 1 T although as mentioned above its value is in good agreement with the linear extrapolation to of the normal resistance measured above . Since the field where saturation occurs is in the order of , it might appear that for fields below saturation, the vortices move times faster than expected, or that the vortex friction coefficient is smaller, from a simple application of the BS relation.
III Framework for understanding
The experiment measures resistance and the ratio of resistances is only proportional to the ratio of resistivities if the current distributions are identical. This is not the case in anisotropic materials like BSCCO where the current penetration depth is determined by the anisotropy of the resistivity. The latter is not only different in the superconducting state but is also field dependent. From this point of view we might interpret the comparison made in Fig. 4 as an indication that the current penetration is considerably less in the low temperature vortex solid phase, progressively approaching the normal phase penetration depth at higher temperatures in the vortex liquid phase. Indeed in the liquid phase, the data are in rough agreement with BS law if the effects of inhomogeneous current distribution within the sample are taken into account.
The voltage measured on the top plane of the sample is affected by the -axis properties because they influence the distribution of the transport current within the sample Pethes et al. (2003). In the simplest approach we could suppose that well into the ohmic response regime the current is distributed as for a normal anisotropic ohmic conductorBusch et al. (1992), a surmise which is borne out by numerical simulations based on the superconductor model of Ref.Pethes et al. (2003). The penetration depth for a length between current injection points on the surface is then given by (provided sample thickness) and the resistance along the length of the sample will scale like . If of Eq. (1) and the resistive response of the Josephson coupled planes in the superconducting phase is represented by , one obtains . Results close to are indeed well described by this form. Putting the 75-K data in Fig. 4, for instance, are reasonably well fitted with , which, given the uncertainties of the simple resistive thick-sample estimate, we regard as rough agreement with BS law. The crux of the matter then, from this viewpoint, is in
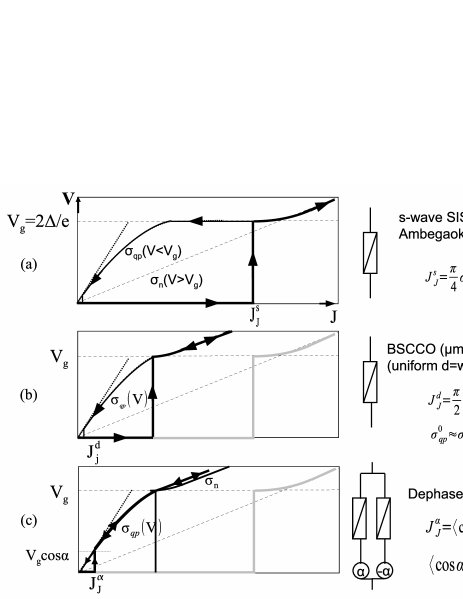
The axis conductivity can be obtained from the characteristics of the interplane Josephson junctions. The usual representation of a Josephson junction in a classical s-wave superconductor subject to a spatially uniform phase difference is illustrated on Fig. 5a: the voltage response to current is nil up to the Josephson current at which point the junction opens to and responds to further current according to the normal phase tunnel conductance which is related to the critical current by the Ambegaokar-Baratoff relation . For currents the axis resistivity is that apppropriate to the normal state Assuming the penetration depth to be limited by the resistive anisotropy gives the result quoted above, but this regime would only be attained for extreme currents Acm-2 corresponding to A for our samples. That is clearly not the regime which concerns us here.
The answer to this problem seems to be that the Josephson critical currents are much lower than the Ambegoakar-Baratoff prediction. Measurements Latyshev et al. (1999) on micrometer size mesa stacks of BSCCO junctions at zero field show much lower critical currents, where the quasi-particle conductivity as at low temperature and mV yielding Acm As illustrated schematically on Fig. 5b the opening of the junction is followed by a voltage response at higher currents with slope when But even this intermediate régime is not observed: a penetration depth of nm corresponding to an anisotropy factor would involve planes and a voltage response of V, still a factor of higher than observed in our measurements. To understand what we see, we must take account of the non-uniformity of the phase across the planes due to the random positioning of vortices from plane to plane. The critical current for the junction is then reduced to where represents the phase difference across the junction at position in the plane and the value of averaged over the junction area on a Josephson penetration length scaleShibauchi et al. (1999); Gaifullin et al. (2000). It is typically of order As illustrated on Fig. 5c, the junction will then open to a potential difference of due to phase slippage at , beyond which it should continue to see a tunneling conductance of quasi-particles in the gap until when the tunneling of quasi particles at the gap edge will result in the usual normal phase dynamic conductance. The gap quasi-particle conductance is thus experienced over a wide current range between and over which the resistance ratio is considerably enhanced to where at low temperatureLatyshev et al. (1999), again if we assume Eq. (1) to be valid for the second square root term. The magnetic field dependence of was measured in a subsequent experimentMorozov et al. (2000), also on micrometer size mesa samples. If finally we include also the effect of quasi-particle conductance in the plane, we find
| (2) |
This is the expression that we compare with the experimental results on Figs. 6(a)-(d).
IV Interpretation of results
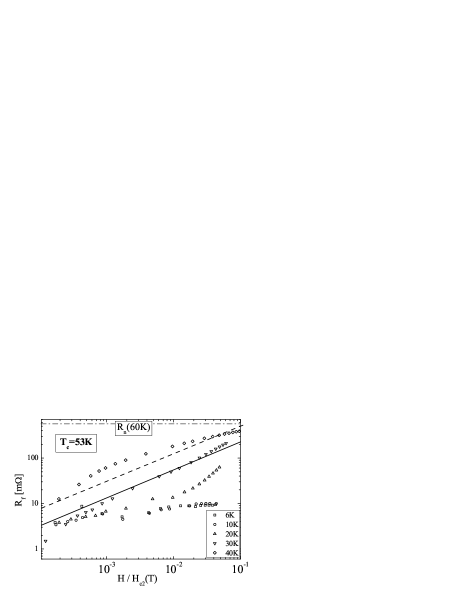
Equation (2) is compared with the experimental findings for both the optimal doped and the underdoped samples on Figs. 6. For simplicity a single plot of Eq. (2) is drawn as a dashed line on the log-log plot against where is the temperature corrected value as described above. It corresponds to a choice of parameter values appropriate to the optimally doped situation at low temperature : T, Latyshev et al. (1999), , Morozov et al. (2000), and corresponding to a linear extrapolation to . A parallel solid line is also drawn as the best fit to the data.
We note that:
1. The order of magnitude is correct to within a factor of 2 for both optimal and underdoped samples, with the notable exception of the saturation plateau values in the vortex solid phase, especially in the underdoped sample.
2. The square root behavior predicted by the BS relation is approximately correct, again with the obvious exception of the plateaus.
3. The magneto-resistance plateaus are all situated in the vortex solid phase. It is to be remarked that the K magneto-resistance in the underdoped sample begins to saturate, but on reaching about T it reverts to an increasing power law. The melting field for K is estimated to be about T from the appearance of finite .
Clearly Equation (2) does not describe all the features of the magneto-resistance, even if it does reasonably well for temperatures above the vortex solid melting and in the solid region for fields below the saturation. It has a structure which could in principle describe a plateau if the coefficient in the field dependence of the shunt conductance of the Josephson coupled layers were to be much larger such as might be introduced by aligned vortex core NIN tunneling junctions or possibly -wave node quasi-particle to vortex core tunneling. Such effects have not however been seen in the mesa magneto-conductivity measurementsMorozov et al. (2000), although these were performed at relatively high temperature ( K) and high field, so in the vortex liquid phase.
V Conclusion
It is difficult to conclude that the BS relation is untrue, either by a multiplicative factor or in its form. To determine the multiplicative factor requires a good way of estimating the normal resistivities in the superconducting phase. Also, because the agreement is reasonably good at high temperature and the vortex entity is not expected to change nature from high to low temperature, the serious disagreement at low temperature is much more likely to be related to the nature of the solid phase as the BS relation is a single vortex property.
It can however be concluded from the sublinear, approximately , field dependence that if the linear field dependence of the BS relation is correct, the current distribution is not constant and its penetration depth is controlled by the resistive anisotropy and thus by .
VI Acknowledgements
We acknowledge with pleasure fruitful discussions with F.Portier, I.Tutto, L.Forro and T.Feher and the help and technical expertise of F.Toth. L.Forro and the EPFL laboratory in Lausanne have contributed in a very essential way to sample preparation and characterisation. Finally we acknowledge with gratitude the OTKA funding agency for OTKA grant no. K 62866.
References
- (1) For a review, see N. B. Kopnin, Theory of Nonequilibrium Superconductivity (Oxford University Press, 2001).
- (2) J. Bardeen and M. J. Stephen, Phys. Rev. 140, A1197 (1965); P. Nozières and W. F. Vinen, Philos. Mag. 14, 667 (1966).
- (3) For a review, see D. Parks, Ed., Superconductivity (Dekker, New York, 1969).
- Kopnin and Volovik (1997) N. B. Kopnin and G. E. Volovik, Phys. Rev. Lett. 79, 1377 (1997).
- (5) S. Kambe, A. D. Huxley, P. Rodičre, and J. Flouquet, Phys. Rev. Lett. 83, 1842 (1999); N. Lütke-Entrup R. Blaauwgeers, B. Plaçais, A. Huxley, S. Kambe, M. Krusius, P. Mathieu, and Y. Simon, Phys. Rev. B 64, 020510(R) (2001); Y. Matsuda, A. Shibata, and K. Izawa, Phys. Rev. B 66, 014527 (2002).
- (6) I. Maggio, Ch. Renner, A. Erb, E. Walker, and Ř. Fischer, Phys. Rev. Lett. 75, 2754 (1995); Ch. Renner, B. Revaz, K. Kadowaki, I. Maggio-Aprile, and Ř. Fischer, Phys. Rev. Lett. 80, 3606 (1998).
- Lake et al. (2001) B. Lake, G. Aeppli, K. N. Clausen, D. F. McMorrow, K. Lefmann, N. E. Hussey, N. Mangkorntong, M. Nohara, H. Takagi, T. E. Mason, et al., Science 291, 1759 (2001).
- Mitrovic et al. (2001) V. F. Mitrovic, E. E. Sigmund, M. Eschrig, H. N. Bachman, W. P. Halperin, A. P. Reyes, P. Kuhns, and W. G. Moulton, Nature (London) 413, 501 (2001).
- Kivelson et al. (2002) S. A. Kivelson, D.-H. Lee, E. Fradkin, and V. Oganesyan, Phys. Rev. B 66, 144516 (2002).
- Hoffman et al. (2002) J. E. Hoffman, E. W. Hudson, K. M. Lang, V. Madhavan, H. Eisaki, S. Uchida, and J. C. Davis, Science 295, 466 (2002).
- Xiao et al. (1998) Z. L. Xiao, P. V. de Haan, G. Jakob, and H. Adrian, Phys. Rev. B 57, R736 (1998).
- Mallozzi et al. (1998) R. Mallozzi, J. Orenstein, J. N. Eckstein, and I. Bozovic, Phys. Rev. Lett. 81, 1485 (1998).
- Larkin and Ovchinnikov (1975) A. I. Larkin and Y. N. Ovchinnikov, Zh. Eksp. Teor. Fiz. 68, 1915 (1975), Sov. Phys. JETP 41, 960 (1976) .
- Kunchur (2002) M. N. Kunchur, Phys. Rev. Lett. 89, 137005 (2002).
- (15) B. Keszei, GY. Szabó, J. Vandlik, L. Pogány, and G. Oszlányi.
- Sas et al. (2000) B. Sas, F. Portier, K. Vad, B. Keszei, L. F. Kiss, N. Hegman, I. Puha, S. Mészáros, and F. I. B. Williams, Phys. Rev. B 61, 9118 (2000).
- Pethes et al. (2003) I. Pethes, A. Pomar, B. Sas, G. Kriza, K. Vad, A. Pallinger, F. Portier, and F. I. B. Williams, Phys. Rev. B 68, 184509 (2003).
- Li et al. (1993) Q. Li, K. Shibutani, M. Suenaga, I. Shigaki, and R. Ogawa, Phys. Rev. B 48, 9877 (1993).
- Busch et al. (1992) R. Busch, G. Ries, H. Werthner, G. Kreiselmeyer, and G. Saemann-Ischenko, Phys. Rev. Lett. 69, 522 (1992).
- Latyshev et al. (1999) Y. I. Latyshev, T. Yamashita, L. N. Bulaevskii, M. J. Graf, A. V. Balatsky, and M. P. Maley, PRL 82, 5345 (1999).
- Shibauchi et al. (1999) T. Shibauchi, T. and Nakano, M. Sato, T. Kisu, N. Kameda, N. Okuda, S. Ooi, and T. Tamegai, Phys. Rev. Lett. 83, 1010 (1999).
- Gaifullin et al. (2000) Y. Gaifullin, M. B. and Matsuda, N. Chikumoto, J. Shimoyama, and K. Kishio, Phys. Rev. Lett. 84, 2945 (2000).
- Morozov et al. (2000) N. Morozov, L. Krusin-Elbaum, T. Shibauchi, L. N. Bulaevskii, M. P. Maley, Y. I. Latyshev, and T. Yamashita, Phys. Rev. Lett. 84, 1784 (2000).