On-sky observations with an achromatic hybrid phase knife
coronagraph in the visible
Abstract
Context. The four-quadrant phase mask stellar coronagraph, introduced by D. Rouan et al., is capable of achieving very high dynamical range imaging and was studied in the context of the direct detection of extra-solar planets. Achromatic four-quadrant phase mask is currently being developed for broadband IR applications.
Aims. We report on laboratory and on-sky tests of a prototype coronagraph in the visible. This prototype, the achromatic hybrid phase knife coronagraph, was derived from the four-quadrant phase mask principle.
Methods. The instrumental setup implementing the coronagraph itself was designed to record the pre- and post-coronagraphic images simultaneously so that an efficient real-time image selection procedure can be performed. We describe the coronagraph and the associated tools that enable robust and repeatable observations. We present an algorithm of image selection that has been tested against the real on-sky data of the binary star HD~80 081 (* 38 Lyn).
Results. Although the observing conditions were poor, the efficiency of the proposed method is proven. From this experiment, we derive procedures that can apply to future focal instruments associating adaptive optics and coronagraphy, targeting high dynamic range imaging in astronomy, such as detecting extra-solar planets.
Key Words.:
Instrumentation: miscellaneous – Methods: data analysis – Atmospheric effects – (Stars:) binaries: general1 Introduction
The imagery of the faint structures of astronomical objects at high angular resolution (close to the diffraction limit) is a difficult challenge. The current ultimate goal is to directly observe extra-solar planets, whose existence has been unambiguously confirmed by Mayor & Queloz (mayor1995 (1995)). Since then, high dynamic range imaging techniques and subsequent instrumental innovations have triggered the development of ambitious ground-based and space-borne projects to reach this challenging exo-planet direct-detection goal. In this context, stellar coronagraphy has emerged with the proposal of numerous coronagraphic techniques – e.g. AIC (Gay et al. gay1997 (1997)), phase mask (Roddier et al. roddier1997 (1997)), four quadrant and phase knife (Rouan et al. rouan2000 (2000); Abe et al. abe2001a (2001)), binary-shaped masks (Spergel et al. spergel2001 (2001); Vanderbei et al. vanderbei2004 (2004)), pupil apodized Lyot (Aime et al. aime2002 (2002)), two-mirror apodization (Guyon guyon2003 (2003)), band-limited coronagraphs (Kuchner et al. kuchner2002 (2002)) – all capable, in theory, of being efficient enough to perform direct detection at the contrast ratio. Nevertheless, further studies led to the conclusion that the main limitations to achieving this performance do not come from the high dynamic range imaging concept itself, but rather from all the opto-mechanical environment.
Contrary to the instrument design considerations concerning the rejection of undesired scattered-light, the aspect of observing strategies and image analysis/interpretation in coronagraphy is not taken sufficiently into account. Coronagraphic imaging is a highly non-linear process, resulting in a point-spread-function (PSF) variant by translation. As a consequence, interpreting images requires a high level of knowledge of its instrumental environment (where many kind of calibration paths are needed, resulting in a global loss of throughput at the level of the science camera).
The purpose of this paper is twofold. First, we describe a prototype of an achromatic phase knife coronagraph (Abe et al. abe2001a (2001)) and its performance obtained in a laboratory experiment. Second, we outline the installation and operating conditions of this coronagraph at the focus of a cm refractor at the Observatoire de Nice (no central obstruction). We describe the image-selection technique and present preliminary on-sky results obtained on the binary star HD 80 081 (* 38 Lyn). Possible ways to use such an instrument at Dome C (Antarctica) as a testbed instrument are also presented.
2 The achromatic hybrid phase mask coronagraph
Following an earlier development, we decided to merge the two concepts of the achromatic phase knife coronagraph (Abe et al. abe2001a (2001)) and the four-quadrant phase mask coronagraph (Rouan et al. rouan2000 (2000)), in order to simplify the design of the coronagraphic mask.
2.1 Phase mask design
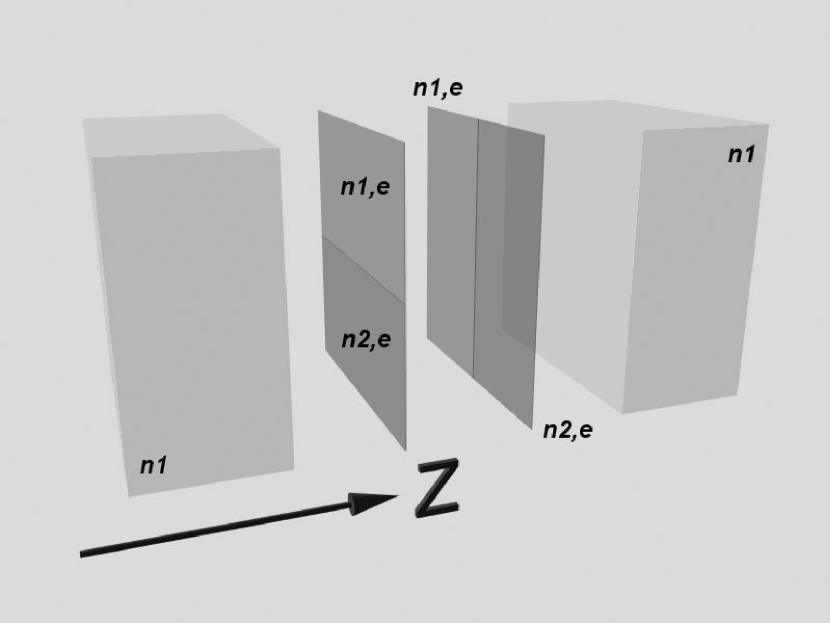
The phase mask is an assembly of phase plates of equal thickness but different optical refraction indices. Instead of using four separate plates, we used a combination of two crossed pairs, each one called a phase knife (Abe et al. abe2001a (2001)). The combination of indices ( and ) and glass thickness ( m) are optimized to obtain a theoretical nulling effect of over a spectral band ranging from nm to nm. The two orthogonal pairs of phase knives are held together between two identical glass blocks (see Fig. 1-a). This optical design solution was chosen to circumvent the difficult operation of shaping and assembling four independent quadrants.
(a)
(b)
Consider a light beam propagating through one phase knife. The light passing through the left part of it will be phase-delayed by the quantity:
| (1) |
and the second half of the wave will be phase-delayed by:
| (2) |
For the sake of manufacturing and assembling simplicity, we impose . Therefore, the relative phase-shift as a function of wavelength is given by:
| (3) |
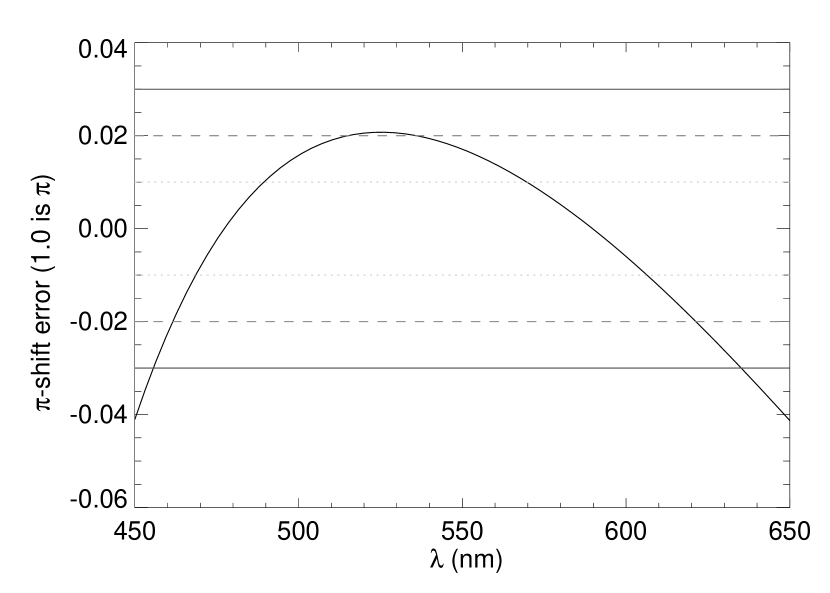
Figure 1-b shows the expected relative phase-shift error as a function of , computed for the chosen glass combination: BaF4 and BaF52. The expected theoretical nulling effect of requires that the differential glass thickness be at most nm ().
2.2 Phase-mask fabrication
The two glass plates were first polished and molecularly bound to one of the polished glass blocks. The glass plates were thick enough to prevent them from breaking while being manipulated. Once bounded, the two plates were thinned to the specified thickness and then polished. As mentioned previously, the differential thickness between the two plates should be less than a few nanometers, which is not guaranteed by the present manufacturer. A similar assembly technique was used for the second half of the coronagraphic mask.
The interface (edge contact) between the two glass plates is not well-defined and could be subject to humidity infiltration. We thus chose to perform a V-shaped bevel at the plates interface and to use an optical contact oil to seal it off once the component is assembled. The two separate blocks were then assembled together using molecular bound. Finally, a UV-glue was used to coat the component, holding the two parts together, ensuring a solid assembly.
3 Laboratory tests
3.1 Laboratory tests of the phase-mask
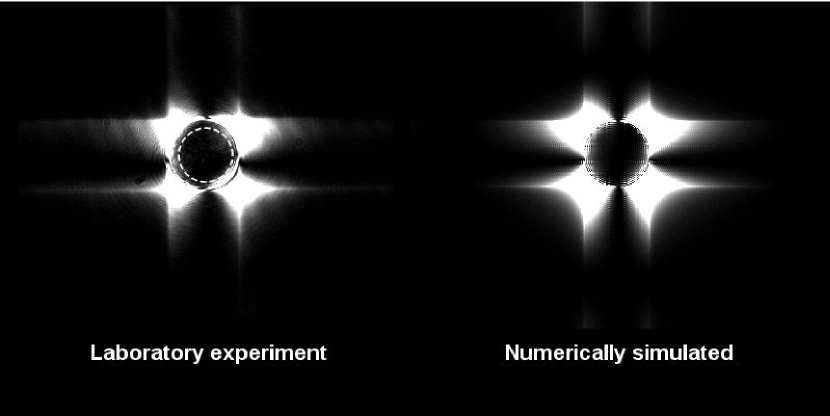
Although the component assembly was largely simplified using the method described above, laboratory tests show that the molecular bound between different glass indices may not be the optimal solution. The left side of Figure 2 shows the coronagraphic pupil image obtained with the prototype. We identified a strong error on the predicted phase-shift for one phase knife, indicating that the molecular bound probably did not hold (e.g. due to temperature fluctuations). This effect might also be due to the polishing of the two glass plates, which was not precise enough (thickness difference). This phase-shift error can be reproduced by a numerical simulation (right side of Figure 2) where we introduced an error of on the phase shift in one direction.
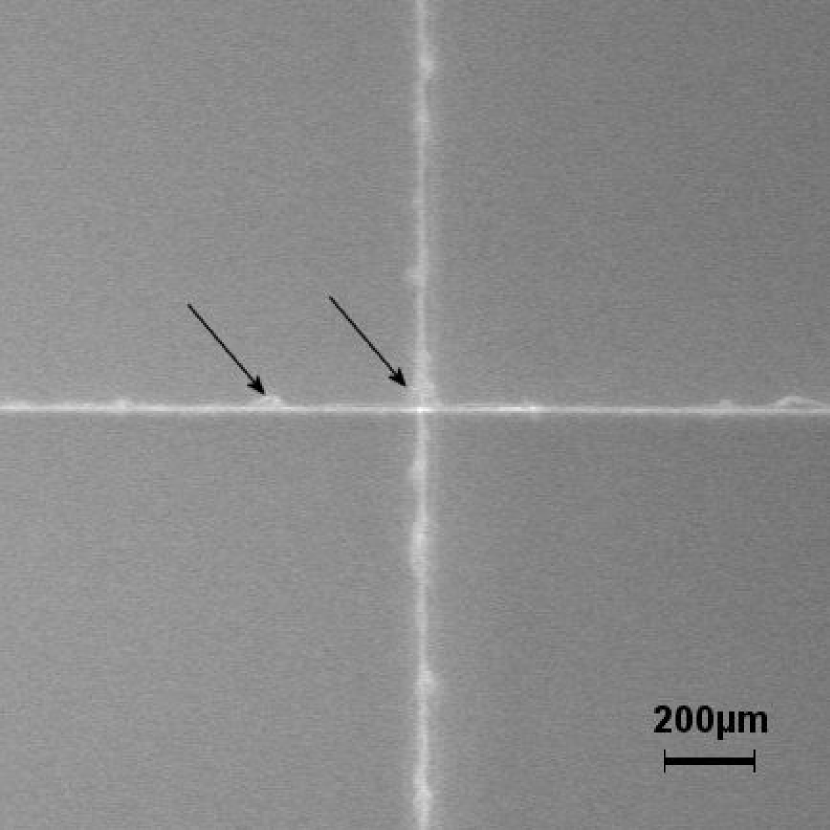
Another shortcoming of the coronagraph is shown in Figure 3. It turns out that the optical sealing oil has created some bubbles that affect the regularity of the interface of the phase-knives edge. It produces unwanted effects, especially at the center (see arrows in Figure 3). The typical size of these irregularities is on the order of a few tens of microns and is comparable to the size of the diffraction pattern. This is probably the main reason the raw performance of the coronagraph is not as good as predicted by the theory. The effect of these undesirable structures after assembling remains unclear, although one can reasonably speculate that their diffraction effect in the coronagraphic pupil is negligible compared to the expected turbulence degradation for on-sky observations.
3.2 Laboratory rejection measurements
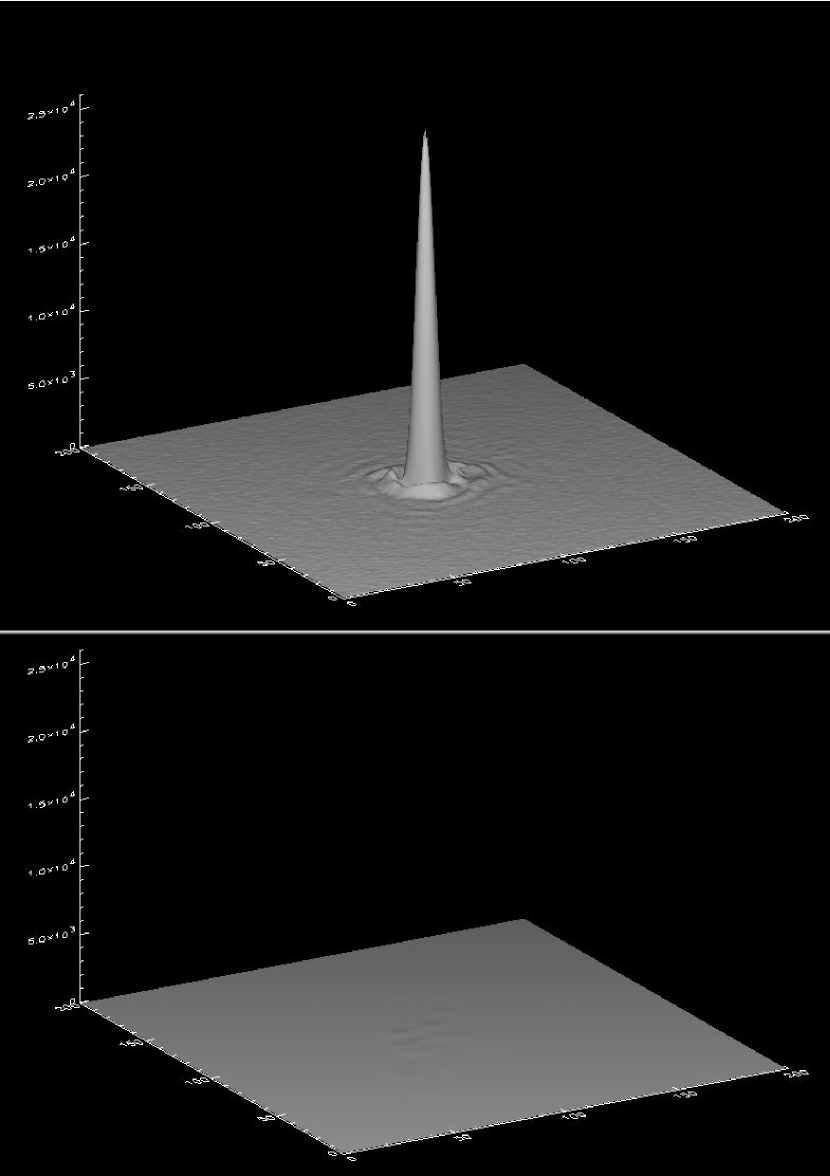
The coronagraphic bench was first qualified in laboratory prior to on-sky tests, under the same optical conditions (defined ratio). The tests were made using an HeNe laser source ( nm). Due to the defect near the center mentioned in Section 3, the nulling effect is less than theoretically expected (a few tens of thousand extinction according to numerical models). The rejection measuring procedure involves calibrated optical densities (Abe et al. abe2003 (2003)) to measure the flux for the source on- and off-axis. This gave a peak-to-peak intensity ratio of (Figure 4) for the nulling performance.
4 Prior to on-sky tests
For on-sky observations, the coronagraph has been installed at the focus of the cm refractor of the Observatoire de Nice, with m (). However, an additional cm aperture diaphragm turned out to be necessary, since we did not have any real-time turbulence correction system such as an adaptive optics system or even a tip-tilt mirror.
The refractor objective lens is an achromatic doublet optimized for the nm wavelength. In our case, the advantage of having no central obstruction had a counterpart: a residual chromatism strong enough to hamper the image focus on the coronagraphic mask. Its effect on the coronagraphic rejection was then evaluated numerically.
4.1 Numerical model for the refractor’s residual chromatism effect
The graphs in Figure 5 are derived from a numerical simulation made with the main characteristics of the refractor. It expresses the extinction performance at each wavelength. The cumulated extinction is also given, while integrating the images over the whole spectral bandwidth. Although the overall broadband extinction ratio performance is far from optimal (up to only ), we carried out a complete on-sky test under these conditions, essentially to match the predicted observing parameters against real observing conditions.

4.2 Optical set-up for on-sky tests
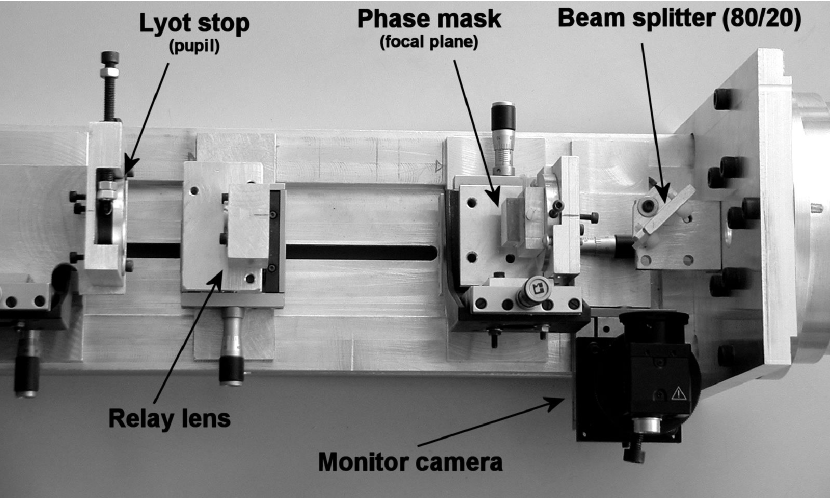
Figure 6 shows the coronagraphic optical bench designed to be fitted to the bonnette of the cm refractor. A beam-splitter reflects of the converging beam coming from the refractor onto a monitoring camera (a SONY XC-EI50 CCD camera with m pixels) The remaining are transmitted through the coronagraph to the science camera (a SONY XC-HR8500CE CCD camera with m square pixels, out of frame in Figure 6). Both cameras deliver standard CCIR video signals. An astigmatism aberration is introduced by this beam-splitter. However, the phase mask is not sensitive to it (Abe abe2002 (2002)) so that the coronagraphic performance should not be degraded. The phase mask component is placed at the focus of the refractor. A relay lens re-images both the primary focal plane (onto the science camera’s detector with a magnification of ) and the pupil plane. At this relayed pupil plane, an iris diaphragm (Lyot stop) with a diameter smaller than the geometric image of the entrance pupil is placed to eliminate the light diffracted out of the geometrical pupil (see Fig. 2).
4.3 Acquisition software
The acquisition software was written in C++ with a graphical user interface (GUI). It drives a dual channel acquisition board that accepts two standard CCIR signals with independent grabbers. The software handles the simultaneous acquisitions from both cameras in real time with a multi-threaded architecture. Several indicators can be optionally toggled in order to facilitate the fine tuning of the experiment. There are two available modes:
-
•
A continuous recording of all the images in RAM memory: in this mode, images from both cameras are recorded and saved in memory, up to a capacity of GB. This mode is useful for dark and flat recordings, or to assess the atmospheric turbulence conditions (image motion for example).
-
•
An automatic image-selection mode: the user sets a threshold that has to be first calibrated (see below). In this mode, memory is saved because only “best” images are kept, so that the exposure length can be greatly optimized. The selection criteria are based on flux considerations during the acquisition, although the post-acquisition image selection was different (which will also be implemented in future experiments).
In both modes, the millisecond timing of all acquired images are recorded in separate text files in order to keep track of image-arrival timing and avoid synchronization errors during image analysis.
Optionally, the software can send external correction commands to the refractor guiding system, in order to keep the star centered on the coronagraph axis. The frequency of correction mainly compensates for slow drifts ( Hz).
5 Observing procedure
Prior to the observations, the optical components were aligned to the bench’s mechanical axis in laboratory, so only minor fine tuning is necessary once it is plugged in to the refractor. The focal mask and the Lyot stop longitudinal positions were tuned before starting observations. The most effective phase mask position is found while monitoring the pupil image. The resulting position is coherent with the focus position estimated using the Foucault method, corrected from the focus shift introduced by the mm glass plate of the phase mask (Figure 1).
5.1 The image-selection process
In this section, we propose an algorithm for image selection to reduce the speckle noise in the coronagraphic image, and thus to improve the signal to noise ratio for a companion detection.
5.1.1 The speckle noise
We call “speckle noise” the random speckle pattern due to distorted and/or tip-tilted wave-fronts. These random structures become a noise source when the exposure time is not long enough to smoothe them in a uniform halo. Unfortunately, the wavefront distortions induced either by atmospheric turbulence and/or by instrumental aberrations do not generally smoothe out, since they may have long time-scale variations (Marois et al. 2003b ). These residual speckles are the major limitations to the identification of the science target signal, especially in the point-like source detection context (companion detection) since speckles have the same size as the diffraction pattern. The removal of such structures can be achieved by differential techniques, but even in this case, residual differential defects might still exist. The latter is discussed in several papers (Racine et al. racine1999 (1999); Marois et al. 2003a ; Marois et al. marois2004 (2004)). Since the speckled halo is partly correlated to the non aberrated diffraction pattern (Bloemhof bloemhof2004 (2004); Aime et al. aime2004 (2004)), its contribution can be diminished by the use of a coronagraph.
In this context, image selection coupled to coronagraphy can be a useful method of increasing the detection limit since the speckle pattern will have a lower intensity due to the coronagraphic attenuation, which is kept under a fixed level (because of selection constraints) and therefore contributes to a lower speckle variance at a given distance from the optical axis (see Racine et al. racine1999 (1999), Eq. 11b).
5.1.2 The image-selection algorithm
The image-selection process involves only the monitoring camera images, instead of relying on flux considerations from the science camera (coronagraphic) image. It works as follows. From each monitoring camera image, we compute the distance from the photometric center111Standard centroid determination algorithms can be applied with a high level of confidence, especially when the stellar companion is faint enough to be invisible on individual snapshots. of the object to a pre-computed operation point (OP). When this distance exceeds a carefully chosen threshold, the corresponding coronagraphic image from the science camera is rejected. The remaining images are co-added to produce the “long-exposure” coronagraphic image.
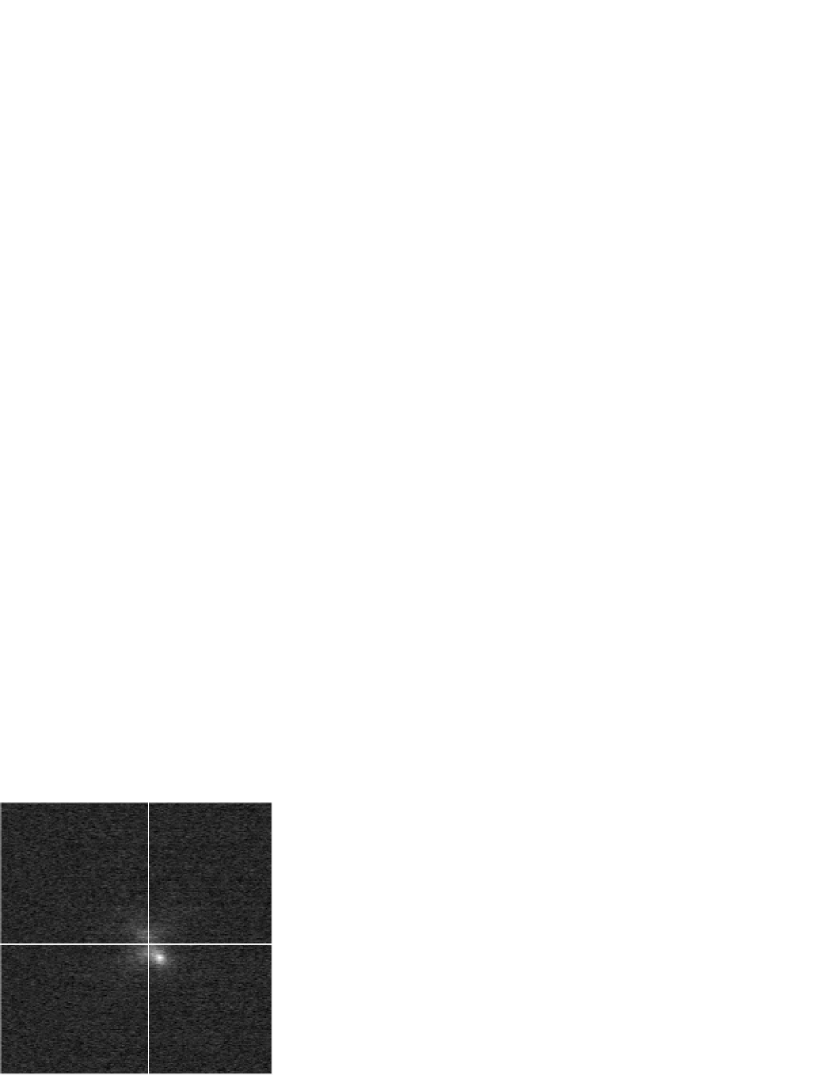
The OP has to be assessed accurately before each observation run by recording frames from both the monitoring and science cameras. First, a “long-exposure” image is obtained by co-adding all the science-camera frames. In the resulting image, the cross pattern of the phase mask is clearly visible, and the optical center of the coronagraphic image can be marked unambiguously.
Since the precise image selection procedure is not performed during the observation itself, the OP on the monitoring camera is set according to its correlation with the images from the science-camera having the highest extinction ratio. For the post-data analysis, a refined determination of this correlation is performed. To further improve the robustness of the proposed method, an internal (stable) calibration source should be used to accurately set the OP and even to allow precise image selection in real-time. In the present work, the determination of the OP position could only be set on a pixel scale basis (with an image selection radius of 0.5 pix at best).
6 Application to observation data
On the nights of observations, the atmospheric conditions could not be considered as optimal. Despite rapid seeing variations, presumably due to fast high-altitude winds, a coherent peak was almost always present in every short exposure. Diffusion from high-altitude clouds was also perceptible, with a noticeable effect (halo) on the stacked images (see below).
6.1 Observation of HD 80 081 (binary star)
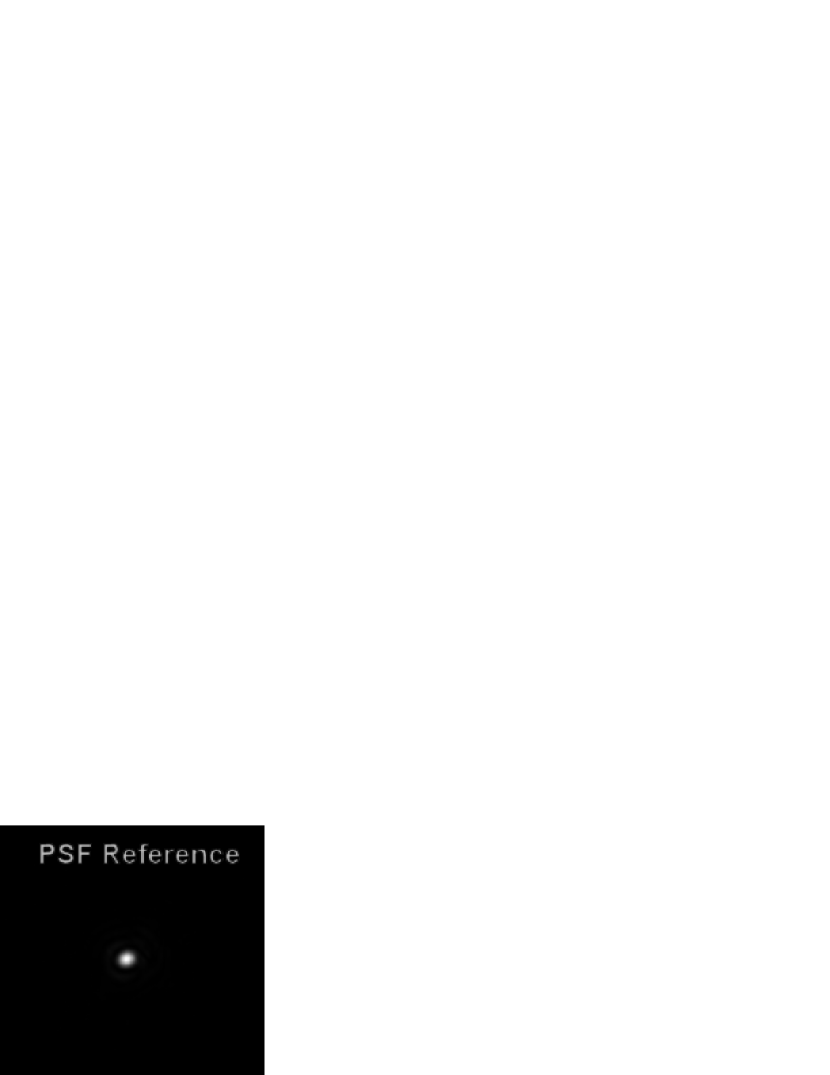
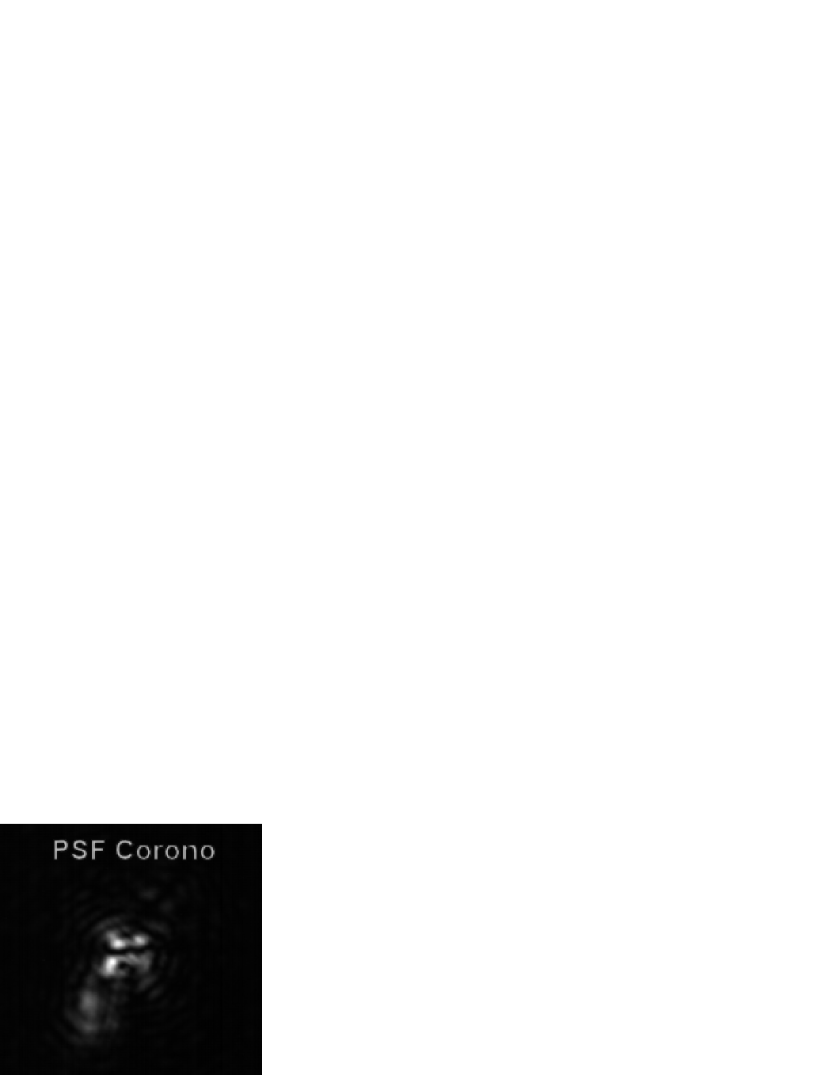
The data under consideration in this article were obtained on March 3, 2004. The target we chose for this test of methodology was HD 80 081, a binary star with a primary magnitude , secondary magnitude (), and separation . The orientation on the sky of the secondary component was known, and the coronagraph was oriented so that it didn’t focus on a “blind area” of the phase mask (i.e. relative to the mask axis). Indeed, investigating the unknown morphology and complexity of a target is hampered by the “blind areas” of the four quadrant phase mask, adding a real difficulty to data analysis. Note that the secondary component was not visible in single science-camera snapshots, due to the read-out noise (S/N less than unity), and was hardly visible with the monitoring camera. As already mentioned, no real-time guiding correction was active on the refractor, so that the image selection post-processing became mandatory. For comparison, Figure 7 shows the monitor camera exposure and the corresponding coronagraphic image. Image generation and analysis are detailed in the following paragraphs.
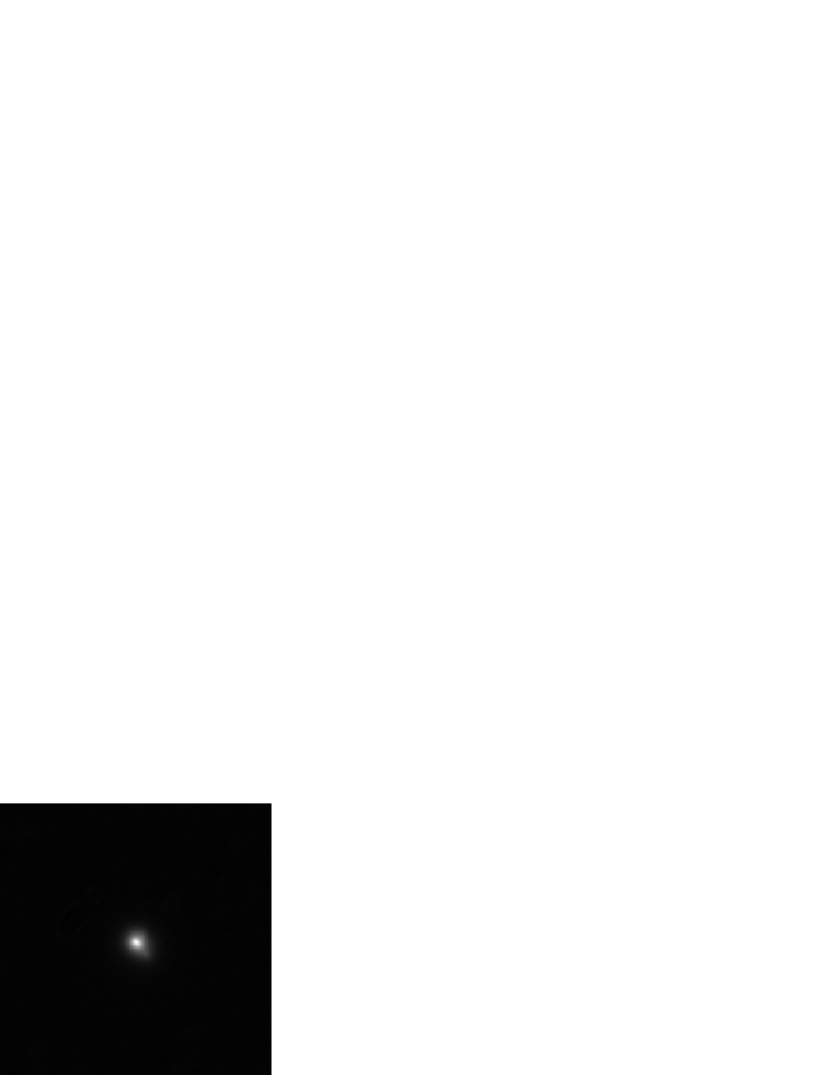
(a)
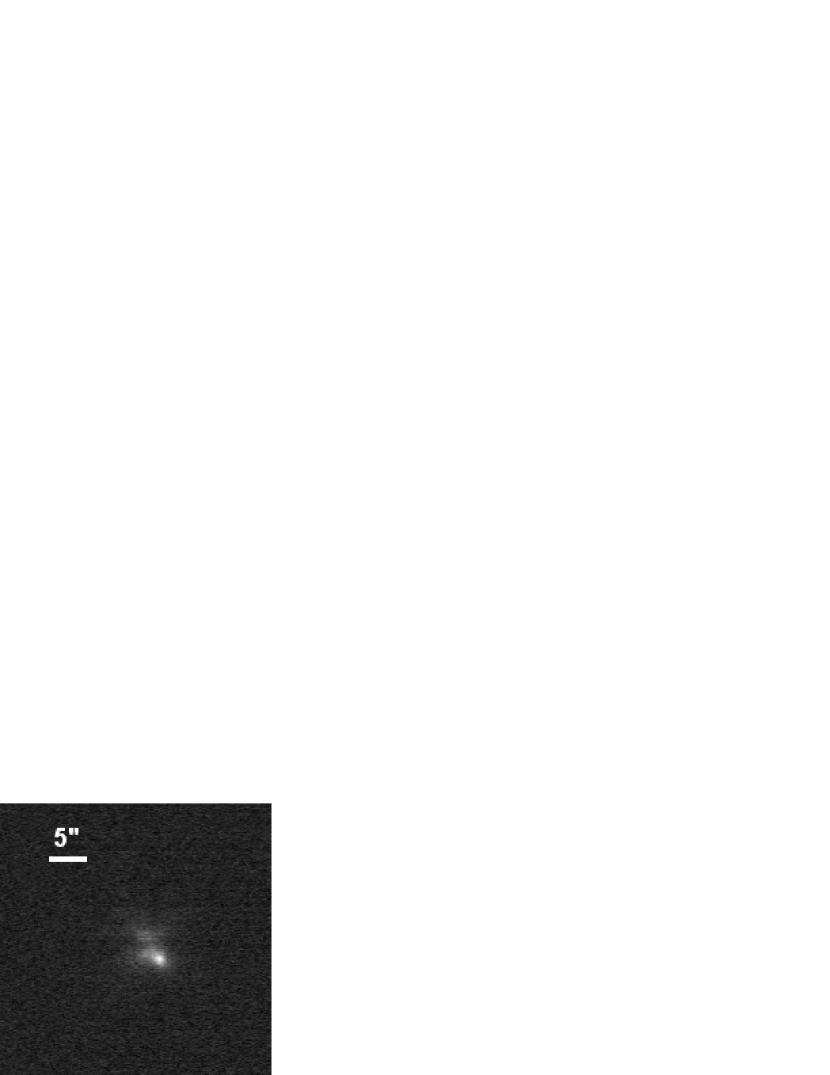
(b)
6.2 Data cube analysis
We performed the image selection procedure described in Sect. 5.1, with increasing values of the distance threshold and thus increasing numbers of retained frames. Figure 9 displays the resulting coronagraphic images.
In order to check the efficiency of the proposed selection method, we compared the peak intensity of the HD 80 081 secondary component with the peak intensity of the brightest residual speckle (Figure 8-b). This ratio of intensity is plotted as a function of the selection threshold in Figure 8-a. This illustrates the gain provided by the selection method which overcomes two effects:
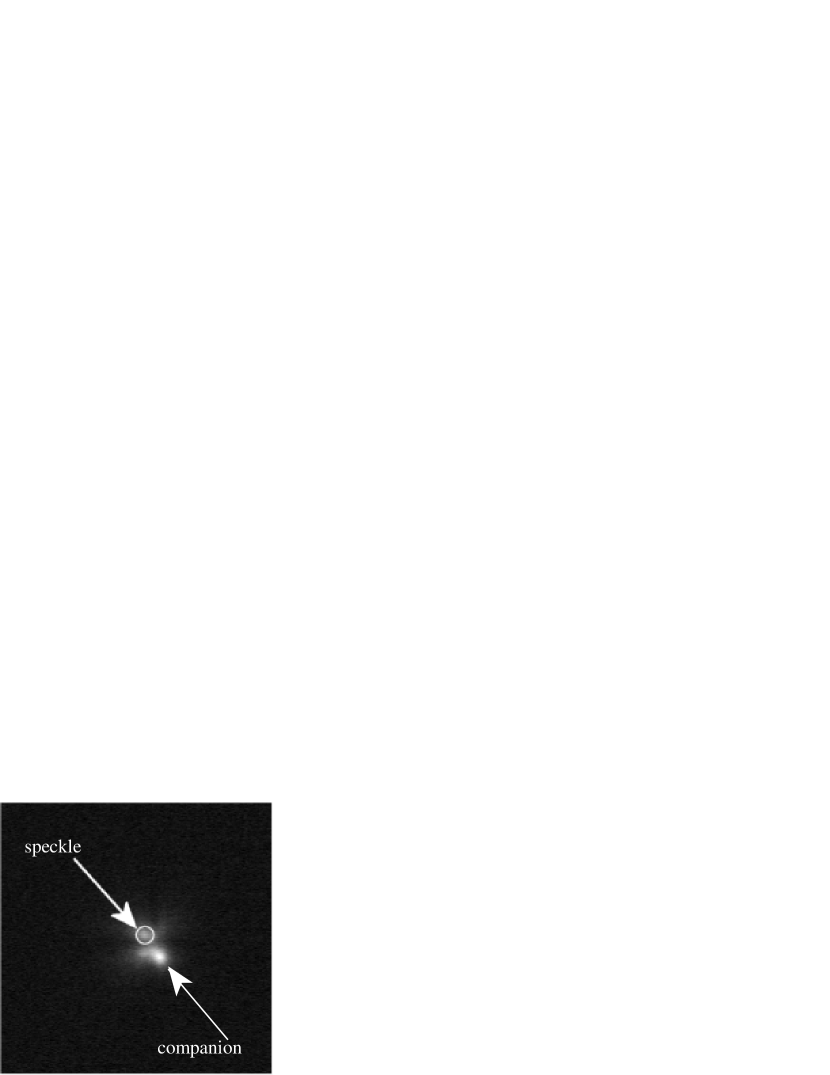
(a)

(b)
-
•
the apparition of bright speckles due to unconstrained tip-tilt jitters that move the primary star’s image out of the coronagraphic rejection zone;
-
•
the flux dilution of the target peak intensity that tends to lower the difference between the target peak and the residual bright speckles mentioned above.
These effects are clearly visible in the Figure 9 images, where in the last long exposure (almost all frames are integrated), the companion of HD 80 081 cannot be disentangled from the coronagraphic image halo with the additional confusion that another bright speckle, symmetric to the HD 80 081 companion position has appeared.
The peak-to-peak intensity ratio between the coronagraphic and direct image was measured to approximately , which is consistent with the numerical estimate mentioned in Sect. 4.1 (see Figure 5).
(a)
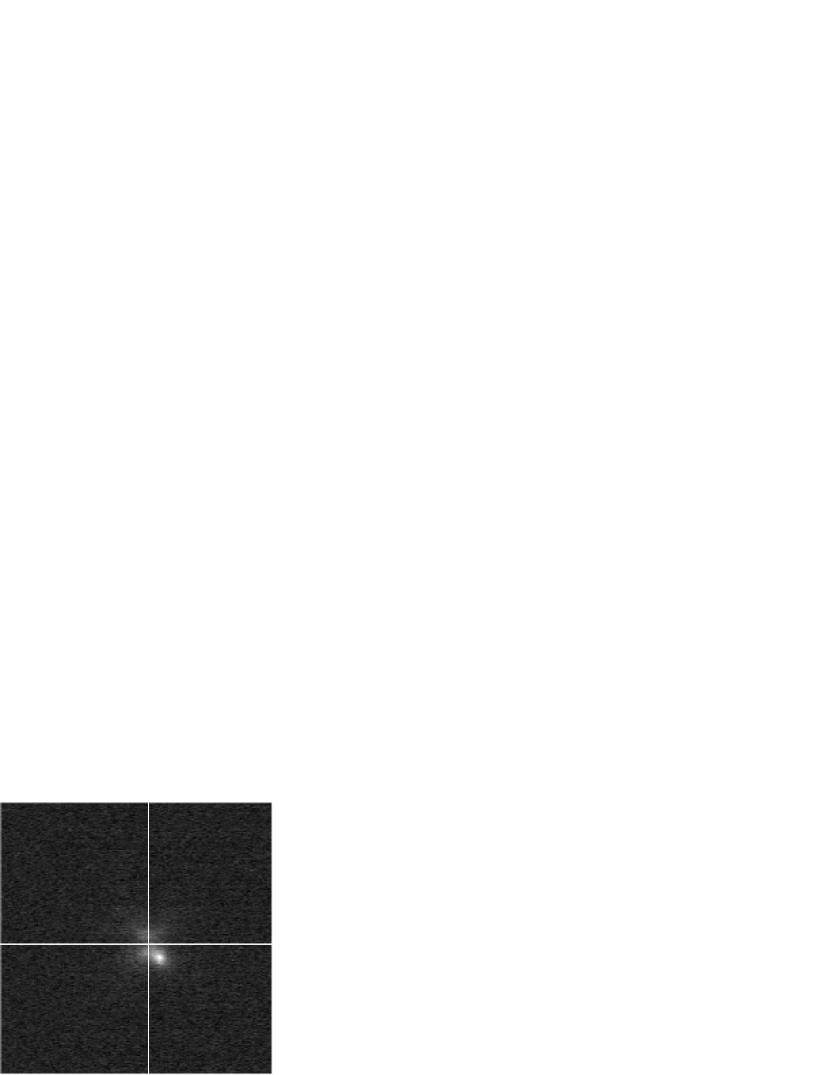
(b)
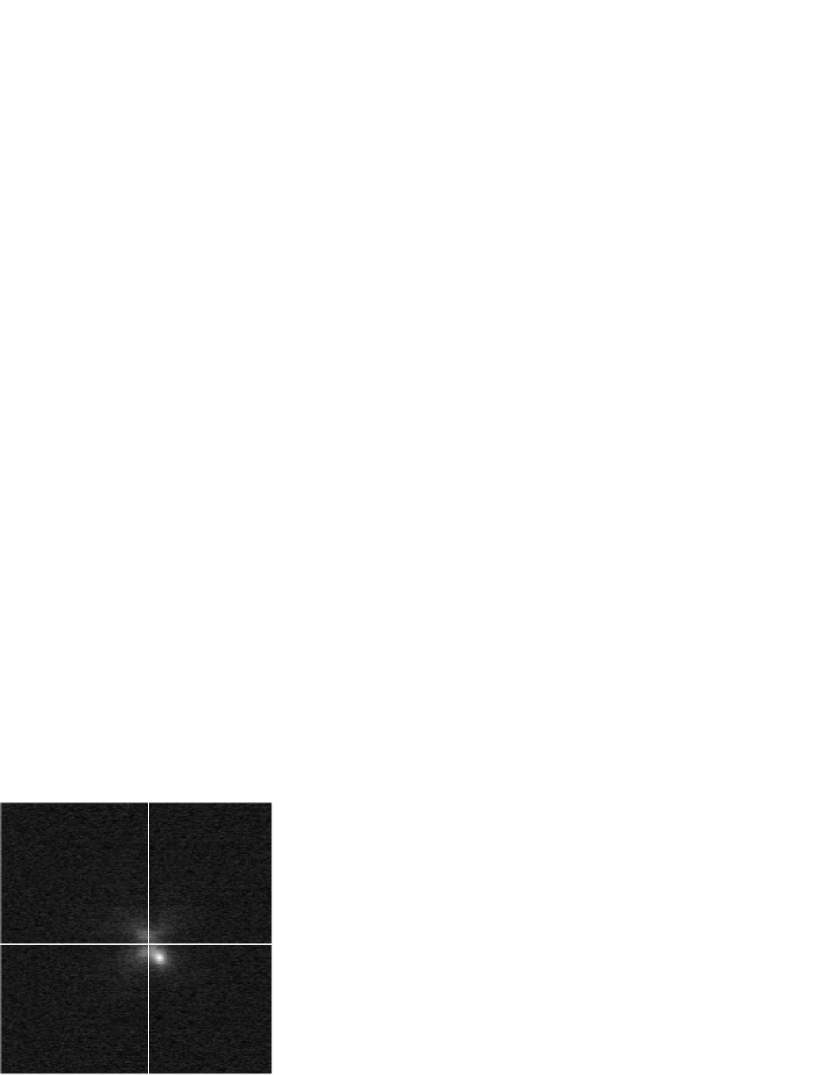
(c)
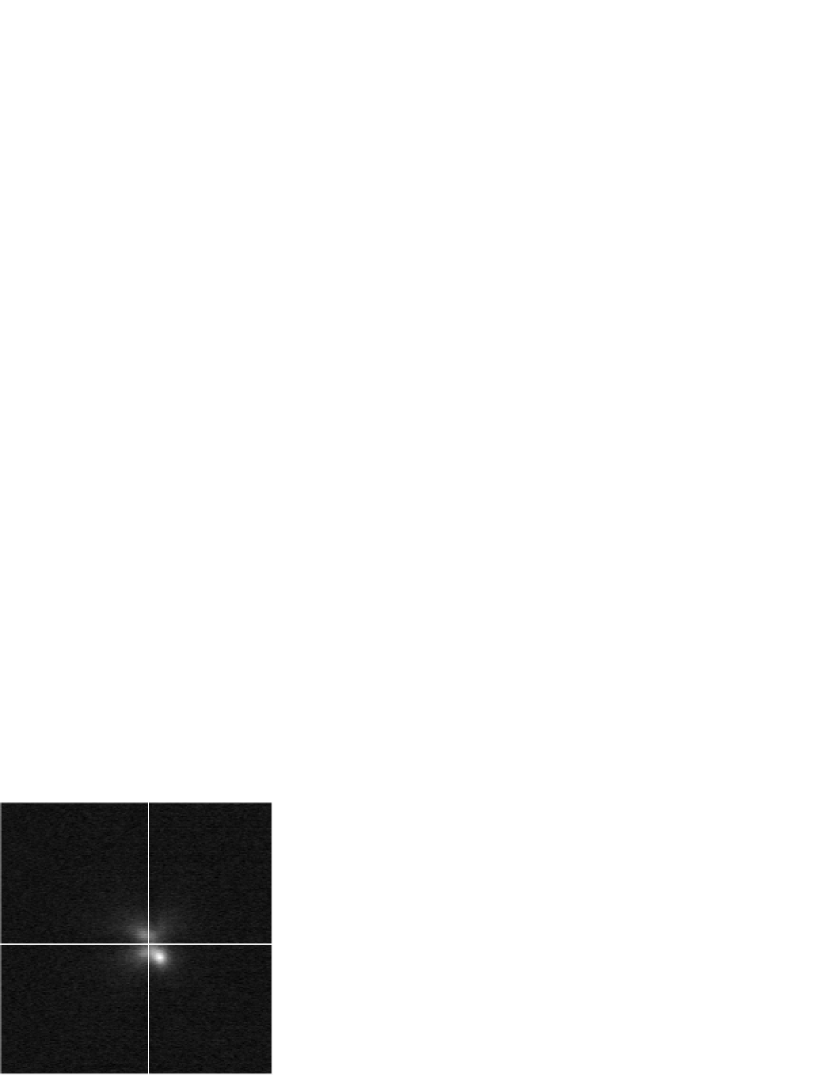
(d)

(e)
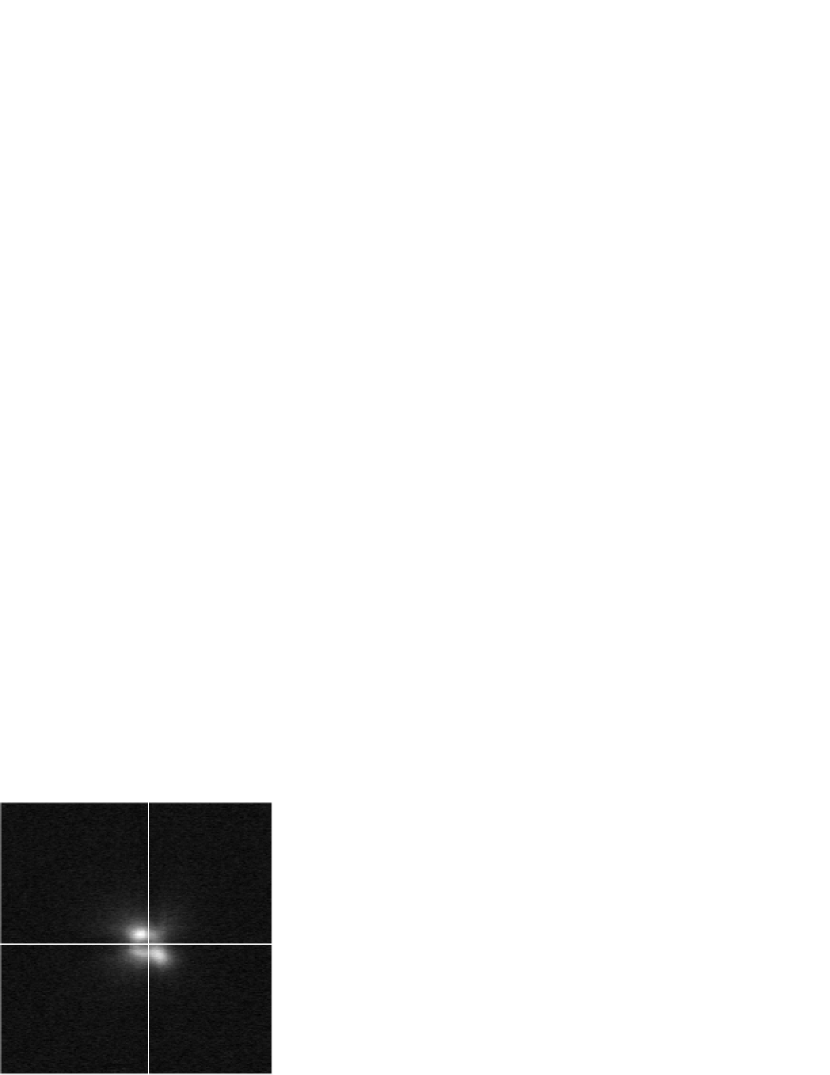
(f)
6.3 Data consistency checks
To complete the data reduction, we also checked the result consistency with the long exposure image. Figure 10 shows several radial profiles for exposure (b) of Figure 9 with selected frames and a selection radius of pixels:
-
•
the radial median profile of the non-coronagraphic monitor image (solid curve);
-
•
the average profile of the the monitor image along the direction of the off-axis companion222we averaged the radial profiles within a small sector containing the secondary component of HD 80 081l. (dash-dotted curve);
-
•
the same with the coronagraphic image (dotted curve);
-
•
the radial median profile of the coronagraphic image (dashed curve);
-
•
the sum of solid and dotted curves (light grey curve), which is consistent with the dash-dotted curve.
This comparison allows us to confidently conclude that our coronagraphic data are consistent and that the bright speckle is the companion of HD 80 081. These results clearly show that the central star PSF halo has been attenuated and that the star is not simply masked by the coronagraphic mask. If there were no coronagraphic effect, then the intensity distribution at the companion location would be similar to the dash-dotted curve. The attenuation factor at the companion location () is , while it reaches closer to the optical axis (), where the theoretical transmission of the four quadrant phase mask is .

7 Conclusion and future prospects
We have presented the first on-sky results of a visible achromatic hybrid phase knife coronagraph. The extinction performances, limited by the refractor’s residual chromatism and thus modest, were found to agree with the numerically predicted value ().
We demonstrated on real data the efficiency of the image selection algorithm we propose in order to increase the signal to noise ratio and ease the detection of faint companions. The selection method provides an efficient way to extract the scientific information by preventing bright speckles from appearing and confusing to the image interpretation.
This encouraging experiment is now envisaged for a test instrument at Dome C (Antarctica). The instrument is expected to benefit from diffraction-limited images while the current image selection system is being implemented. Furthermore, we plan to combine this optical system with a high-speed, high-efficiency photon-counting camera that is under construction at the “Laboratoire Universitaire d’Astrophysique de Nice” (LUAN). We will therefore benefit from quasi-absent readout noise and good temporal sampling of the atmospheric turbulence. The host instrument will be a 14-inch C14 telescope with a modified entrance pupil (Lloyd et al. lloyd2003 (2003)) in order to keep a maximal coronagraphic performance despite the central obscuration (with a lower transmission).
In addition to this gain in transparency, seeing conditions and chromatism reduction (due to the use of a reflector), this new device at Dome C will allow long integration periods during the polar night. This mission is also a test experiment after the success of smaller optical instruments already tested at Dome C for monitoring the seeing (Aristidi et al. aristidi2003 (2003)).
Acknowledgements.
The authors would like to thank Gérard GREISS (SEOP, France) for manufacturing the achromatic phase mask, Alex ROBINI from LUAN who manufactured most of the mechanical parts, and OCA and ASHRA for supporting the experiment. Lyu ABE is grateful to the CNES for its support during his postdoctoral fellowship. This prototyping experiment was supported by a special grant from the scientific council of the Observatoire de la Côte d’Azur.References
- (1) Abe, L. June 2002, PhD thesis, (http://www-astro.unice.fr/abe/, Publications section)
- (2) Abe, L., Boccaletti, A., & Vakili, F. 2001, A&A, 374, 1161
- (3) Abe, L., Domiciano de Souza, A., Vakili, F. & Gay, J. 2003, A&A, 400, 385
- (4) Aime, C., & Soummer, R. 2004, ApJ, 612, L85
- (5) Aime, C., Soummer, R., & Ferrari, A. 2002, A&A, 389, 334
- (6) Aristidi, E., Agabi, K., Vernin, J., et al. 2003, A&A, 406, L19
- (7) Bloemhof, E.E. 2004, ApJ, 610, L69
- (8) Carbillet, M., Fini, L., Femenía, B., et al. 2001, Astronomical Data Analysis Software and Systems X, in ASP Conference Proceedings, vol. 238, 249
- Fini et al. (2001) Fini, L., Carbillet, M., & Riccardi, A. 2001, A&A, 238, 253
- (10) Gay, J., & Rabbia, Y. 1997, C. R. Acad. Sci. Paris, Série II, 332, 265
- (11) Guyon, O. 2003, A&AS, 404, 379
- (12) Kuchner, M.J. & Traub, W. 2002, ApJ, 570, 900
- (13) Lloyd, J. P., Gavel, D. T., Graham, J. R., et al. 2003, in SPIE proceedings, vol. 4860, 171
- (14) Marois, C., Doyon, R., Nadeau, D., et al. 2003, in SPIE proceedings, vol. 4860, 130
- (15) Marois, C., Doyon, R., Nadeau, D., et al. 2003, in EAS Publications Series, vol. 8, 2003, proceedings of the conference Astronomy with High Contrast Imaging, Nice (France), 13-16 May 2002, Eds. C. Aime & R. Soummer, 233.
- (16) Marois, C., Racine, R., Doyon, R., et al. 2004, ApJ, 615, L61
- (17) Mayor, M., & Queloz, D. 1995, Nature, 378, 355
- (18) Racine, R., Walker, G., Nadeau, D., et al. 1999, PASP, 111, 587
- (19) Roddier, F. & Roddier, C. 1997, PASP, 109, 815
- (20) Rouan, D., Riaud, P., Boccaletti, A., et al. 2000, PASP, 112, 1479
- (21) Soummer, R., Aime, C. & Fallon, P. 2003, A&A, 397, 1161
- (22) Spergel, D., & Kasdin, J. 2001, in the proceedings of the 99th AAS Meeting, n86.03, vol. 33, 1431
- (23) Vanderbei, R., Kasdin, J., & Spergel, D. 2004, ApJ, 615, 555