Kinetics of indirect excitons in the optically-induced trap
Abstract
We report on the kinetics of a low-temperature gas of indirect excitons in the optically-induced exciton trap. The excitons in the region of laser excitation are found to rapidly — within 4 ns — cool to the lattice temperature K, while the excitons at the trap center are found to be cold — essentially at the lattice temperature — even during the excitation pulse. The loading time of excitons to the trap center is found to be about 40 ns, longer than the cooling time yet shorter than the lifetime of the indirect excitons. The observed time hierarchy is favorable for creating a dense and cold exciton gas in optically-induced traps and for in situ control of the gas by varying the excitation profile in space and time before the excitons recombine.
pacs:
73.63.Hs, 78.67.De, 05.30.JpThe modern advent of optical and magnetic trapping of atomic gases Chu1998 ; Cohen-Tannoudji1998 ; Phillips1998 ; Ashkin2000 has led to the observation of new states of matter such as Bose-Einstein condensates (BEC) in atomic gases Cornell2002 ; Ketterle2002 and atomic degenerate fermi-gases DeMarco1999 . Optical trapping allowed the creation of a variety of potential reliefs for atoms, including optical lattices Greiner2002 ; Chin2006 , and control of these reliefs in situ. One of the most important characteristics, which is crucial for the observation, probe, and control of these new states, is the trap loading time. Apparently, studies of the degenerate gases in the traps require the fast loading of the gases to the trap, preferably on a timescale less than their lifetime in the trap. For the typical optical traps, the loading times of the degenerate atomic gases are on the order of a few tens of seconds while their lifetimes in the trap are on the order of a few seconds Lewandowski2003 ; Streed2006 .
The system of excitons offers an opportunity to study degenerate Bose-gases in trap potentials in semiconductor materials. Their low mass results in a high temperature of quantum degeneracy for excitons , on the order of 1 K Keldysh1968 . For instance, for excitons in a quantum well K at the exciton density per spin state cm-2. Exciton gases with temperatures well below 1 K and densities higher than cm-2 can be realized in coupled quantum well (CQW) structures Butov2004 . The indirect excitons in CQWs can cool down to these low temperatures due to their long lifetimes and high cooling rates Butov2001 .
Indirect excitons in CQW can be confined by a variety of trapping potentials including strain-induced traps Wolfe1975 ; Trauernicht1983 ; Kash1988 , traps created by laser-induced interdiffusion Brunner1992 , electrostatic traps Zimmermann1997 ; Huber1998 ; Hammack2006a ; Chen2006 , magnetic traps Christianen1998 , and optically-induced traps Hammack2006b . Two of these trap types — the electrostatic and optically-induced traps — show promise of rapid and effective control of the excitons by varying in space and time the gate voltage pattern and the laser intensity pattern, respectively. Control of excitons by varying the electrostatic potential on a time scale much shorter than the exciton lifetime was recently demonstrated Winbow2007 . This indicates the feasibility of studying excitons in controlled electrostatic traps. However, the timescale of exciton control in an optically-induced trap remained unknown before this work.
In this paper, we present the first studies of the spatial and spectral kinetics of excitons in the optically-induced trap. The results demonstrate a rapid loading of the trap by cold excitons on a timescale less than the exciton lifetime and prove the feasibility of accumulating a spatially confined dense and cold exciton gas as well as the rapid in situ control of excitons in the traps.
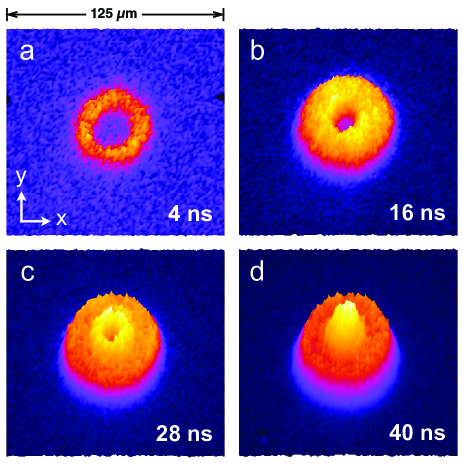
The experimental measurements were performed using time-resolved imaging with 4 ns time-resolution and 2 m spatial resolution. The excitons were photogenerated using rectangular laser excitation pulses emitted by a pulsed semiconductor laser diode at 635 nm. The pulse duration was 500 ns, the edge sharpness ns, and the repetition frequency 1 MHz. The period and duty cycle were chosen to provide ample time for the exciton gas to reach equilibrium during the laser pulse and to allow complete decay of the indirect exciton photoluminescence (PL) between the pulses. The pulses were patterned into a laser excitation ring with a diameter of 30 m and a ring thickness following a Gaussian profile of FWHM m using a shadow mask. This ring-shaped laser excitation created the in-plane spatial confinement of cold indirect excitons by exploiting their mean-field repulsive interaction, which forms the trapping profile Hammack2006b . Time-dependent spatial – and spectral – PL images were acquired by a nitrogen-cooled CCD camera after passing through a time-gated PicoStar HR TauTec intensifier with a time-integration window of 4 ns. For – imaging, an interference filter, chosen to match the indirect exciton energy exclusively, is placed in the optical path before the time-gated intensifier. In this manner, both the high intensity low-energy bulk emission and direct exciton emission are removed. The spectral filtering and time-gated imaging combine to allow the direct visualization of the intensity profile of the indirect exciton emission in spatial coordinates as a function of delay time (see Fig. 1a-d). The time dependent measurements of the indirect exciton spectra were acquired by placing the time-gated intensifier and CCD after a single grating spectrometer.
The CQW structure used in these experiments was grown by molecular beam epitaxy and contains two nm GaAs QWs separated by a nm Al0.33Ga0.67As barrier (details on the CQW structures can be found in Butov2004 ). Indirect excitons in the CQW structure are formed from electrons and holes confined to different QWs. Separation between the electron and hole layers in the CQW structure causes the optical lifetime of the indirect excitons to exceed that of regular direct excitons by orders of magnitude and is ns at V for the studied CQW sample. The exciton density profile was estimated from the measured exciton energy profiles in – coordinates using the relation between the energy and density of the indirect excitons , where Yoshioka1990 ; Zhu1995 ; Ben-Tabou2001 ; Ivanov2002 . For the studied CQW sample and nm Butov2004 .
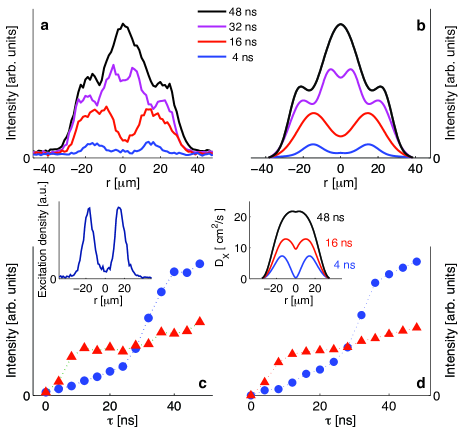
The kinetics presented in Fig. 2c-d demonstrate that the exciton pattern reaches a stationary state and, therefore, the trap loading is completed within about 40 ns. Thus the trap loading time is about the lifetime of indirect excitons in this CQW sample (see Fig. 3c). Note that in another CQW sample with a larger separation between the electron and hole layers the lifetime of indirect excitons reaches several microseconds Winbow2007 , which is much larger than the trap loading time reported here. However, trap loading on a time scale comparable to the lifetime in the trap is already favorable for studies of confined degenerate gases Lewandowski2003 ; Streed2006 .
Furthermore, for the excitation power used in the experiments, the density of excitons at the trap center reaches cm-2 within 40 ns. As shown below, the exciton gas is cold, essentially at the lattice temperature, within the area m2 around the trap center. Therefore, cold excitons are loaded to the trap over the course of 40 ns. The corresponding collection rate of cold excitons to the optically-induced exciton trap exceeds excitons/second.
In order to model the experimental data we use the coupled drift-diffusion and thermalization equations for the exciton effective temperature and density :
| (1) | |||||
| (2) |
where , , and are the diffusion coefficient, mobility, optical lifetime and generation rate of indirect excitons, respectively Ivanov2002 ; Ivanov2006 . The term describes cooling of indirect excitons due to their coupling with bulk LA-phonons Ivanov1999 , and the terms and refer to heating of indirect excitons by the laser field and recombination heating or cooling of the particles, as detailed in Ref. Ivanov2006 . The stationary solution of these equations for laser induced traps is discussed in Ref. Ivanov2006 . In the present work, Eqs. (1)-(2) are analyzed to model the trapping kinetics, i.e., in the space and time domain.
The effective -dependent screening of the disorder potential by dipole-dipole interacting indirect excitons is crucial for the drastic decrease of the time needed to fill up the optically-induced trap with indirect excitons. The thermionic model, derived from Eq. (1) for a long-range correlated disorder potential, yields the effective diffusion coefficient:
| (3) |
where and is the in-plane diffusion coefficient in the absence of CQW disorder Ivanov2002 .
By using Eq. (3), the time required for an indirect exciton to travel from the boundary of an annular trap of radius to its center is estimated as
| (4) | |||||
| (5) |
where is the density of photoexcited indirect excitons at the boundary of the trap, and the first, low-density limit ( cm-2) refers to the unscreened disorder potential, while the second, high-density limit ( cm-2) deals with effective mean-field screening of . In the low-density limit, the excitons are essentially localized by disorder, the diffusion coefficient is small, cm2/s, and the in-plane transport of excitons out of the excitation spot cannot be seen because in this case . In contrast, for the diffusion coefficient is large, cm2/s, giving rise to the drastic decrease of the characteristic travel time : According to Eqs. (4)-(5), with the dimensionless smallness parameter (for K, meV, and cm-2). The transition from localized to delocalized indirect excitons is indeed observed with increasing density Butov2002 ; Ivanov2006 ; Hammack2006b .
The calculated change of the exciton diffusion coefficient, due to screening of CQW disorder, is shown in the right inset of Fig. 2. A drastic increase of with increasing is consistent with the above estimates. For our experiments, evaluations with Eq. (5) yield ns against ns, i.e., the condition is clearly met.
The numerical simulations were done by using control parameters consistent with those found in our previous studies Butov2001 ; Hammack2006b of similar structures: meVcm2, meV, cm2/s, ( is the free electron mass), eV, and the deformation potential of exciton – LA-phonon interaction eV. As can be seen in Figs. 2 and 3, the measured and calculated kinetics of the exciton spatial patterns are in quantitative agreement.
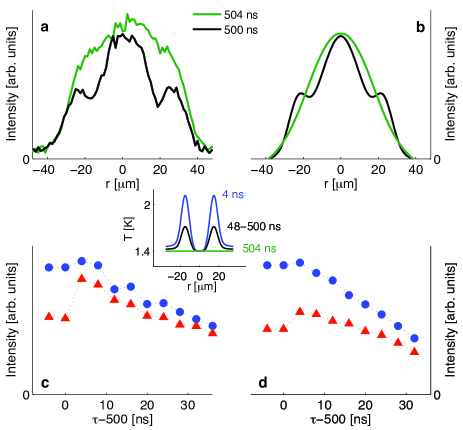
When the laser pulse is switched off, a jump in the exciton PL is observed in the region of laser excitation (Fig. 3). As shown in the previous studies Feldmann1987 , only low-energy excitons with the kinetic energy from the radiative zone, , are optically active. The PL-jump is caused by the increase of the radiative zone population, due to the cooling of high-energy optically-dark excitons after abruptly switching off the laser excitation Butov2001 . The time-resolved imaging experiments show that the PL-jump is observed only in the region of laser excitation, where indirect excitons are effectively heated by the laser field. In this region, after switching off the laser excitation (Fig. 3), the excitons rapidly cool down to the lattice temperature K within 4 ns, the time resolution of the current experiments. The calculated cooling (i.e. thermalization) time is . Both the experiment and calculations show that the exciton cooling time to the lattice temperature is much shorter than the exciton lifetime ns.
More importantly, the data show no PL-jump at the trap center (Fig. 3). This proves that the excitons at the trap center are cold, essentially at the lattice temperature , even in the presence of the excitation pulse. The numerical simulations of the exciton temperature profile, , plotted in the inset of Fig. 3 for various time delays, are consistent with this observation. The hierarchy of times, , results in complete thermalization of indirect excitons during their travel from the boundary of the optically-induced trap to its center, where heating from the laser excitation is negligible.
In conclusion, we have found that the characteristic loading time of an optically-induced trap with cold excitons is on the scale of tens nanoseconds. The observed hierarchy of times (exciton cooling timetrap loading timeexciton lifetime in the trap) is favorable for creating a dense and cold exciton gas in the optically-induced traps and its in situ control by varying the excitation profile in space and time before the exciton recombination.
This work is supported by ARO grant W911NF-05-1-0527 and NSF grant DMR-0606543.
References
- (1) S. Chu, Rev. Mod. Phys. 70, 685 (1998).
- (2) C. N. Cohen-Tannoudji, Rev. Mod. Phys. 70, 707 (1998).
- (3) W. D. Phillips, Rev. Mod. Phys. 70, 721 (1998).
- (4) A. Ashkin, IEEE Journal on Selected Items in Quantum Electronics 6, 841 (2000).
- (5) E. A. Cornell, C. E. Wieman, Rev. Mod. Phys. 74, 875 (2002).
- (6) W. Ketterle, Rev. Mod. Phys. 74, 1131 (2002).
- (7) B. DeMarco, D. S. Jin, Science 285, 1703 (1999).
- (8) M. Greiner, O. Mandel, T. Esslinger, T. W. Hänsch, and I. Bloch, Nature 415, 39 (2002).
- (9) J. K. Chin, D. E. Miller, Y. Liu, C. Stan, W. Setiawan, C. Sanner, K. Xu, and W. Ketterle, Nature 443, 961 (2006).
- (10) H. J. Lewandowski, D. M. Harber, D. L. Whitaker, and E. A. Cornell, J. Low Temp. Phys. 132, 309 (2003).
- (11) E. W. Streed, A. P. Chikkatur, T. L. Gustavson, M. Boyd, T. Torii, D. Schneble, G. K. Campbell, D. E. Pritchard, and W. Ketterle, Rev. of Sci. Inst. 77, 023106 (2006).
- (12) L. V. Keldysh and A. N. Kozlov, Zh. Eksp. Teor. Fiz. 54, 978 (1968) [Sov. Phys. JETP 27, 521 (1968)].
- (13) L. V. Butov, J. Phys.: Condens. Matter 16, R1577 (2004).
- (14) L. V. Butov, A. L. Ivanov, A. Imamoglu, P. B. Littlewood, A. A. Shashkin, V. T. Dolgopolov, K. L. Campman, and A. C. Gossard, Phys. Rev. Lett. 86, 5608 (2001).
- (15) J. P. Wolfe, W. L. Hansen, E. E. Haller, R. S. Markiewicz, C. Kittel, and C. D. Jeffries, Phys. Rev. Lett. 34, 1292 (1975).
- (16) D. P. Trauernicht, A. Mysyrowicz, and J. P. Wolfe, Phys. Rev. B 28, 3590 (1983).
- (17) K. Kash, J. M. Worlock, M. D. Sturge, P. Grabbe, J. P. Harbison, A. Scherer, and P. S. D. Lin, Appl. Phys. Lett. 53, 782 (1988).
- (18) K. Brunner, U. Bockelmann, G. Abstreiter, M. Walther, G. Böhm, G. Tränkle, and G. Weimann, Phys. Rev. Lett. 69, 3216 (1992).
- (19) S. Zimmermann, A. O. Govorov, W. Hansen, J. P. Kotthaus, M. Bichler, and W. Wegscheider, Phys. Rev. B 56, 13414 (1997).
- (20) T. Huber, A. Zrenner, W. Wegscheider, and M. Bichler, Phys. Stat. Sol. (a) 166, R5 (1998).
- (21) A. T. Hammack, N. A. Gippius, Sen Yang, G. O. Andreev, L. V. Butov, M. Hanson, A. C. Gossard, J. Appl. Phys. 99, 066104 (2006).
- (22) G. Chen, R. Rapaport, L. N. Pffeifer, K. West, P. M. Platzman, S. Simon, Z. Vörös, D. Snoke, Phys. Rev. B 74, 045309 (2006).
- (23) P. C. M. Christianen, F. Piazza, J. G. S. Lok, J. C. Maan, and W. van der Vleuten, Physica B 249, 624 (1998).
- (24) A. T. Hammack, M. Griswold, L. V. Butov, L. E. Smallwood, A. L. Ivanov, A. C. Gossard, Phys. Rev. Lett. 96, 227402 (2006).
- (25) A. G. Winbow, A. T. Hammack, L. V. Butov, A. C. Gossard, Nano Letters 7, 1349 (2007).
- (26) D. Yoshioka, A. H. MacDonald, J. Phys. Soc. Jpn. 59, 4211 (1990).
- (27) X. Zhu, P. B. Littlewood, M. Hybertsen, T. Rice, Phys. Rev. Lett. 74, 1633 (1995).
- (28) S. Ben-Tabou de-Leon, B. Laikhtman, Phys. Rev. B 63, 125306 (2001).
- (29) A. L. Ivanov, Europhys. Lett. 59, 586 (2002).
- (30) A. L. Ivanov, L. E. Smallwood, A. T. Hammack, Sen Yang, L. V. Butov, and A. C. Gossard, Europhys. Lett. 73, 920 (2006).
- (31) A. L. Ivanov, P. B. Littlewood, and H. Haug, Phys. Rev. B 59, 5032 (1999).
- (32) L. V. Butov, A. C. Gossard, and D. S. Chemla, Nature 418, 751 (2002).
- (33) J. Feldmann, G. Peter, E. O. Gobel, P. Dawson, K. Moore, C. Foxon, R. J. Elliott, Phys. Rev. Lett. 59, 2337 (1987).