Structure of AlSb(001) and GaSb(001) Surfaces Under Extreme Sb-rich Conditions
Abstract
We use density-functional theory to study the structure of AlSb(001) and GaSb(001) surfaces. Based on a variety of reconstruction models, we construct surface stability diagrams for AlSb and GaSb under different growth conditions. For AlSb(001), the predictions are in excellent agreement with experimentally observed reconstructions. For GaSb(001), we show that previously proposed model accounts for the experimentally observed reconstructions under Ga-rich growth conditions, but fails to explain the experimental observations under Sb-rich conditions. We propose a new model that has a substantially lower surface energy than all (5)-like reconstructions proposed previously and that, in addition, leads to a simulated STM image in better agreement with experiment than existing models. However, this new model has higher surface energy than some of (43)-like reconstructions, models with periodicity that has not been observed. Hence we conclude that the experimentally observed (15) and (25) structures on GaSb(001) are kinetically limited rather than at the ground state.
pacs:
68.35.Bs, 68.35.Md, 68.37.Ef, 68.47.FgI Introduction
The surfaces and interfaces of III-V semiconductors constitute some of the most important components of the semiconductor industry. For example, III-V heterostructure quantum wells are key components in a wide range of optical and high-frequency electronic devices, including field-effect transistors J.B. Boos et al. (1998), resonant tunneling structures J.S. Scott et al. (1994), infrared lasers M. J. Yang et al. (1998), and infrared detectors F. Fuchs et al. (1997). Many of these devices require extremely sharp and clean interfaces. For this reason, an understanding of the atomic-scale morphology of III-V semiconductor surfaces is critical to controlling the growth and formation of their interfaces Gerhard Klimeck et al. (1998); D. Z.-Y. Ting and T. C. McGill (1996).
It is generally accepted that the surfaces of III-V semiconductors should reconstruct in such a way that the number of electrons is exactly enough to doubly occupy all orbitals on electronegative (V) atoms, leaving all orbitals on electropositive (III) atoms unoccupied. This guiding principle, known as the electron-counting model (ECM), has been used to screen candidate structural models of many observed reconstructions on the surfaces of III-V semiconductors D. J. Chadi (1987); M. D. Pashley (1989); John E. Northrup and Sverre Froyen (1994); S. B. Zhang and Alex Zunger (1996); C. D. MacPherson et al. (1996). In practice, however, not all experimentally realized reconstructions follow this principle. For example, under Sb-rich growth conditions, GaSb(001) forms surface reconstructions that are weakly metallic and hence violate the ECM L. J. Whitman et al. (1997), even though the closely related AlSb(001) surface forms insulating reconstructions that satisfy it W. Barvosa-Carter et al. (2000). The nature of reconstructions that violate the ECM, and the underlying reasons for their stability, are thus important for understanding III-V surfaces in general.
In this article we explore theoretically a large number of judiciously chosen candidate reconstructions on GaSb(001) and AlSb(001). We find that as the growth conditions are varied between Sb-poor and Sb-rich, the predicted sequence of stable reconstructions for GaSb(001) is exactly analogous to those of AlSb(001). Experimentally, however, the picture is more complicated. In the Sb-poor limit, the observed GaSb(001) reconstruction is indeed analogous to that of AlSb(001). On the other hand, in the Sb-rich limit, the experimentally observed reconstructions for GaSb(001) and AlSb(001) are different. Moreover, in this limit the predicted and observed reconstructions are in good agreement only for AlSb(001), while for GaSb(001) there remains an unresolved discrepancy between theory and experiment.
Experimentally, the Sb-terminated AlSb(001) surface evolves through the sequence (43) (43) (43) c(44) as the growth condition is changed from low Sb flux (or high substrate temperature) to high Sb flux (or low temperature) W. Barvosa-Carter et al. (2000). All of these reconstructions are insulating, and are well accounted for by structural models proposed in the literature that satisfy the ECM.
Of particular interest here is the Sb-rich AlSb(001)-(44) reconstruction, analogous to the As-rich GaAs(001)-(44) reconstruction, which is observed on AlSb but not GaSb. In contrast to both AlSb and GaAs, the GaSb(001) surface does not exhibit a stable, insulating (44) reconstruction under similar—or any other—growth conditions. Instead, it forms (5)-like reconstructions M. T. Sieger et al. (1995); J. Piao et al. (1990); Mitsuaki Yano et al. (1991); G. E. Franklin et al. (1990); L. J. Whitman et al. (1997). Structural models proposed in the literature for these (5)-like reconstructions violate, by design, the ECM and consequently are weakly metallic L. J. Whitman et al. (1997). Simulated scanning tunneling microscopy (STM) images based on (210) and (210) models closely resemble the experimental images L. J. Whitman et al. (1997). As a result, these models have been generally accepted as describing the GaSb(001) surface under Sb-rich growth conditions. Nevertheless, we show below on energetic grounds that these models are unlikely to be correct. Specifically, we find their calculated surface energy to be significantly higher than GaSb(001)-(44) for any plausible value of Sb chemical potential. However, since the experimentally observed reconstruction of GaSb(001) does not have (44) periodicity, this model cannot be correct either. Thus a definitive structural model remains to be found.
II Methods
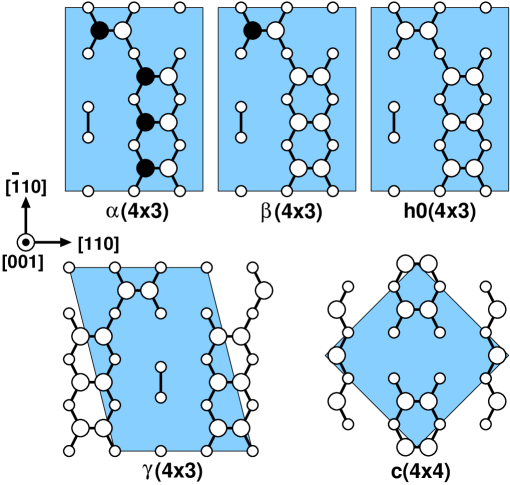
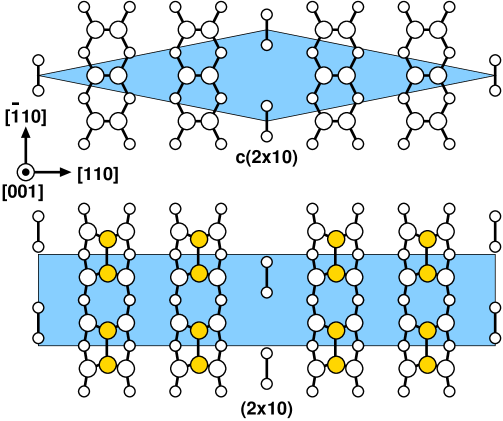
The basic structural models we considered are taken from the literature and are shown in Figs. 1 and 2. Surfaces that satisfy the ECM are generally semiconducting, while those that do not may be metallic. The degree to which a given surface satisfies the ECM can be measured by the excess electron count, , which we define here as the difference between the number of available electrons and the number required to satisfy the ECM, per (11) surface unit cell. Excess electron counts for the structural models in Figs. 1 and 2 are tabulated in Table 1.
To compare the surface energies of reconstruction models with different periodicities and stoichiometries, we consider the surface energy per unit area,
| (1) |
where is the total energy of a reconstructed surface, of area , containing group-III and group-V adatoms in excess with respect to the bulk-truncated, Sb-terminated AlSb(001) or GaSb(001). The atomic chemical potentials are more conveniently expressed in terms of excess chemical potentials , relative to the energy per atom in the ground-state elemental phases: . Assuming the surface to be in thermodynamic equilibrium with the bulk, the III and V chemical potentials are related by + = , where is the formation enthalpy of the bulk III-V crystalline phase Guo-Xin Qian et al. (1988) (note that is intrinsically negative). Eq. (1) can then be rewritten to show more clearly the dependence of on the surface stoichiometry and chemical potential:
| (2) |
Here is independent of the chemical potentials, and is the deviation of the surface stoichiometry from its bulk value. The dependence of on chemical potential is given entirely by the second term. Note that is intrinsically negative, and can take values in the range . Hence, Eq. (2) reflects in a simple way that III-rich reconstructions () are favored under III-rich conditions (), V-rich reconstructions () are favored under V-rich conditions (), and for stoichiometric reconstructions () does not depend on chemical potential.
To compute the total-energy contribution, , to the surface energy we performed first-principles calculations using density-functional theory (DFT). The calculations were performed within the local-density approximation (LDA) D. M. Ceperley and B. J. Alder (1980); J. P. Perdew and A. Zunger (1981) using ultrasoft pseudopotentials Vanderbilt (1990); Kresse and Hafner (1994); Kresse and Furthmüller (1996). We used a standard supercell technique, modeling the (001) surface with a slab consisting of four bilayers and 10 Å of vacuum. Atoms in the bottom bilayer were fixed at their bulk positions, while all other atoms are allowed to relax until the rms force was less than 0.005 eV/Å. The bottom layer (either Ga or Al) was passivated with pseudohydrogens. A plane-wave cutoff of 300 eV was used, and reciprocal space was sampled with a density equivalent to at least 192 -points in the (11) surface Brillouin zone. To define the III-V formation enthalpy from the bulk chemical potentials , separate DFT calculations were performed for the elements in their ground-state phases: Ga in the -Ga structure, Al in the face-centered cubic structure, Sb in the rhombohedral structure, and both AlSb and GaSb in the zinc blende structure.
III Results and Discussions
| Structure | (Ga-rich) | (Sb-rich) | |||||||||
|---|---|---|---|---|---|---|---|---|---|---|---|
| (43) | 12 | 4 | 4 | 0.333 | 0.333 | 0.0 | 62 | 62 | 0 | 0.000 | 0.000 |
| (43) | 12 | 1 | 7 | 0.083 | 0.583 | -0.5 | 68 | 68 | 0 | 0.076 | -0.074 |
| (43) | 12 | 0 | 8 | 0.0 | 0.667 | -0.667 | 70 | 70 | 0 | 0.114 | -0.087 |
| (43) | 12 | 0 | 8 | 0.0 | 0.667 | -0.667 | 70 | 70 | 0 | 0.118 | -0.083 |
| (44) | 8 | 0 | 6 | 0.0 | 0.750 | -0.750 | 50 | 50 | 0 | 0.142 | -0.084 |
| (210) | 10 | 0 | 8 | 0.0 | 0.800 | -0.800 | 65 | 62 | 0.3 | 0.255 | 0.014 |
| (210) | 20 | 0 | 24 | 0.0 | 1.200 | -1.200 | 170 | 164 | 0.3 | 0.528 | 0.166 |
| s1a-(210) | 10 | 1 | 7 | 0.1 | 0.700 | -0.600 | 63 | 62 | 0.1 | 0.143 | -0.038 |
| s1b-(210) | 10 | 1 | 7 | 0.1 | 0.700 | -0.600 | 63 | 62 | 0.1 | 0.181 | 0.000 |
| s1c-(210) | 10 | 1 | 7 | 0.1 | 0.700 | -0.600 | 63 | 62 | 0.1 | 0.280 | 0.099 |
| s2a-(210) | 10 | 2 | 6 | 0.2 | 0.600 | -0.400 | 61 | 62 | -0.1 | 0.137 | 0.016 |
| s2b-(210) | 10 | 2 | 6 | 0.2 | 0.600 | -0.400 | 61 | 62 | -0.1 | 0.124 | 0.003 |
| s2c-(210) | 10 | 2 | 6 | 0.2 | 0.600 | -0.400 | 61 | 62 | -0.1 | 0.143 | 0.023 |
| s2d-(210) | 10 | 2 | 6 | 0.2 | 0.600 | -0.400 | 61 | 62 | -0.1 | 0.141 | 0.020 |
| s2e-(210) | 10 | 2 | 6 | 0.2 | 0.600 | -0.400 | 61 | 62 | -0.1 | 0.167 | 0.046 |
| s2f-(210) | 10 | 2 | 6 | 0.2 | 0.600 | -0.400 | 61 | 62 | -0.1 | 0.144 | 0.023 |
| s2g-(210) | 10 | 2 | 6 | 0.2 | 0.600 | -0.400 | 61 | 62 | -0.1 | 0.182 | 0.062 |
| s2h-(210) | 10 | 2 | 6 | 0.2 | 0.600 | -0.400 | 61 | 62 | -0.1 | 0.164 | 0.043 |
| s2i-(210) | 10 | 2 | 6 | 0.2 | 0.600 | -0.400 | 61 | 62 | -0.1 | 0.166 | 0.045 |
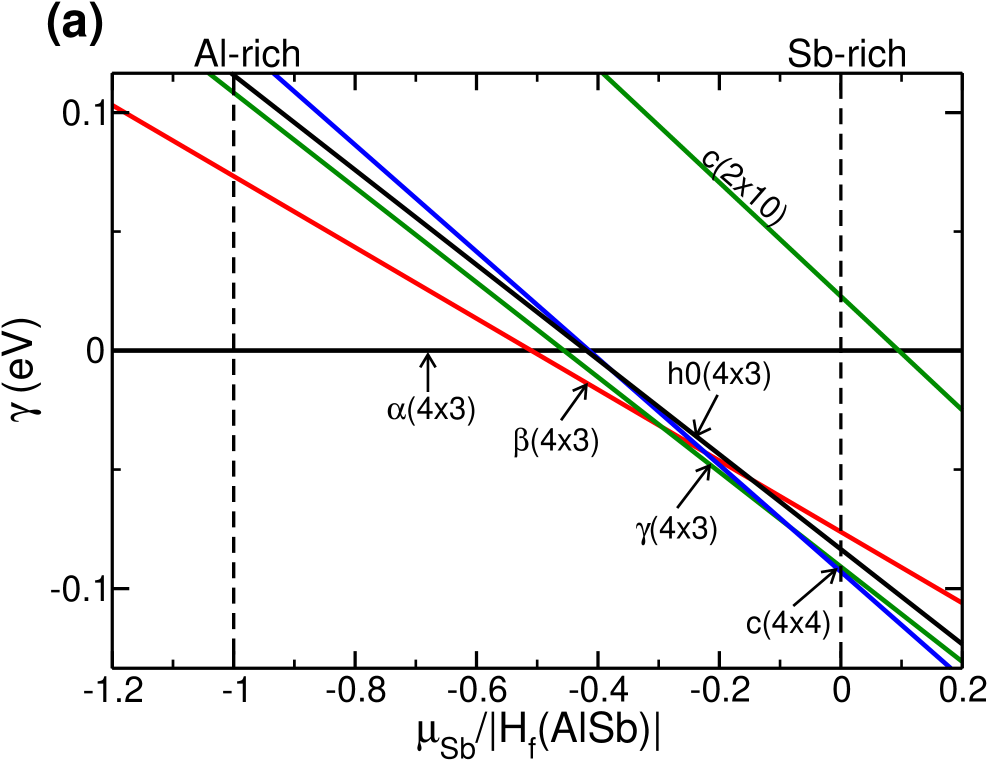
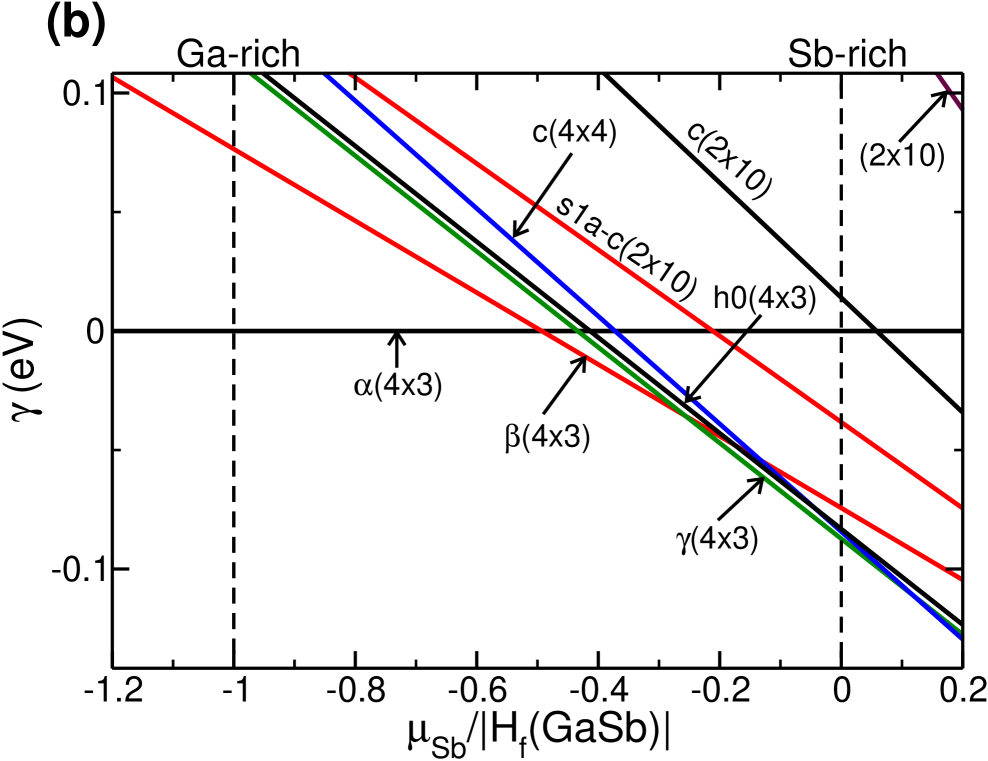
The resulting relative surface energies for AlSb(001) and GaSb(001) are shown in Figs. 5(a) and 5(b), respectively, for the eight models considered here. For each model, the surface energy is linear in , with the slope given by .
For AlSb(001) the predicted stable reconstructions, and their energetic ordering, are in excellent agreement with experiment. Proceeding from Sb-poor to Sb-rich conditions, the predicted sequence is (43) (43) (43) (44), as reported previously W. Barvosa-Carter et al. (2000). This is the same sequence observed experimentally W. Barvosa-Carter et al. (2000). Moreover, (43) is predicted to exist only over a very narrow range of , in agreement with experiment W. Barvosa-Carter et al. (2000).
For GaSb(001) the predicted sequence is qualitatively the same as for AlSb(001), although the (44) is only predicted to be stable for values of above the thermodynamically allowed limit of zero. Experimentally, however, the situation is quite different. As reported previously, neither the (43) nor the (44) phase is observed for any growth condition W. Barvosa-Carter et al. (2000). Instead, under Sb-rich conditions, only the (15) and (25) periodicities have been observed L. J. Whitman et al. (1997).
Righi et al. suggested (43), shown in Fig. 1, as the model for GaSb(001) surface under these conditions M. C. Righi et al. (2005). Our calculation indeed shows that it is energetically as favorable as (43), as shown in Fig. 5(b) and in Table 1. However, (43) must be rejected as it has a wrong periodicity.
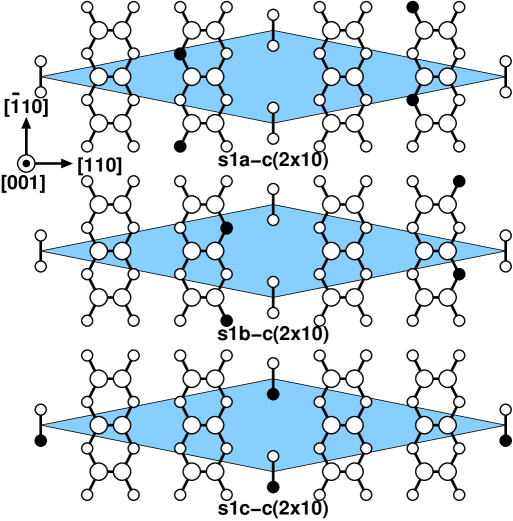
In order to explain the experimentally observed (15) and (25) structures on GaSb(001) surface, we studied a large number of structures based on variations of (210) and (210). We note that (210) violates the ECM substantially () and substitution of Sb atoms in the top layer of the underlying Sb-terminated GaSb(001) surface by Ga atoms can lower the excess electron count. Fig. 3 shows the possible reconstructions when a single Sb atom is replaced by a Ga atom. We use the naming convention of to denote a “single substitution”. As shown in Table 1, all reconstruction indeed have lower excess electron counts.
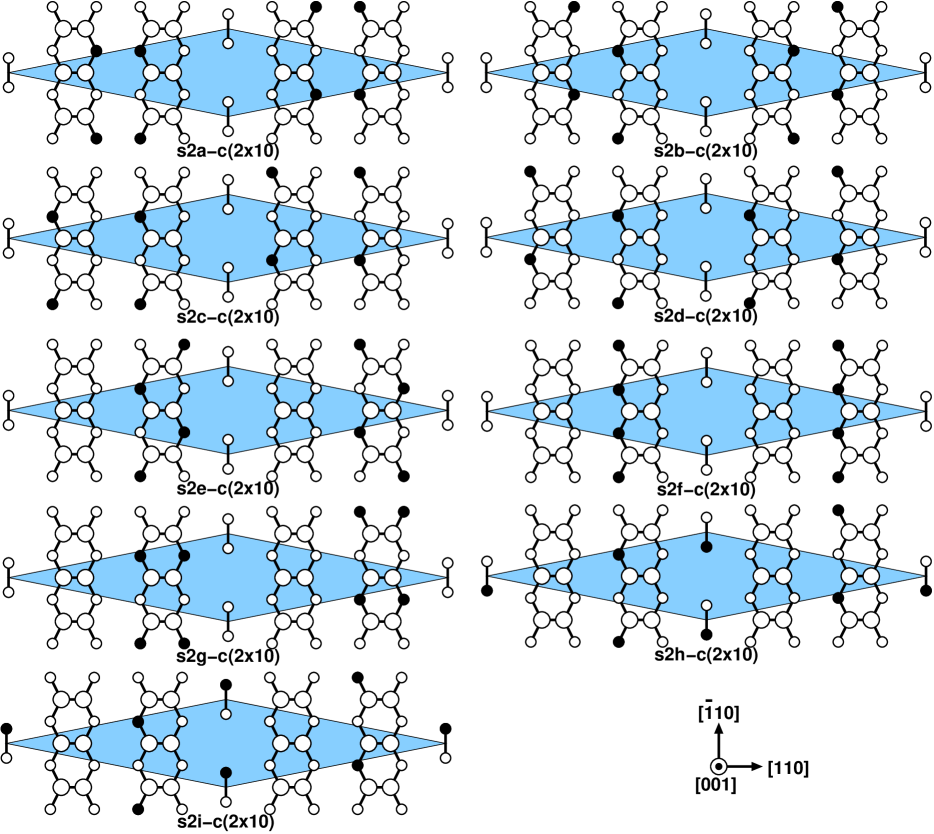
For completeness, we also considered reconstructions resulting from double substitution of Sb atoms by Ga atoms as shown in Fig. 4. More substitutions, however, were not found to be energetically favorable: Table 1 shows that the surface energy of these structures are higher than that of reconstructions. We note that for these double substitutions the excess electron counts are negative, indicating a deficit of electrons relative to the ECM.
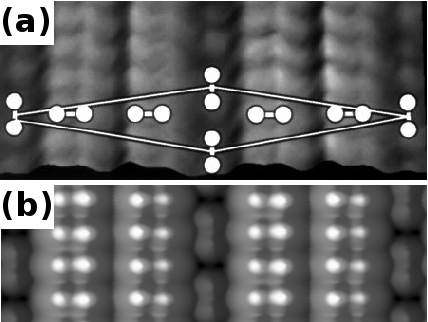
One of the most energetically favorable structures having the correct periodicity is s1a-(210), shown in Fig. 3. s1a-(210) has two clear advantages over (210). First, the surface energy for s1a-(210) is lower than that of (210) by more than 50 meV per (11) unit cell. Second, as shown in Fig. 6, the simulated STM image for s1a-(210) is in a better agreement with the experiment image, in that it reproduces the left-right asymmetry within the surface Sb dimers L. J. Whitman et al. (1997). Furthermore, as shown in Table 1, this model violates the ECM and thus is predicted to be weakly metallic, as observed in tunneling spectroscopy R. M. Feenstra et al. (1994). Therefore, the previously proposed model (210) is unlikely to be the experimentally realized structure.
However, the calculated surface energy of s1a-(210) is higher than that of (43), as shown in Table 1 and Fig. 5(b). Likewise, (210), the structural model generally accepted for the surface with (25) periodicity, is the least energetically favorable structure among the eight structures of Table 1. On the other hand, (43), the most energetically favorable structure among all the structures considered in this study, has a periodicity that has not been observed experimentally to date. These facts leave us with two possible conclusions: either the correct structural model remains undiscovered, or the experimentally obtained surface is not the ground-state structure.
The latter possibility, a kinetically limited surface, bears closer consideration. For example, there may be an activation barrier to forming the mixed dimers on GaSb that cannot be overcome within the growth temperatures and times used here. Indeed, to stabilize these surfaces during the growth, one must go from active growth with both Ga and Sb flux at 500 ∘C, to room temperature and no flux while trying to stabilize the surface. This process typically involved simultaneously lowering the temperature while turning off the Ga and then lowering the Sb flux. The surface cannot be annealed, because that would drive off Sb and create (3) reconstructions. These considerations lead us to propose that the s1a-(210) structure is the most likely model for the observed GaSb(001) surface as created under Sb-rich growth conditions and subsequently stabilized under vacuum.
IV Summary and Conclusions
We have performed ab initio calculations on the surface energy and atomic structure of AlSb(001) and GaSb(001) surfaces with various reconstructions. Surface stability diagrams for a large number of reconstruction models are constructed under different growth conditions. For AlSb(001), we confirmed that the predictions of the currently accepted models are in good agreement with experimentally observed reconstructions. For GaSb(001), we showed that previously proposed model accounts for the experimentally observed reconstructions under Ga-rich growth conditions, but fails to explain the experimental observations under Sb-rich conditions. Therefore, we propose s1a-(210) as a better alternative to existing models for GaSb(001) under extreme Sb-rich growth conditions. Our calculations show that s1a-(210) has a substantially lower surface energy than all (5)-like reconstructions proposed previously and, in addition, it leads to a simulated STM image in better agreement with experiment than existing models. However, s1a-(210) has higher surface energy than (43), a model with periodicity that has not been observed. Hence we conclude that the experimentally observed (15) and (25) structures on GaSb(001) are not the ground-state structure, but kinetically limited ones.
V Acknowledgment
This work was in part supported by the US Department of Defense under the CHSSI MBD-04 (Molecular Packing Software for ab initio Crystal Structure and Density Predictions) project and by the Office of Naval Research. Computer time allocation has been provided by the High Performance Computing Collaboratory (HPC2) at Mississippi State University.
References
- J.B. Boos et al. (1998) J.B. Boos, W. Kruppa, B.R. Bennett, D. Park, S.W. Kirchoefer, R. Bass, and H.B. Dietrich, IEEE Trans. Electron Devices 45, 1869 (1998).
- J.S. Scott et al. (1994) J.S. Scott, J.P. Kaminski, S.J. Allen, D.H. Chow, M. Lui, and T.Y. Liu, Surf. Sci. 305, 389 (1994).
- M. J. Yang et al. (1998) M. J. Yang, W. J. Moore, B. R. Bennett, and B. V. Shanabrook, Electron. Lett. 34, 270 (1998).
- F. Fuchs et al. (1997) F. Fuchs, U. Weimer, W. Pletschen, J. Schmitz, E. Ahlswede, M. Walther, J. Wagner, and P. Koidl, Appl. Phys. Lett. 71, 3251 (1997).
- Gerhard Klimeck et al. (1998) Gerhard Klimeck, Roger Lake, and Daniel K. Blanks, Phys. Rev. B 58, 7279 (1998).
- D. Z.-Y. Ting and T. C. McGill (1996) D. Z.-Y. Ting and T. C. McGill, J. Vac. Sci. Technol. B 14, 2790 (1996).
- D. J. Chadi (1987) D. J. Chadi, J. Vac. Sci. Technol. A 5, 834 (1987).
- M. D. Pashley (1989) M. D. Pashley, Phys. Rev. B 40, 10481 (1989).
- John E. Northrup and Sverre Froyen (1994) John E. Northrup and Sverre Froyen, Phys. Rev. B 50, 2015 (1994).
- S. B. Zhang and Alex Zunger (1996) S. B. Zhang and Alex Zunger, Phys. Rev. B 53, 1343 (1996).
- C. D. MacPherson et al. (1996) C. D. MacPherson, R. A. Wolkow, C. E. J. Mitchell, and A. B. McLean, Phys. Rev. Lett. 77, 691 (1996).
- L. J. Whitman et al. (1997) L. J. Whitman, P. M. Thibado, S. C. Erwin, B. R. Bennett, and B. V. Shanabrook, Phys. Rev. Lett. 79, 693 (1997).
- W. Barvosa-Carter et al. (2000) W. Barvosa-Carter, A.S. Bracker, J.C. Culbertson, B.Z. Nosho, B.V. Shanabrook, L.J. Whitman, Hanchul Kim, N.A. Modine, and E. Kaxiras, Phys. Rev. Lett. 84, 4649 (2000).
- M. T. Sieger et al. (1995) M. T. Sieger, T. Miller, and T.-C. Chiang, Phys. Rev. B 52, 8256 (1995).
- J. Piao et al. (1990) J. Piao, R. Beresford, and W. I. Wang, J. Vac. Sci. Technol. B 8, 276 (1990).
- Mitsuaki Yano et al. (1991) Mitsuaki Yano, Hisakazu Yokose, Yoshio Iwai, and Masataka Inoue, J. Vac. Sci. Technol. B 111, 609 (1991).
- G. E. Franklin et al. (1990) G. E. Franklin, D. H. Rich, E. A. Samsavar, F. M. Leibsle, T. Miller, and T.-C. Chiang, Phys. Rev. B 41, 12619 (1990).
- Guo-Xin Qian et al. (1988) Guo-Xin Qian, Richard M. Martin, and D. J. Chadi, Phys. Rev. B 38, 7649 (1988).
- D. M. Ceperley and B. J. Alder (1980) D. M. Ceperley and B. J. Alder, Phys. Rev. Lett. 45, 566 (1980).
- J. P. Perdew and A. Zunger (1981) J. P. Perdew and A. Zunger, Phys. Rev. B 23, 5048 (1981).
- Vanderbilt (1990) D. Vanderbilt, Phys. Rev. B 41, 7892 (1990).
- Kresse and Hafner (1994) G. Kresse and J. Hafner, Journal of Physics: Condensed Matter 6, 8245 (1994).
- Kresse and Furthmüller (1996) G. Kresse and J. Furthmüller, Phys. Rev. B 54, 11169 (1996).
- M. C. Righi et al. (2005) M. C. Righi, Rita Magri, and C. M. Bertoni, Phys. Rev. B 71, 75323 (2005).
- R. M. Feenstra et al. (1994) R. M. Feenstra, D. A. Collins, D. Z. Y. Ting, M. W. Wang, and T. C. McGill, Phys. Rev. Lett. 72, 2749 (1994).