The Disturbed 17 keV Cluster Associated with the Radio Galaxy 3C 438
Abstract
We present results from a Chandra observation of the cluster gas associated with the FR II radio galaxy 3C 438. This radio galaxy is embedded within a massive cluster with gas temperature 17 keV and bolometric luminosity of 61045 ergs s-1. It is unclear if this high temperature represents the gravitational mass of the cluster, or if this is an already high ( 11 keV) temperature cluster that has been heated transiently. We detect a surface brightness discontinuity in the gas that extends 600 kpc through the cluster. The radio galaxy 3C 438 is too small (110 kpc across) and too weak to have created this large disturbance in the gas. The discontinuity must be the result of either an extremely powerful nuclear outburst or the major merger of two massive clusters. If the observed features are the result of a nuclear outburst, it must be from an earlier epoch of unusually energetic nuclear activity. However, the energy required (1063 ergs) to move the gas on the observed spatial scales strongly supports the merger hypothesis. In either scenario, this is one of the most extreme events in the local Universe.
1 Introduction
The Chandra and XMM-Newton Observatories have profoundly influenced our knowledge of the gas dynamics in clusters of galaxies. A wide range of phenomena including cold fronts, shocks, and cavities have been studied in a large number of objects over a wide range in redshift due to the unprecedented angular resolution and sensitivity of these two observatories. One of the most unexpected observational results of the Chandra/XMM-Newton era has been the non-detection of large amounts of cooling gas in cluster cores inferred from observations made with the previous generation of observatories. A large fraction of the clusters observed with these two observatories exhibit a disturbed morphology. The role that AGN outbursts and mergers play in the energy budget and temporal evolution of clusters is still a question of considerable observational and theoretical interest. The study of the most energetic AGN outbursts and mergers is of particular interest as these relatively rare events will have the most dramatic and long-lasting effects on the cluster gas (Bîrzan et al. 2004).
In this Letter, we report the discovery of a 17 keV cluster associated with the radio galaxy 3C 438. This is the hottest cluster known to date, marginally exceeding the temperature of even the well studied ‘Bullet’ cluster (Markevitch et al. 2002). The high temperature exceeds that of any known relaxed cluster, and is almost certainly not indicative of its gravitational mass. The X-ray morphology of the cluster gas is highly disturbed, with an X-ray surface brightness discontinuity that stretches at least 140′′ (600 kpc) in an arc extending south from the core. Whether this unusually high temperature and complex morphology is the result of a radio outburst or an on-going major merger is not clear, although we argue that the morphology suggests the latter. The linear size of the radio galaxy 3C 438 is small relative to the surface brightness discontinuity, so the observed features cannot be the result of the current nuclear activity. There are some hints of cavities larger than the lobes of 3C 438 to the east and west of the nucleus, perhaps suggestive of ‘ghost’ cavities created by an earlier epoch of nuclear activity. If these features are the result of a nuclear outburst, the inferred energy to evacuate a single cavity would be 3.41062 ergs, at least factor of a few larger than the outbursts seen in nearby clusters such as Hydra A (Wise et al. 2006) and MS0735+7421 (McNamara et al. 2005).
This paper is organized as follows. In section 2, we present the observational details and discuss the cleaning of the data. Our results are presented in section 3. Section 4 contains a discussion of the implications of our results. Section 5 contains a brief summary and conclusion. We assume a cosmology with =71, =0.27, and =0.73 throughout this paper (Spergel et al. 2006). The observed redshift (=0.290, Hewitt & Burbidge 1991) of the host galaxy of 3C 438 corresponds to a luminosity distance of 1481.6 Mpc, and one arcsecond is 4.317 kpc. All uncertainties are at 90% confidence for one parameter of interest unless otherwise stated, and all coordinates are J2000. This source lies at relatively low Galactic latitude (=-12.98∘); absorption by gas in our Galaxy (=2.051021 cm-2) (Dickey & Lockman 1990) is included in all spectral fits and count rate to flux conversions.
2 Data Analysis
The radio galaxy 3C 438 was observed for 47.5 ks with the ACIS-S instrument on 27JAN02 (OBSID 3967). The data were reprocessed to apply the most up to date gain and CTI correction, and the event file was filtered to remove events at node boundaries. Standard ASCA grade filtering (i.e. event grades 0,2,3,4,6) was applied to the data. A lightcurve was created in the 5-10 keV band after removal of point sources to search for periods of background flaring. Intervals where the background rate was more than 3 above the mean were removed, leaving 29.5 ks of good time. X-ray emission from the cluster does not fill the field of view, so a distant region of the S3 chip was used for background for spectral analysis. The composite background files created from multiple observations near the galactic poles would not be appropriate for this observation due to the low galactic latitude and significant absorption. The radio structure of 3C 438 has been studied previously at several frequencies (Hardcastle et al 1997, Treichel et al 2001). For the current paper we made a 1.5 GHz radio map with 1.5′′ resolution from archival VLA data, calibrating and reducing them in the standard manner using AIPS.
3 Results
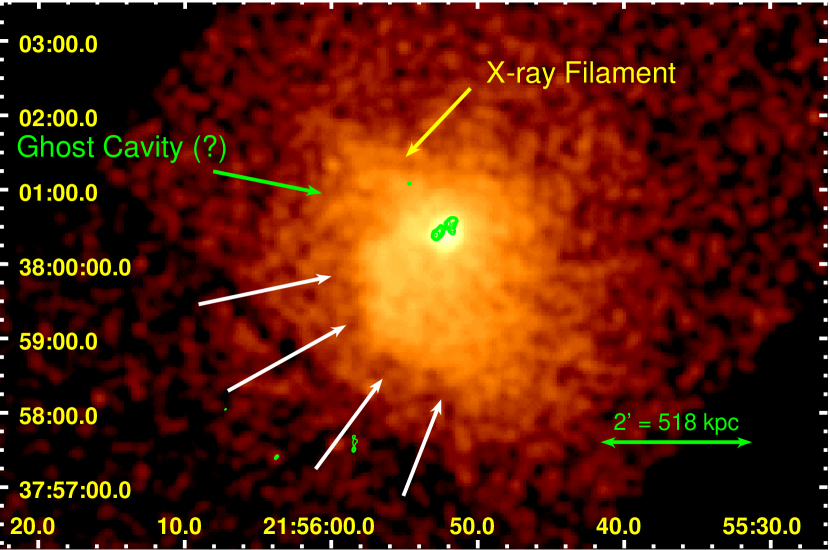
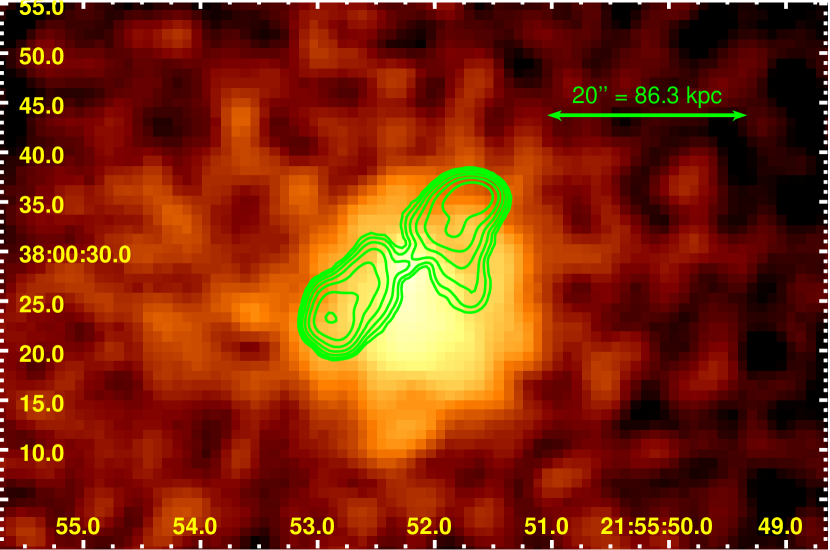
A Gaussian smoothed (=6′′) Chandra/ACIS-S image of 3C 438 in the 0.5-5.0 keV band with 1.5 GHz radio contours (1.5′′ resolution) overlaid is shown in Figure 1. The most striking feature of Figure 1 is the surface brightness discontinuity in the large scale gas (denoted by the white arrows). This discontinuity is an arc that extends more than 140′′ (600 kpc). This suggests that the cluster is highly disturbed on scales of hundreds of kpc. There is also a decrement of X-ray counts in a semicircular region 1′ east of the host galaxy of 3C 438. This decrement is suggestive of ‘ghost’ cavities created by the inflation of radio lobes. The radio galaxy 3C 438 lies within the X-ray core, but slightly (4.5′′, 20 kpc) offset to the northeast from the peak of the X-ray emission. This is more clearly demonstrated in Figure 2, a zoom in on the nuclear region.
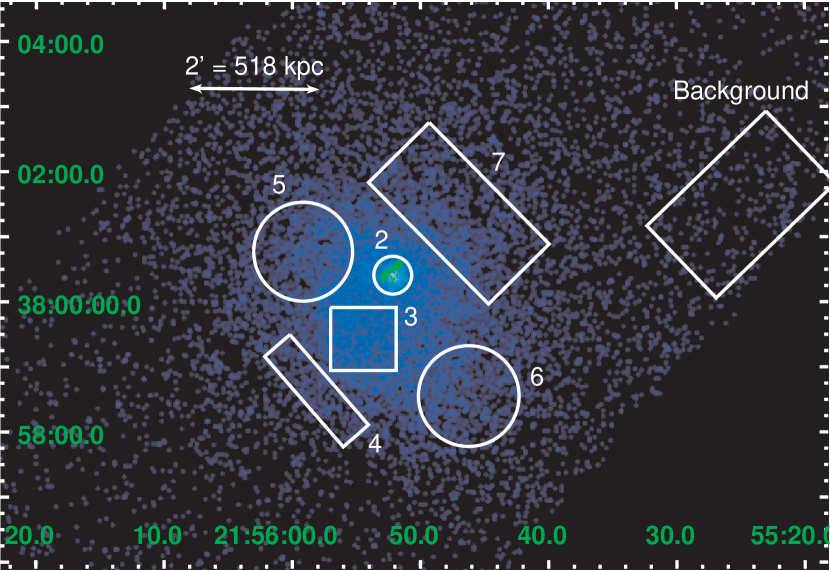
We fitted spectra to eight regions (labeled 1a, 1b, and 2 through 7) of the cluster gas. The positions of regions two through seven and the distant background region are shown in Figure 3. Regions 1a and 1b correspond to a circular region (radius 84.5′′) and an annular region (inner and outer radii of 84.5′′ and 138.9′′), respectively, centered 19′′ SSW of the nucleus of the radio galaxy. These two regions roughly encompass the X-ray emission inside and outside of the prominent surface brightness discontinuity. Single temperature APEC models were fitted with the elemental abundances frozen to half the Solar value, the column density fixed at the Galactic value, and the redshift frozen at the value measured for the host galaxy of 3C 438. The abundance is poorly constrained if allowed to vary freely, in part because of the high gas temperature. The data were binned to a minimum of 50 counts per bin. The only free parameters were the temperatures and normalizations. The results of the fits (all statistically acceptable) are summarized in Table 1.
4 Interpretation
The best-fit temperature for the gas within 365 kpc of the nucleus of the cluster (region 1a) is 17 keV! As can be seen from Table 1, the best-fit temperature on larger spatial scales is consistent with this value, within large errors. There are clearly some cooler subregions contained within 1a, such as the core (region 2) and the gas on the interior of the surface brightness discontinuity (region 3). Even in these cases, however, the cooler gas has a temperature of 11 keV. The gas temperature is beyond that of any known relaxed cluster in the local Universe. Assuming a uniform temperature of 17 keV, the unabsorbed bolometric luminosity of the gas within 600 kpc of the host galaxy of 3C 438 is 61045 ergs s-1. This is therefore one of the hottest, most luminous clusters, rivaling the distant (z=0.451) cluster RX J1347.5-1145 (Allen et al. 2002, Gitti et al. 2004), the hottest, most X-ray luminous, reasonably relaxed cluster known. This temperature is also comparable to that measured in the highly disturbed ‘Bullet’ cluster (15 keV, with some regions exceeding 20 keV) (Markevitch et al. 2002). Extrapolation of the cluster temperature function derived from clusters with z0.1 to 17 keV demonstrates that the space density of such hot clusters is small (Markevitch 1998). There is little or no evolution of the cluster relation out to at least z=0.5 (Mushotzky and Scharf 1997, Novicki et al. 2002, among many others). It is therefore unlikely, although not impossible, that the high gas temperature is representative of the gravitational mass of the cluster.
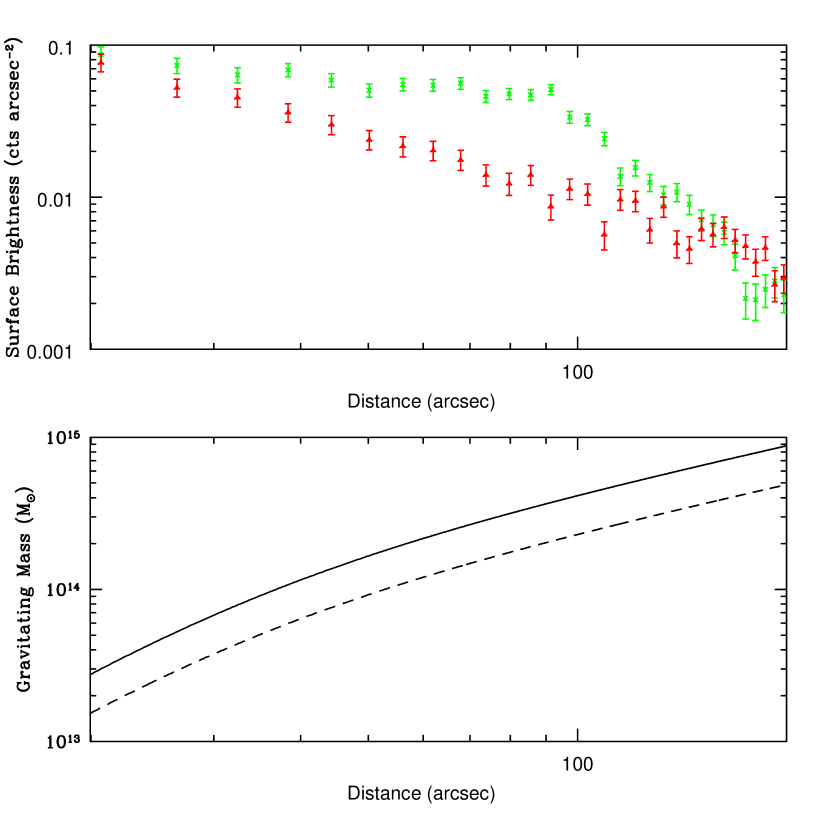
To investigate the gravitational mass of the cluster we consider the surface brightness profile of the cluster. X-ray surface brightness profiles in two 30∘ wedges north and south of the nucleus (centered on the nucleus) are plotted in Figure 4 (top). The surface brightness discontinuity to the south of the nucleus manifests itself as a sharp change in the slope of the profile at about 95′′ (410 kpc) from the nucleus. The surface brightness of the gas to the north of the nucleus is relatively smooth, so we fitted a beta-model profile to the data in this wedge between ( kpc) to determine the undisturbed density profile. The core radius, , is poorly determined in the fits, so we held it constant at 30′′ (130 kpc). We find a best-fit value of =0.520.04, somewhat flat for a cluster of galaxies, but not unreasonable. The central hydrogen density, , is 3.410-2 cm-3 for =1.2, appropriate for an fully ionized plasma with sub-Solar elemental abundances. We have plotted the gravitational mass of the cluster as a function of distance from the nucleus in Figure 4 (bottom) using the parameters derived from the surface brightness profile assuming hydrostatic equilibrium for two temperatures, 10 and 17 keV. The extrapolations of these two curves to (2.6 and 2.0 Mpc for 17 and 10 keV cluster, respectively) is roughly consistent with the mass profiles derived from the HIFLUGCS sample of 63 clusters with 0.1 and 1.0T10 keV (Finoguenov et al. 2001). The cluster mass at is on the order of a few times 1015 M⊙ in either case. Hydrodynamic simulations of merging clusters show a complex time evolution of the cluster - relationship (Randall et al. 2002, Rowley et al. 2004), so that determination of mass in this manner may be biased, although the variation of - during a merger is smaller than our uncertainties on the cluster temperature. In any case, our conclusions below are not sensitive to whether the underlying gravitational mass profile is representative of a 10 keV cluster, a 17 keV cluster, or an even larger cluster.
The high temperature combined with the highly disturbed morphology suggests that we are witnessing a dramatic event. There are at least three possible scenarios that would explain the high cluster temperature and disturbed morphology. First, an extremely powerful nuclear outburst inflated radio lobes in the gas. Second, this system is a pair of massive clusters of roughly equal mass undergoing a major merger. Third, the observed X-ray surface brightness discontinuity is the result of ‘sloshing’ of the gas due to a minor merger.
If the observed features are the result of a radio outburst, it is clear that the present epoch of nuclear activity cannot be responsible for disturbing the gas on scales of hundreds of kpc. The radio galaxy 3C 438 is too small (with a projected linear size of only 100 kpc) to be relevant to the observations of the surface brightness discontinuity. It is also too weak: the amount of energy required to evacutate the cavities created by the inflation of the lobes of 3C 438 is only a small fraction of that required to displace the gas to create the surface brightness discontinuity. The bubble enthalpy of the lobes (4) is 2.71060 ergs. Interestingly, the equipartition enthalpy of the lobes is more than an order of magnitude below this, implying a substantial departure from equipartition and/or a significant contribution to pressure from non-radiating particles in the lobes of 3C 438. In this scenario in which the large-scale disturbance in the cluster gas is the result of a nuclear outburst, it must have been an earlier epoch of AGN activity, although there is no evidence of any large scale, low frequency radio emission suggestive of aged, steep-spectrum radio plasma. There is what appears to be a ‘ghost cavity’ east of the nucleus (spectral region 5) 45.6′′ in diameter, and perhaps a budding bubble to the W (spectral region 6), similar to what has been observed in M87 (Forman et al. 2005). The energy required to completely evacuate the eastern cavity ( work) is 3.41062 ergs assuming that the surface brightness profile of the northern wedge (discussed above) represents the undisturbed gas. The enthalpy of two such bubbles is 2.41063 ergs. The energy required to create the discontinuity to the west of region 6 is at least several times this. For comparison, the total thermal energy in the gas to this radius is 1.51064 ergs.
There are two problems with this outburst scenario. First, and most significantly, the energy requirement, a few1063 ergs, strongly argues against this hypothesis. This would be the most powerful nuclear outburst known, far exceeding those observed in Hydra A (Wise et al. 2006) and MS0735+7421 (McNamara et al. 2005), and would require unrealistically large black hole growth and accretion rate. Assuming 10% efficiency, approximately 1010 would have to be accreted onto the central SMBH to power an outburst of 21063 ergs. In addition, the sound crossing time to reach the end of the discontinuity is 2108 yrs, so the mass accretion rate would be an unrealistically large 100 yr-1. Second, if the eastern cavity and western bubble are in fact remnants of an earlier epoch of radio activity, they lie at roughly 45 degree angles to the direction of the jets of the current outburst. This would imply that the spin axis of the supermassive black hole at the center of the host galaxy of 3C 438 has changed direction within the last 108 yrs. This is not entirely implausible as the host galaxy may have merged with another galaxy in this period. Optical observations of the host galaxy reveal that there are several nearby companions, although there is no evidence of a recent merger (Madrid et al. 2006). Recent simulations of the viscous dissipation of buoyant bubbles demonstrate that their long term evolution may have little relation to the initial jet axis (Brüggen et al. 2005).
The other possibility, and the more likely one in our view, is that we are witnessing a major merger between two massive clusters. In this scenario, the X-ray surface brightness discontinuity is a cluster cold front and the high temperature gas is the shock-heated plasma of the other cluster. One cluster is moving roughly to the southeast in the plane of the sky. A temperature of 17 keV implies a relative velocity of 2700 km s-1 for the two clusters if this temperature is shock heated gas. This velocity is entirely reasonably, and is, in fact, comparable to what has been inferred for the ‘Bullet’ cluster (Springel & Farrar 2007). The primary problem with this interpretation is that there is only one peak in the X-ray emission, centered on the host galaxy of 3C 438. We might expect to see two cluster cores if the system is an ongoing massive merger. Due to the low Galactic latitude of the system, existing optical data are not good enough to determine whether the distribution of cluster galaxies is consistent with a major merger scenario. As stated earlier, the position of 3C 438 and its host galaxy is slightly offset to the NE from the approximate X-ray peak. This suggests that the galaxy is moving to the NE and that the dense core of gas is being displaced from the center of the gravitational potential by the ram pressure of the larger scale gas.
A third possibility that we consider unlikely is that the gas of the cluster core is ‘sloshing’ as the result of a minor merger. In this scenario, an oscillation of the cluster gas in the gravitational potential has been induced by a minor (10:1 mass ratio) merger. The observed X-ray surface brightness discontinuity is the contact discontinuity between two fluids. Such a model has been invoked to explain surface brightness edges observed in Abell 1795 (Markevitch et al. 2001), and there are morphological similarities between Abell 1795 and the cluster gas around 3C 438. The energy required to displace the gas in the gravitational potential of the dark matter to the approximate position of the discontinuity is 2.31063 ergs (1.41063 ergs for a 10 keV cluster). The primary difficulty with the scenario is that the oscillating core is unlikely to have dissipated much energy so that the 17+ keV gas temperature represents the quiescent temperature/mass of the cluster. In addition, this can only be considered a ‘minor’ merger that only initiates oscillations of the core gas because of the extremely high temperature/mass of one of the clusters. A merger that dissipates 1063 ergs would be a major event in virtually any other cluster.
5 Summary and Conclusions
We report the discovery of a hot (17 keV), luminous, morphologically disturbed cluster associated with the radio galaxy 3C 438. If this temperature is indicative of the gravitating mass of the cluster, it would be one of the most massive clusters known. It is most likely that the high temperature is the result of a massive merger, although the limited quality of the data prevents a definitive conclusion. Whatever the case, the high temperature and luminosity of the cluster ensures that the origin of the disturbance is one of the most energetic events in the local Universe. Deeper Chandra and XMM-Newton observations are required to further elucidate the dynamics and energetics of this system. Smaller uncertainties on the gas temperature beyond the discontinuity would be particularly useful to better constrain the gas dynamics. Lensing measurements of the gravitational mass of the cluster would be useful, but the low galactic latitude, crowded field, and significant optical extinction may make such measurements difficult.
6 Acknowledgements
This work was supported by NASA grant NAS8-03060 and the Royal Society. We would like to thank the anonymous referee for comments that improved this paper.
References
- (1)
- (2) Allen, S. W., Schmidt, R. W., & Fabian, A. C. 2002, MNRAS, 335, 256.
- (3)
- (4) Bîrzan, L., et al. 2004, ApJ, 607, 800.
- (5)
- (6) Brüggen, M. Ruszkowski, M., Hallman, E. 2005, ApJ, 630, 740.
- (7)
- (8) Dickey, J. M., & Lockman, F. J. 1990, ARA&A, 28, 215.
- (9)
- (10) Finoguenov, A. et al. 2001, A.& A., 368, 749.
- (11)
- (12) Forman, W. R. et al. 2005, ApJ, 635, 894.
- (13)
- (14) Gitti, M., & Schindler, S. 2004, A. & A., 427, L9.
- (15)
- (16) Hardcastle, M. J., Alexander, P., Pooley, G. G., Riley, J. M. 1997, MNRAS, 288, 859.
- (17)
- (18) Hewitt, A., & Burbidge, G. 1991, ApJS, 75, 297.
- (19)
- (20) Madrid, J., et al. 2006, ApJS, 164, 307.
- (21)
- (22) Markevitch, M. 1998, ApJ, 504, 27.
- (23)
- (24) Markevitch, M., Vikhlinin, A., & Mazotta, P. 2001, ApJ, 562, L153.
- (25)
- (26) Markevitch, M., Gonzalez, A. H., David, L., Vikhlinin, A., Murray, S., Forman, W., Jones, C., Tucker, W. 2002, ApJ, 567, L27.
- (27)
- (28) McNamara, B., et al. 2005, Nature, 433, 45.
- (29)
- (30) Mushotzky, R. & Scharf, C. A. 1997, ApJ, 482, L13
- (31)
- (32) Novicki, M. C., Sornig, M., & Henry, J. P. 2002, AJ, 124, 2413.
- (33)
- (34) Randall, S. W., Sarazin, C. L., & Ricker, P. M. 2002, ApJ, 577, 579.
- (35)
- (36) Rowley, D. R., Thomas, P. A., & Kay, S. T. 2004, MNRAS, 352, 508.
- (37)
- (38) Spergel, D., et al. 2006, astroph/0603449.
- (39)
- (40) Springel, V. & Farrar, G. 2007, astroph/0703232.
- (41)
- (42) Treichel, K., et al. 2001, ApJ, 561, 691.
- (43)
- (44) Wise, M. et al. 2006, astroph-0612100.
- (45)
| Region | Temperature (keV) |
|---|---|
| 1a | 16.6 |
| 1b | 20.7 |
| 2 | 10.7 |
| 3 | 10.9 |
| 4 | 10.0 |
| 5 | 20.6 |
| 6 | 17.2 |
| 7 | 26.6 |