XMM–Newton observation of the persistent Be/neutron–star system X Persei at a high–luminosity level
We report on the XMM–Newton observation of the HMXRB X Persei, the prototype of the persistent and low–luminosity Be/neutron star pulsars, which was performed on February 2003. The source was detected at a luminosity level of erg s-1, which is the highest level of the latest three decades. The pulsation period has increased up to 839.3 s, thus confirming the overall spin–down of the NS detected in the previous observations. The folded light–curve has a complex structure, with features not observed at lower luminosities, and shows a significant energy dependence. The spectral analysis reveals the presence of a significant excess at low energies over the main power–law spectral component, which can be described by a black–body spectrum of high temperature (kT 1.5 keV) and small emitting region (R 340 m); its properties are consistent with a polar–cap origin. Phase–resolved spectroscopy shows that the emission spectrum varies along the pulse period, but it is not possible to prove whether the thermal component is pulsed or not.
Key Words.:
stars: individual: X Persei – X–rays: binaries1 Introduction
The X-ray source 4U 0352+309 is the brightest and perhaps most famous member of the Be/NS HMXRB class, whose optical counterpart was identified with the star X Persei (Braes & Miley 1972; van den Bergh 1972; Brucato & Kristian 1972; Weisskopf et al. 1984). In this system the companion pulsar accretes material from the massive, low–velocity equatorial wind of the Be primary star and emits X–rays as the gravitational energy of the infalling material is converted to X–ray luminosity.
From the optical point–of–view, X Persei (HD 24534, HR 1209) is a bright and highly variable star (on time scales from minutes to years) in optical and infrared (IR) brightness (V = 6.1–6.8, K = 5.2–6.7) and in emission–line strength (Mook et al. 1974; Roche et al. 1997). When the star is particularly bright, its spectrum displays strong emission in Hα and other Balmer lines which marks this clearly as a Be–type system; when the star is faint, the emission lines disappear, and it appears to be a normal early–type star (see: Fabregat et al. 1992; Roche et al. 1997 ; and references therein). In the past, sometimes it showed also extreme, extended low states (Norton et al. 1991); during these periods the Hα line profile changed from emission to absorption, accompanied by a decrease in the IR flux by over a magnitude (Reynolds et al. 1992; Roche et al. 1993).
Such a variability is commonly supposed to be caused by the formation and dissipation of a disk around the star, as in other Be stars. However, between 1994 and 1995 Liu & Hang (2001) observed that the Hα EW continued to increase even during the optical and near-infrared fading. They found that, although both components (line and continuum) arise from the same circumstellar envelope, their emission peaks at different evolution stages of the envelope itself, which correspond to different distances from the central star. In this scenario, the observed behaviour of the two components is attributed to the ejection of matter from the Be star as consecutive expanding rings.
The spectral class of the underlying OB star has been estimated to be O9.5 IIIe by Slettebak (1982). More recently Lyubimkov et al. (1997) have used both spectroscopic and photometric observations of the low–luminosity diskless phase of X Persei to infer the characteristics of the visible component; their results suggest a star of B0 Ve type, which is likely to have a mass of 13–20 M⊙ and a radius of 5–10 R⊙. With a projected equatorial velocity sin of 1200 km s-1 (Reynolds et al. 1992; Lyubimkov et al. 1997) the Be star is probably seen under a low or intermediate inclination angle.
Considering UV, optical and IR data taken in diskless and near–diskless states Telting et al. (1998) modelled the stellar photosphere with Teff = 31000 K and log() = 4. Then they derived E(B-V) = 0.39 and, assuming R∗ = 9 R⊙, estimated the distance to X Persei as 950 200 pc. With a Galactic latitude of -17∘, a distance estimate of 1 kpc implies that X Persei would be 300 pc from the Galactic plane. This is rather far off the plane for an early–type star. However, it is within a few degrees of the plane of Gould’s Belt and the distance estimates for X Persei and the inferred extent of Gould’s Belt ( 600 pc; Torra et al. 2000) are marginally compatible.
The X–ray source has an unusually low luminosity, since up to now it has varied on timescales of years between 2.5 and 15 ergs s-1; moreover, while most Be/NS binary systems are transient in nature, 4U 0352+309 is a source of persistent X-ray emission. This is perhaps due to the relatively wide and nearly circular orbit of the system, whose complete ephemeris were determined by Delgado-Martí et al. (2001). They used measurements made with the All Sky Monitor (ASM) on RossiXTE to perform a pulse timing analyses of the 837 s pulsations and found strong evidence for the presence of orbital Doppler delays. In this way they inferred that the orbit is characterized by a period Porb = 250.3 days, a projected semimajor axis of the neutron star sin = 454 lt–s, a mass function and an eccentricity e = 0.11. The measured orbital parameters, together with the known properties of the classical Be star X Persei imply a semimajor axis a = 1.8–2.2 AU and an orbital inclination 26–33∘.
Pfahl et al. (2002) proposed this object as the prototype for a new class of HMXRBs characterised by long orbital periods (P 30 days) and low eccentricities. These systems are so much wide that no tidal circularisation can have occurred after the supernova explosion that created the neutron star, therefore all induced eccentricity must be primordial. While high velocity kicks are necessary to explain the eccentric orbits of most BeX transients (van den Heuvel & van Paradijs 1997), the low–e orbit of X Persei and of the other systems of its class must have formed in a supernova explosion without kick.
Its 837 s pulsation period was discovered with the Uhuru satellite (White et al. 1976, 1977; Margon et al. 1977) and is still one of the longest periods of any known accreting pulsar (Bildsten et al. 1997; Haberl et al. 1998). The pulse profile of this source is almost sinusoidal. Some authors (Robba et al. 1996; Coburn et al. 2001) have reported the presence of structures in the hardness ratio (4–11 keV)/(1–4 keV), i.e., a sharp hardening episode corresponding to the pulse minimum and two softening episodes just before and after this hard spike.
Like many accreting pulsars, the history of the pulse period of 4U 0352+309 shows no evidence for a regular spin–up. For the first years after the discovery of pulsations, the pulsar exhibited apparently erratic pulse frequency variations on a time-scale of a few days, which were superposed on a long term trend in which it was spinning up at the rate of yr-1. This was followed by a large apparent torque reversal around 1978; since then, although the spin period measurements have been infrequent, the star has been spinning down at an average rate of yr-1 (White et al. 1976; Robba et al. 1996; di Salvo et al. 1998; Delgado-Martí et al. 2001 ; and references therein). In all, there have been only about two dozen determinations of the pulse period of 4U 0352+309, so that its pulse period behavior on short timescales (e.g., weeks, months, and even a year) is not well documented.
The transitions between the spin-up and spin-down stages occur without any significant variations of the system X–ray luminosity and, therefore, cannot be associated with the transitions of the neutron star between the accretor and propeller states. The long–term spin–down trend argues against the presence of a persistent accretion disk in this system; in contrast, the assumption of a spherical geometry in the accretion flow allows us to interpret the spin period of the neutron star in X Persei in terms of the equilibrium period, P, provided the average (on a time-scale of 20 yr) value of the wind velocity is 350–400 km s-1. The spin–up/spin–down behaviour of the source within this scenario can be associated with variations of the stellar wind velocity, which are due to the activity of the massive component and the orbital motion of the neutron star, whose trajectory is inclined to the plane of decretion disk of the Be companion (Ikhsanov 2007).
Another unusual aspect of 4U 0352+309 is its X–ray spectrum. Most accreting X–ray pulsar spectra are well described by a standard model, in which a simple power law with a photon index of 1 is exponentially cut off above 20 keV (White et al. 1983). The source 4U 0352+309, on the other hand, does not follow this standard spectral shape; it is possible that this is due to the low mass accretion rate. As a result, a variety of different models have been used to fit the spectrum. Using observations taken with RossiXTE Coburn et al. (2001) found that all these models were improved by the addition of a cyclotron resonant scattering feature (CRSF) at 29 keV. In particular, the model that best fitted the data is a combination of a blackbody plus a power law modified by a CRSF at 28.6 keV, which implies a magnetic field strength of 2.5(1+z)1012 G in the scattering region (where z is the gravitational redshift). In the phase–averaged spectrum there is no evidence of a fluorescent Fe K-shell emission line in the range 6.4–6.7 keV, and the phase–resolved analysis shows that the blackbody and cyclotron line energies are consistent with being constant through the pulse.
Recently, Grundstrom et al. (2007) have observed that between 2000 and 2006 the circumstellar disk grew to near record proportions, and concurrently the system X–ray flux dramatically increased, presumably due to the enhanced mass accretion from the disk. The Hα emission equivalent widths were the largest measured over the last few decades (Roche et al. 1993; Piccioni et al. 2000; Clark et al. 2001) and they indicated that the disk had grown significantly in size. The apparent increase in X–ray flux that accompanied the disk expansion confirms that the X-ray source is powered by gas from the Be star disk. However, Grundstrom et al. (2007) found that the largest Hα half-maximum emission radius of the circumstellar disk was still much smaller than the separation between the Be star and neutron star. Therefore they suggested that tidal forces at periastron may excite a two–armed spiral in the disk, and that mass transfer will occur predominantly after periastron as the gas in the arm extension is accreted by the neutron star. The observed phase of X–ray maximum, which occurs about one quarter of a period after periastron, is consistent with this picture.
2 Observations and data reduction
X Persei was observed by XMM–Newton for 31 ks on February 2nd, 2003. The three EPIC cameras, i.e. one pn (Strüder et al. 2001) and two MOS (Turner et al. 2001), were active and operated in Full Frame mode. This gave time resolutions of 73 ms and 2.6 s, respectively. For all of them, the Medium thickness filter was used. While in the case of the two MOS cameras the effective source exposure time is 31 ks, it is much lower ( 16 ks) for the pn camera, since it was affected by the ‘counting mode’ effect during the observation.
We used version 7.0 of the XMM–Newton Science Analysis System (SAS) to process the event files. After the standard pipeline processing, we looked for possible periods of high instrumental background, due to flares of soft protons with energies less than a few hundred keV. We found that the first 20 ks of the observation were affected by a high soft–proton contamination. However, since X Persei was detected with a very high count–rate (larger than 3 cts s-1 in each camera), much higher than that of the background, the soft–protons during the bad time intervals have a negligible effect on the source spectral and timing analysis (their count rate in the source extraction area is less than 0.1 cts s-1). Hence for our analysis we used the data of the whole observation.
3 Timing analysis
Due to the very high count rate, the data collected by the three EPIC cameras were highly affected by photon pile–up. For this reason, we had to exclude the central area of the source PSF and to consider only data in an annulus area.
For the MOS1 camera we selected an extraction corona with internal and external radius of 45 and 70′′, respectively; for the MOS2 camera the corresponding parameters are 40 and 70′′. In the case of the pn camera the source was imaged close to a CCD gap, therefore we were forced to select a very narrow corona, with internal and external radius of 30 and 35′′, respectively. We checked with the SAS task epatplot that, with these selections, no event pile–up affected our data, therefore we used them to accumulate the source light–curves. The background curves were accumulated on large circular areas with no sources and radius of 60′′, 40′′ and 45′′ for the MOS1 MOS2 and pn camera, respectively.
In Fig. 1 we report the total background–subtracted light curves in the 0.15–10 keV energy range. It shows that, during the XMM–Newton observation, there were significant flux changes of the source on a few hours time-scale. Variations up to 50 % around the average level of 10 cts s-1 are evident. Moreover, the source hardness–ratio (HR) between the energy bands above and below 2 keV varies up to 30 % around the average value of 1.45 and, over long time-scales, increases with the total count rate (Fig. 2).


To obtain a measure of the pulse period, we converted the arrival times to the solar system barycenter and performed a folding analysis using the source events of three cameras. In this way we derived a period of 839.3 0.3 s. In Fig. 3 we show the folded light curves in the three energy intervals 0.15–2, 2–10 and 0.15–10 keV, together with the folded HR between the hard and soft light curves. The pulse profile shows a main peak at phase 0–0.1, a secondary peak at phase 0.4 and a deep minimum at phase 0.5–0.6. The profile is energy dependent, because the main peak is at phase 0 and 0.1 in the high and low energy ranges, respectively. Moreover, below 2 keV it shows a plateau in the phase range 0.7–0.9, which has no counterpart above 2 keV. This energy dependence is confirmed by the HR profile, whose maximum is not aligned with the count–rate one. The same plot shows also that there is not a simple correlation between the hardness and the total count rate: we observe the same HR value at completely different count rate levels, but also very different HR values for the same count rate. This indicates that the spectral hardness of X Persei does not depend in a simple way on its flux level.

In order to go deeper in our investigation, we have considered also a finer energy division by dividing the hard energy range in the two sub–ranges 2–4 and 4–10 keV. In Fig. 4 we compare the folded soft and hard hardness ratios, i.e. the count–rates ratios in the energy bands (2–4)/(0.15–2) keV and (4–10)/(2–4) keV, respectively. In this way we can show that the minimum of the first ratio (and of the total light–curve) coincides with the maximum of the second one. This behaviour was already observed by Robba et al. (1996) with the data collected in 1990 by the GINGA satellite.

4 Spectral analysis
For the source and background spectra we considered the same extraction regions we used for the light curves. We accumulated all the events with pattern range 0–4 (i.e. mono– and bi–pixel events) and 0–12 (i.e. from 1 to 4 pixel events) for the pn and the two MOS cameras, respectively.
We generated ad hoc response matrices and ancillary files using the SAS tasks rmfgen and arfgen. In order to ensure the applicability of the statistics, all spectra were rebinned with a minimum of 30 counts per bin; they were fitted in the energy range 0.3–10 keV using XSPEC 11.3.2. All spectral uncertainties and upper–limits are given at 90 % confidence level for one interesting parameter.
After checking that separate fits of the three spectra gave consistent results, we fitted the spectra from the three cameras simultaneously in order to increase the count statistics and to reduce the uncertainties. The fit with an absorbed power–law yielded N cm-2 and photon index , but with large residuals and /d.o.f. = 2.172/2131. The addition of a black–body component improved the fit quality significantly (Fig. 5): we obtained N cm-2, and kT keV, with /d.o.f. = 1.052/2129. The emission surface of the thermal component has a radius R m (for d = 1 kpc). The unabsorbed flux in the energy range 0.3–10 keV is erg cm-2 s-1, about 39 % of which is due to the black–body component. Assuning a source distance of 1 kpc this flux implies an unabsorbed source luminosity erg s-1.
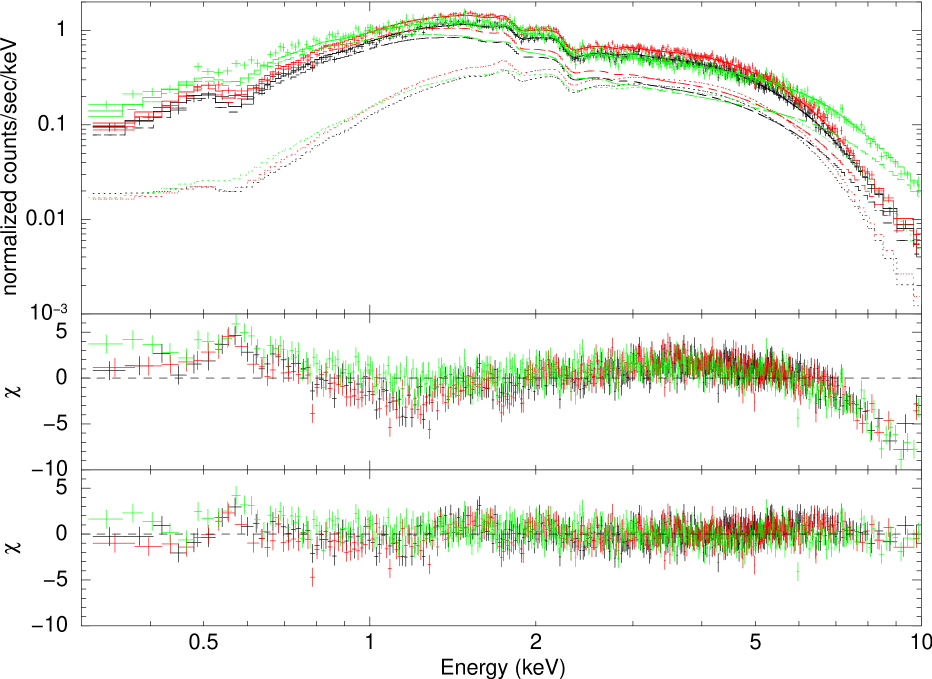
We also attempted to fit the spectra by replacing the black–body component with alternative emission models, such as mekal, thermal bremsstrahlung and broken power–law. In all these cases the results were worse than those obtained with the black–body model, since the reduced chi–squared was higher, the residuals were larger and/or the best–fit parameter values were unrealistic.
The spectra reported in Fig. 5 show that the best–fit model still leaves an emission feature at 0.5–0.6 keV. We could fit it with a gaussian component at E = 0.58 keV, which has an equivalent width of 97 eV. On the other hand, we found no narrow Iron Kα lines between 6 and 7 keV, with an upper limit on its equivalent width of 0.1 keV at most. The final best–fit parameters are reported in Tab. 1.
| Component | Parameter | Value |
| N | 3.42 | |
| 1.48 | ||
| Flux @ 1 keVb | 9.48 | |
| (keV) | 1.42 | |
| (m)c | 361 | |
| (keV) | 0.58 | |
| 2.13 | ||
| EQW (eV) | 97 | |
| d.o.f. | 2126 | |
| 1.021 |
a cm-2
b ph cm-2 s-1 keV-1
c for a source distance of 1 kpc
d ph cm-2 s-1
5 Phase–resolved spectroscopy
Due to the hardness–ratio variations observed along the pulse–period, we performed a phase–resolved spectroscopy in order to study in more detail the source behavior. To this aim, we analysed the background subtracted spectra in the three phase intervals defined in Fig. 4, i.e. 0.7–1.05 (phase A), 0.05–0.45 (phase B), and 0.45–0.7 (phase C).
The first step was to fit all of them with the best–fit power law plus blackbody model of the phase averaged spectrum, leaving only the relative normalization factors free to vary. In Fig. 6 we report the ratios of the three spectra of each instrument to these renormalized average models. They show significant residuals for the spectra of phases A and C, which are harder and softer than the medium one, respectively. They clearly demonstrate the spectral variability as a function of the pulse phase.
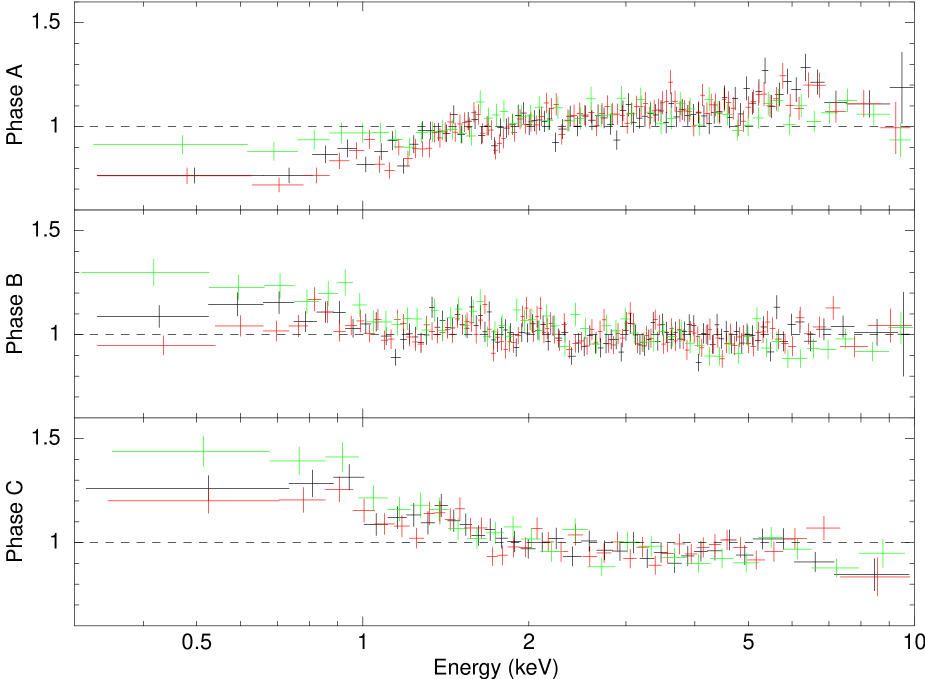
We then fitted the three spectra independently. In all cases, the absorbed power–law model was not satisfactory, while the addition of a black–body component significantly improved the fit. Therefore we used this model for all the spectra, leaving all the parameters free to vary: the results are reported in Table 2. They show that the absorbing column density is almost costant along the phase–pulse, as expected if it is due to the interstellar extinction. Moreover, both the power–law and the black–body components do not change significantly between phases A and B, neither in shape nor in intensity. Instead there is a relevant variation in phase C, as the power–law component steepens, the black–body temperature increases and the total luminosity reduces.
For completeness, we also looked for the presence, in the individual spectra, of the emission gaussian component at 0.58 keV which was found in the phase–averaged spectrum. We found that this line is well defined in the spectra of phases B and C, with an equivalent width of 105 and 75 eV, respectively; on the other hand, it is not well constrained in phase A.
| Spectral | Phase Interval | ||
|---|---|---|---|
| Parameter | A | B | C |
| NH | |||
| kTBB | |||
| RBB | 425 | 433 | 264 |
| 1.46 | 1.49 | 0.82 | |
| 0.83 | 0.97 | 0.49 | |
| (57 %) | (65 %) | (60 %) | |
| 0.63 | 0.52 | 0.33 | |
| (43 %) | (35 %) | (40 %) | |
| /d.o.f. | 1.028/1465 | 1.032/1550 | 0.990/964 |
a Unabsorbed flux in the energy range 0.3–10 keV, in units of erg cm-2 s-1
In order to investigate the relative variations of the two components with the period phase, we also simultaneously fitted the three spectra forcing common values for NH, and kTBB. In this case we obtained N cm-2, and kT keV, with /d.o.f. = 1.105/3989; the corresponding normalization values are reported in Table 3. In this interpretation the spectral changes as a function of the phase are reproduced by the variations in the relative contribution of the two components. From this point of view, the power–law component provides the same flux during phases A and C, while it has a maximum during phase B. On the other hand, the contribution of the black–body component progressively decreases from phase A to phase C.
| Spectral | Phase Interval | ||
|---|---|---|---|
| Parameter | A | B | C |
| I | |||
| R | |||
| 1.43 | 1.50 | 0.84 | |
| 0.65 | 0.96 | 0.62 | |
| (46 %) | (64 %) | (74 %) | |
| 0.78 | 0.54 | 0.22 | |
| (54 %) | (36 %) | (26 %) | |
a Intensity of the power–law component in units of ph cm-2 s-1 keV-1 at 1 keV
b Radius of the blackbody component (in metres) for a source distance of 1 kpc.
c Unabsorbed flux in the energy range 0.3–10 keV, in units of erg cm-2 s-1
In order to confirm that the thermal component varies as a function of the rotational phase, we should prove that a constant black–body component is rejected by the data. To this aim, we modified the test model by imposing a common value of both kTBB and RBB for the three spectra, while both and IPL could vary within them. The resulting best–fit has N cm-2, kT keV and RBB = m, while the power–law parameters are shown in Tab. 4. Also in this case the fit quality is very good (/d.o.f. = 1.135/3989), comparable to the one obtained in the previous case. Moreover, in this case we find that during phase C most (i.e. 60 %) of the total unabsorbed flux is due to the thermal component.
| Spectral | Phase Interval | ||
|---|---|---|---|
| Parameter | A | B | C |
| I | |||
| 1.51 | 1.51 | 0.85 | |
| 1.00 | 1.00 | 0.34 | |
| (66 %) | (66 %) | (40 %) | |
| 0.51 | 0.51 | 0.51 | |
| (34 %) | (34 %) | (60 %) | |
a Intensity of the power–law component in units of ph cm-2 s-1 keV-1 at 1 keV
b Unabsorbed flux in the energy range 0.3–10 keV, in units of erg cm-2 s-1
The above results are summarized in Fig. 7, where we show the pulse–phase dependence of the black–body temperature, the power–law photon index and the unabsorbed flux of the two components for both fits. Since they have a similar statistical quality, we can neither confirm nor deny that the thermal component is variable.


6 Discussion
In Fig. 8 we report the long term evolution of X Persei luminosity and spin period since the time of the first observations. The flux measured by XMM–Newton corresponds to erg s-1, which is the highest level of luminosity after the end of the outburst in 1975. This result is confirmed also by the RossiXTE/ASM data, which are reported for comparison: they clearly indicates that the XMM–Newton observation was performed just at a luminosity peak of the source, which was preceded by a steep increase and followed by a sharp decrease. This luminosity increase should imply a corresponding increase in the accretion rate and, in the case of matter transfer to the NS via an accretion disk, a larger momentum transfer to the neutron star, therefore we would expect to observe a pulsar spin–up. This is not confirmed by the measured pulse period, which is greatest than in all the previous observations. The pulse period evolution shows that the pulsar spin–down has proceeded also during the latest years, in spite of the luminosity increase. This is an independent evidence that the matter is transfered from the Be companion to the NS without forming an accretion disk.


The analysis of the pulse profile between 0.15 and 10 keV shows that, contrary to previous findings (e.g.: Robba et al. 1996; di Salvo et al. 1998; Coburn et al. 2001), at all energies the pulse shape is far from being sinusoidal. It has a rich structure, with a main and a secondary peak, and varies with the energy. As a consequence, the peak of the hardness ratio between the count rates above and below 2 keV is not aligned with the maximum of the total count rate. It is possible that this change in the pulse profile is due to the source luminosity level, which was higher than in all the previous detections. The analysis of the source status around the pulse minimum provided another interesting result: in this phase interval also the hardness–ratio (2-4)/(0.15-2) reaches its minimum value, while the hardness–ratio (4-10)/(2-4) has a narrow peak. This behaviour was already observed by Robba et al. (1996) and Coburn et al. (2001) on Ginga and RossiXTE data, respectively, at lower luminosity levels (i.e. 2–5 erg s-1) and indicates a complex spectral evolution.
From the spectral point–of–view, we estimated a hydrogen column density NH = (3.42) cm-2, which is more than twice the value of cm-2 measured by Di Salvo et al. (1998) on BeppoSAX data. However, we checked that this difference is due to the different fit model they used (i.e. a high–energy cut–off power–law). For reference, we note that optical observations give E(B-V) = 0.395 (Telting et al. 1998); assuming AV = 3.1 E(B-V) and the average relation AV = N cm-2 between optical extinction and X–ray absorption (Predehl & Schmitt 1995), this would predict N cm-2.
It is interesting to compare our spectral results with those obtained by Coburn et al. (2001) on RossiXTE data, since they fit the source spectrum with a two component model equal to our model. They estimated a steeper power–law component ( = 1.83 0.03 instead of 1.48 0.02), while the black–body component had a comparable temperature (kT = 1.45 0.02 keV instead of 1.42 keV). However, in our case the black–body radius is much larger (361 m instead of 130 m): this is not surprising, since during the XMM–Newton observation X Persei was about 5 times more luminous than during the RossiXTE observation. In fact, in spite of this luminosity difference, also in the case of the RossiXTE observation 60 % of the total flux was due to the power–law component.
As in previous observations of X Persei, we found no evidence of an Fe–K line in the source spectrum. We estimated a 90 % confidence upper limit on the equivalent width of almost 0.1 keV, i.e. an order of magnitude larger than in other works. On the other hand, we found a clue of an emission line at 0.58 keV, which was never found before. It is rather weak (EQW = 97 eV) and was not detected in all the pulse–phases, therefore its analysis requires further investigations.
Also Coburn et al. (2001) performed a phase–resolved spectroscopy, even if with a different selection of the phase–intervals. Contrary to our findings, in their case both the power–law photon–index and the black–body temperature are almost constant along the pulse profile, and only the component normalizations change significantly. However, these results were obtained with a much lower count statistics and at a luminosity level about 5 times lower than in our case; furthermore, a fixed, common value of the hydrogen column density was forced to the different spectral phases and only data above 3 keV were considered.
The results we have obtained for X Persei are in agreement with what has been observed in other two Be/NS binaries with long pulse period, i.e. in the low luminosity system RX J0146.9+6121 (La Palombara & Mereghetti 2006) and during the low–luminous quiescent state of the transient source 3A 0535+262 (Orlandini et al. 2004; Mukherjee & Paul 2005). Also in these cases a thermal excess was detected above the main power–law: it has been modeled as a black–body with kT 1 keV and R 1 km, which contributes 30 % of the total source luminosity. From this point of view, this class of low luminosity, long period Be/NS binaries is significantly different from the standard high–luminosity X–ray pulsars, whose thermal component is usually characterized by temperatures of 0.1 keV and radius of a few hundred km (see La Palombara & Mereghetti 2006 for a review).
Hickox et al. (2004) showed that, in the low luminousity binary pulsars ( erg s-1), the thermal component can be due to either emission by photo–ionized or collisionally heated diffuse gas or thermal emission from the surface of the neutron star. Based on our results, the first option can be rejected, since we cannot reconcile it with the observed black–body spectrum. We therefore favor the interpretation of the soft excess in X Persei as thermal emission from the neutron star polar cap. If we assume that the source is in the ‘accretor’ status, with matter accretion on the NS surface, the black–body emitting radius of 360 m is consistent with the expected size of the polar cap. In fact, if MNS = 1.4 M⊙ and RNS = cm, the source luminosity of erg s-1 implies an accretion rate g s-1 and, adopting B G, a magnetospheric radius R cm (Campana et al. 1998). In this case, based on the relation R RNS (RNS/Rm)0.5 (Hickox et al. 2004), we would obtain R 345 m, i.e. a value in good agreement with the estimated black–body emitting radius.
Based on the above result, it makes sense to attribute the observed thermal component to the emission from the NS polar caps, as in the case of RX J0146.9+6121 and 3A 0535+262. If this description is correct, we would expect to observe some variability of the soft component along the pulse phase. From this point of view the phase–resolved spectroscopy provides no conclusive results, since it proves that both a variable and a constant thermal component can account for the observed spectral variability.
7 Conclusions
Analyzing a 31 ks long XMM–Newton archival observation of the Be/NS binary system X Persei, we found that the source was detected at a luminosity level of erg s-1, which is the highest value ever reported since the large outburst that occured on 1975. This result was independently confirmed by the RossiXTE/ASM data, which has been monitoring the source during the latest decade.
The timing analysis confirmed the pulsar spin–down already detected in the previous observations. Moreover, it shows that the pulse profile has a complex structure and is energy dependent.
From the spectral point–of–view, thanks to the high effective area of XMM–Newton over a wide energy band, we could perform an accurate analysis also at low energies. In this way, we detected a data excess above the main power–law component, which contributes for 40 % to the total source luminosity. Based on its black–body spectrum, with an emission radius of 360 m, this component could be attributed to a polar–cap emission. It is interesting to note that the same hypothesis has been advanced also to describe the spectra of other two low–luminosity and long–period Be/NS pulsars, i.e. RX J0146.9+6121 and 3A 0535+262 (during its quiescent state).
We found no evidence of a narrow Iron Kα line between 6 and 7 keV; on the other hand, our data suggest the presence of an emission feature at 0.58 keV, whose description and nature require further investigations.
The phase–resolved spectroscopy shows a large spectral variability along the pulse period, which can be modeled with both a variable and a constant thermal component. This result supports but does not confirm the polar–cap origin of this emission, therefore further studies will be necessary in the future in order to solve this issue.
Acknowledgements.
This work is based on observations obtained with XMM–Newton, an ESA science mission with instruments and contributions directly funded by ESA Member States and NASA. The XMM–Newton data analysis is supported by the Italian Space Agency (ASI), through contract ASI/INAF I/023/05/0.References
- Bildsten et al. (1997) Bildsten, L., Chakrabarty, D., Chiu, J., et al. 1997, ApJS, 113, 367
- Braes & Miley (1972) Braes, L. L. E. & Miley, G. K. 1972, Nature, 235, 273
- Brucato & Kristian (1972) Brucato, R. J. & Kristian, J. 1972, ApJ, 173, L105
- Campana et al. (1998) Campana, S., Colpi, M., Mereghetti, S., Stella, L., & Tavani, M. 1998, A&A Rev., 8, 279
- Clark et al. (2001) Clark, J. S., Tarasov, A. E., Okazaki, A. T., Roche, P., & Lyuty, V. M. 2001, A&A, 380, 615
- Coburn et al. (2001) Coburn, W., Heindl, W. A., Gruber, D. E., et al. 2001, ApJ, 552, 738
- Delgado-Martí et al. (2001) Delgado-Martí, H., Levine, A. M., Pfahl, E., & Rappaport, S. A. 2001, ApJ, 546, 455
- di Salvo et al. (1998) di Salvo, T., Burderi, L., Robba, N. R., & Guainazzi, M. 1998, ApJ, 509, 897
- Fabregat et al. (1992) Fabregat, J., Reglero, V., Coe, M. J., et al. 1992, A&A, 259, 522
- Grundstrom et al. (2007) Grundstrom, E. D., Boyajian, T. S., Finch, C., et al. 2007, ApJ, 660, 1398
- Haberl et al. (1998) Haberl, F., Angelini, L., Motch, C., & White, N. E. 1998, A&A, 330, 189
- Hickox et al. (2004) Hickox, R. C., Narayan, R., & Kallman, T. R. 2004, ApJ, 614, 881
- Ikhsanov (2007) Ikhsanov, N. R. 2007, MNRAS, 375, 698
- La Palombara & Mereghetti (2006) La Palombara, N. & Mereghetti, S. 2006, A&A, 455, 283
- Liu & Hang (2001) Liu, Q.-Z. & Hang, H.-R. 2001, Ap&SS, 275, 401
- Lyubimkov et al. (1997) Lyubimkov, L. S., Rostopchin, S. I., Roche, P., & Tarasov, A. E. 1997, MNRAS, 286, 549
- Margon et al. (1977) Margon, B., Thorstensen, J. R., Bowyer, S., et al. 1977, ApJ, 218, 504
- Mook et al. (1974) Mook, D. E., Boley, F. I., Foltz, C. B., & Westpfahl, D. 1974, PASP, 86, 894
- Mukherjee & Paul (2005) Mukherjee, U. & Paul, B. 2005, A&A, 431, 667
- Norton et al. (1991) Norton, A. J., Coe, M. J., Estela, A., et al. 1991, MNRAS, 253, 579
- Orlandini et al. (2004) Orlandini, M., Bartolini, C., Campana, S., et al. 2004, Nuclear Physics B Proceedings Supplements, 132, 476
- Pfahl et al. (2002) Pfahl, E., Rappaport, S., Podsiadlowski, P., & Spruit, H. 2002, ApJ, 574, 364
- Piccioni et al. (2000) Piccioni, A., Bartolini, C., Bernabei, S., et al. 2000, in Astronomical Society of the Pacific Conference Series, Vol. 214, IAU Colloq. 175: The Be Phenomenon in Early-Type Stars, ed. M. A. Smith, H. F. Henrichs, & J. Fabregat, 585
- Predehl & Schmitt (1995) Predehl, P. & Schmitt, J. H. M. M. 1995, A&A, 293, 889
- Reynolds et al. (1992) Reynolds, A. P., Hilditch, R. W., Bell, S. A., Pollacco, D. L., & Edwin, R. P. 1992, MNRAS, 258, 439
- Robba et al. (1996) Robba, N. R., Burderi, L., Wynn, G. A., Warwick, R. S., & Murakami, T. 1996, ApJ, 472, 341
- Roche et al. (1993) Roche, P., Coe, M. J., Fabregat, J., et al. 1993, A&A, 270, 122
- Roche et al. (1997) Roche, P., Larionov, V., Tarasov, A. E., et al. 1997, A&A, 322, 139
- Slettebak (1982) Slettebak, A. 1982, ApJS, 50, 55
- Strüder et al. (2001) Strüder, L., Briel, U., Dennerl, K., et al. 2001, A&A, 365, L18
- Telting et al. (1998) Telting, J. H., Waters, L. B. F. M., Roche, P., et al. 1998, MNRAS, 296, 785
- Torra et al. (2000) Torra, J., Fernández, D., & Figueras, F. 2000, A&A, 359, 82
- Turner et al. (2001) Turner, M. J. L., Abbey, A., Arnaud, M., et al. 2001, A&A, 365, L27
- van den Bergh (1972) van den Bergh, S. 1972, Nature, 235, 273
- van den Heuvel & van Paradijs (1997) van den Heuvel, E. P. J. & van Paradijs, J. 1997, ApJ, 483, 399
- Weisskopf et al. (1984) Weisskopf, M. C., Elsner, R. F., Darbro, W., et al. 1984, ApJ, 278, 711
- White et al. (1977) White, N. E., Mason, K. O., & Sanford, P. W. 1977, Nature, 267, 229
- White et al. (1976) White, N. E., Mason, K. O., Sanford, P. W., & Murdin, P. 1976, MNRAS, 176, 201
- White et al. (1983) White, N. E., Swank, J. H., & Holt, S. S. 1983, ApJ, 270, 711