Carbonates in space –
The challenge of low temperature data111Based on observations
with ISO, an ESA project with instruments funded
by ESA Member States (especially the PI countries: France,
Germany, the Netherlands and the United Kingdom) and with the
participation of ISAS and NASA.
Abstract
Carbonates have repeatedly been discussed as possible carriers of stardust emission bands. However, the band assignments proposed so far were mainly based on room temperature powder transmission spectra of the respective minerals. Since very cold calcite grains have been claimed to be present in protostars and in Planetary Nebulae such as NGC 6302, the changes of their dielectric functions at low temperatures are relevant from an astronomical point of view.
We have derived the IR optical constants of calcite and dolomite from reflectance spectra – measured at 300, 200, 100 and 10 K – and calculated small particle spectra for different grain shapes, with the following results: i) The absorption efficiency factors both of calcite and dolomite are extremely dependent on the particle shapes. This is due to the high peak values of the optical constants of CaCO3 and CaMg[CO3]2. ii) The far infrared properties of calcite and dolomite depend also very significantly on the temperature. Below 200 K, a pronounced sharpening and increase in the band strengths of the FIR resonances occurs. iii) In view of the intrinsic strength and sharpening of the 44 m band of calcite at 200–100 K, the absence of this band – inferred from Infrared Space Observatory data – in PNe requires dust temperatures below 45 K. iv) Calcite grains at such low temperatures can account for the ‘92’ m band, while our data rule out dolomite as the carrier of the 60–65 m band.
The optical constants here presented are publicly available in the electronic database http://www.astro.uni-jena.de/Laboratory/OCDB.
1 Introduction
In the 1970s, carbonates have been proposed as carriers of mid- infrared features detected in astronomical spectra, such as the 11.3 m emission band seen in NGC 7027 and in the ’Red Rectangle’ (Gillet, Forrest & Merrill 1973; Bregman & Rank 1975; Bregman (1977)).
In parallel to that, reflectance spectra of calcite (CaCO3) and magnesite (MgCO3) have been measured in the laboratory. Hellwege et al. (1970) did the measurements in the whole mid- and far-IR range for calcite, magnesite and dolomite (CaMg[CO3]2)), while Penman (1976) examined calcite and magnesite in the 5–50 m region. All these measurements have been carried out at room temperature.
Carbonate grains have been found in interplanetary dust particles (IDPs). Sandford (1986) and Tomeoka & Buseck (1986) reported the identification of carbonate minerals in IDPs both by a chemical dissolution experiment and by transmission electron microscopy. As shown by Tomeoka & Buseck (1986), the mineralogy of the IDP carbonates is essentially that of breunnerite – an Mg-rich solid solution of magnesite and siderite (FeCO3). Solid solutions of Ca- and Mg-carbonates are rare in the IDPs examined so far (see also Joswiak & Brownlee (2001)). It is noteworthy that the IDPs show a 6.8 m absorption feature which is probably due to the stretching vibration of carbonate anions (Sandford 1986). It has to be noted however, that there are doubts on this identification because the carbonate band at 11.4 m was not detected in a study on five IDPs (Quirico et al. 2000). A band similar to the 6.8 m feature is supposedly seen in the spectra of the “Deep Impact” ejecta from comet 9P/Tempel 1 measured with the Spitzer IRS spectrometer (Lisse et al. 2006). In these spectra, also bands at 11-12 and 13-14 m have been assigned to carbonates.
While the identification of the 11.3 m band with carbonates (Bregman (1977)) has been confuted by McCarthy, Forrest & Houck (1978) and subsequently been replaced by an identification with hydrocarbons (Cohen et al. (1986)), there has been continuous and recently even increased interest in carbonates as stardust and planetary dust components. Carbonate bands at wavelengths larger than 25 m came to the fore: Erard et al. (2000) and Lellouch, Encrenaz & de Graauw (2000) suggested calcite and siderite (FeCO3) as carriers of aerosol absorption bands of the Martian atmosphere inter alia at 26.5, 30–31 and 43.5 m.
Kemper et al. (2002a) and Kemper et al. (2002b), by a careful analysis of the 2.4–200 m data of the Planetary Nebula NGC 6302 taken with the Infrared Space Observatory (ISO), were able to show that the previously unidentified ‘92’ m emission band and the 62 m component of the 60 m emission complex in this nebula can possibly be attributed to calcite and dolomite, respectively. According to their model fit, the carbonates belong to the cold (30–60 K) dust component of this nebula.
Chiavassa et al. (2005) studied the 60–180 m ISO spectra of more than 30 protostars and detected a solid state feature peaking between 90 and 110 m in 17 of these spectra. Again, calcite has been suggested as the feature carrier, even though the accompanying characteristic resonance features of calcite could not be detected in the respective sources for different reasons (partly related to the sensitivity of ISO’s detectors). For two star forming regions – the Carina Nebula and Sharpless 171 – this band had already been discovered by Onaka & Okada (2003) but had been ascribed to onion structured carbon grains. The variation in the band position has been explained by Chiavassa et al. by varying amounts of other than calcium ions (e.g. Mg or Fe ions) in the carbonatic carrier.
The astronomical observations summarized so far indicate a need for more detailed investigations in two respects: (a) measurement of IR properties below 0 K and (b) investigation of variations in the band profiles due to particle shape and size effects. Both is best achieved on the basis of determining optical constants for low temperatures. Furthermore, this approach makes it possible to get rid of the possible influence of the matrix effect which may have influenced part of the previous comparisons between laboratory and observational data on carbonates.
Given that it is unclear how carbonates can form in a circumstellar environment, Ferrarotti & Gail (2005) examined the formation of calcium carbonate in an oxygen-rich stellar wind (C/O 1) by thermodynamic calculations, assuming the formation of calcite from Ca, H2O and CO. They came to the conclusion that calcite – if at all – would rather form in Asymptotic Giant Branch (AGB) stars with low mass loss rates (approximately 1 10-6 M⊙/y) than in AGB stars in their superwind phase (of which planetary nebulae like NGC 6302 are the remnants however). But also in low-mass-loss-rate AGB stars, less than 1% of the total amount of dust would be carbonate dust. According to Ferrarotti & Gail (2005), it is mainly the relatively low condensation temperature of carbonates which makes their condensation in circumstellar environments so inefficient: for this temperature range to be reached in an expanding circumstellar shell, the dust must have a substantially larger distance from the central star (and, accordingly, a substantially reduced material density) than for the silicates.
Toppani et al. (2005), however, suggest a possibly (more) efficient formation mechanism of carbonates in the Post-AGB phase of stellar evolution. Based on laboratory experiments, they predict carbonate formation by reactions between a comparatively hot silicate gas and a 300-500 K H2O-CO2-rich gas under conditions far from local thermal equilibrium (LTE). They assume this non-LTE carbonate formation to take place when high-velocity winds of forming PNe interact with dense remnants of the slow-wind-AGB phase.
A major goal of our study is to contribute to an assessment of the validity of the ‘carbonate hypotheses’ from the spectroscopic point of view.
The structure of the present paper is the following. In §2, we describe the derivation of optical constants of CaCO3 and CaMg[CO3]2 from reflectance measurements, both for room temperature and for cryogenic temperatures. In §3, absorption efficiency spectra of small calcite and dolomite grains are presented. Finally, in §4, we compare these small particle spectra with infrared bands of astronomical objects which have been attributed to carbonates in recent studies. For the case of calcite, we present new constraints on the particle shapes and temperatures which are necessary to reconcile the ‘92’ m band assignments by Kemper et al. (2002a) and Chiavassa et al. (2005) with currently available laboratory data.
2 Reflectance spectroscopy and derivation of the optical constants
2.1 Crystallographic properties and sample preparation
Calcite and dolomite both belong to the trigonal crystal class; hence, they are both uniaxial, and polarized reflectance measurements are required to determine their optical constants.222Interestingly, the phenomenon of birefringence has been first observed in calcite crystals. The space group of calcite is Rc, while dolomite belongs to the space group R and has a reduced symmetry compared to its chemically simpler relative. While the calcium ions occupy crystallographically equivalent sites in CaCO3, half of the places occupied by Ca ions in calcite are occupied by Mg ions in dolomite. The reduced symmetry of dolomite compared to calcite leads to the occurrence of an additional IR band (which is located close to 33 m) in its spectrum. For more details on the lattice structure of Mg and Ca carbonates, see Hellwege et al. (1970) and references therein (e.g. Wyckhoff (1964)).
In order to perform polarized reflectance spectroscopy, planes containing the respective crystal’s c-axes need to be found or to be produced. This is a difficult task in the case of ordinary CaCO3 or CaMg[CO3]2 rhombohedra, since none of their surfaces fulfill this condition. The c-axis runs diagonally through the obtuse corners of cleaved rhombohedra.
In the case of our dolomite rhombohedron – a 222 cm3 crystal from Eugui, Navarra, Spain –, it was therefore necessary to cut it in order to produce a c-parallel surface, which has been polished subsequently. Polarized reflectance measurements on the polished surfaces showed no ‘mixing’ of the ordinary and extraordinary ray, which proved the cut to be parallel to the c-axis indeed. In the case of our calcite crystal – a 421 cm3 fragment of a prism found at Sweetwater, Missouri, USA – no cut was necessary because this individual crystal had a relatively rare stature, its long edges being grown parallel to the symmetry axis. Hence, polishing one of the lateral surfaces of this crystal was sufficient to obtain a large measuring spot containing the c-axis. Indeed, polarized spectroscopy on that spot did not show significant traces of mixing of the two principal orientations of the electric field vector relative to c (Ec, Ec; see also below, Fig. 1).
2.2 Reflectance spectroscopy
The reflectance spectra of our two samples have been measured at near-normal incidence using an FTIR spectrometer Bruker 113v in the wavelength range 2–120 m at a resolution of 2 cm-1. Gold mirrors have been used as references. A turnable grid polarizer on polyethylene substrate positioned at the entrance of the sample compartment was used to select polarization directions parallel and normal to the plane of incidence.

Fig. 1 shows reflectance spectra of calcite in the 5–120 m range which comprises all IR bands of this mineral. In the case of the reflectance for the ordinary ray (Ec), an offset of 1.0 has been added to all reflectance values. The different linestyles correspond to the different temperatures (10–300 K) as indicated.
For the ordinary ray, five reflection bands can be discerned in the infrared spectrum of calcite, which are centered at 6.8, 14.0, 30.7, 44.0 and 91.4 m for room temperature. For the extraordinary ray, the respective reflectance band positions amount to 11.4, 29.6 and 91.4 m (again for room temperature).

In Fig. 2, the reflectance spectra of dolomite are plotted on the same scale as for calcite. Dolomite has a slightly more complex band pattern than calcite, which is a consequence of its comparatively reduced lattice symmetry mentioned above. The reflectance maxima are located at 6.6, 13.8, 25.5, 38.4 and 61.7 m for the ordinary ray (at T = 300 K), while for the extraordinary ray, the respective positions are 11.3, 25.4, 31.6, 56.7 and 60.0 m.
For the cryogenic measurements, the experimental setup was the following: the samples have been placed into a continuous-flow liquid-helium cryostat with contact-gas cooling (CryoVac KONTI Spectro B) equipped with polyethylene windows. It was inserted into the FTIR spectrometer’s sample compartment at the same position where the room temperature reflection measurements had been performed. The cryostat windows did not allow measurements at wavelengths shorter than 15 m. The cryostat possesses two sample mounts which can alternatingly be moved into the infrared beam, thus allowing subsequent measurements on the sample and the reference mirror at each temperature. A third measurement with the sample being tilted to suppress the reflection was necessary (again at each temperature) in order to determine the reflectivity of the cryostat windows (“zero signal”), which had to be subtracted from both the sample and the reference spectra. The temperature was controlled by means of a CryoVac temperature controller using an ohmic heater and two silicon diode temperature sensors connected to the liquid-helium cooled walls of the contact gas chamber and to the sample mount, respectively. The temperatures have been stable to about 0.5 K during the measurements.
Spectra have been taken at 200 K, 100 K, and 10 K during cooling down the samples. Two cooling cycles have been carried out for each sample with the two polarizer orientations. The wavelength- and temperature-dependent reflectances have been calculated by dividing the “zero-corrected” sample and reference spectra at each temperature.
It is found that both for dolomite and calcite all bands in the above indicated wavelength range undergo a shift to shorter wavelengths, a bandwidth decrease and band strength increase with decreasing temperatures. These effects are especially significant for calcite’s 44 m reflectance band and for dolomite’s 38 m reflectance band. A more detailed discussion is given in §3.
2.3 Lorentz oscillator fits and derived optical constants
The polarized reflectance spectra of calcite and dolomite can be quite accurately reproduced by Lorentz oscillator fits, as has been shown, e.g., by Hellwege et al. (1970). Using the ansatz
| (1) |
where is the dielectric constant for frequencies large compared to all infrared wavelengths, is the strength, TOj the transverse optical phonon frequency, the damping constant of the -th oscillator, respectively.


Figure 3 shows the optical constants of calcite which have been derived from the polarized reflectance spectra by means of Lorentz oscillator fits. The oscillator parameters which were used for these fits – five oscillators for the ordinary ray and three for the extraordinary ray – are listed in Tab. 1.
For dolomite, we only list its oscillator parameters – six oscillators for the ordinary ray and five for the extraordinary ray (see Tab. 2) –, while the optical constants are not shown. However, both for calcite and dolomite, the optical constants can be retrieved from the electronic database http://www.astro.uni-jena.de/Laboratory/OCDB , which also includes graphs.
Apart from the different number of oscillators, another important difference between calcite’s and dolomite’s IR spectra is the absence of any phonon band for the latter at wavelengths larger than 67 m (or wavenumbers smaller than 150 cm-1). In other words, it is noteworthy that calcite’s IR bands extend to wavelengths roughly 1.5 times larger than dolomite’s ‘reddest’ band.
For 300 K, our oscillator parameters are well comparable with those derived by Hellwege et al. (1970) except for some minor bands which are missing in their measurements (e.g. our ‘4ER’ for dolomite), probably due to a somewhat too small spectral resolution.
| TOj | |||
| 1OR | 1407.4 | 1039.6 | 14.8 |
| 2OR | 712.0 | 71.4 | 4.0 |
| 3OR,300K | 297.0 | 377.7 | 15.7 |
| 3OR,200K | 302.5 | 385.4 | 12.0 |
| 3OR,100K | 306.0 | 387.0 | 8.87 |
| 3OR,10K | 307.1 | 387.6 | 7.34 |
| 4OR,300K | 222.8 | 206.1 | 11.0 |
| 4OR,200K | 226.5 | 211.2 | 8.35 |
| 4OR,100K | 228.8 | 219.1 | 6.14 |
| 4OR,10K | 229.7 | 219.7 | 4.54 |
| 5OR,300K | 104.7 | 148.1 | 6.00 |
| 5OR,200K | 103.2 | 165.7 | 5.35 |
| 5OR,100K | 103.8 | 158.0 | 3.57 |
| 5OR,10K | 104.2 | 167.6 | 2.45 |
| 1ER | 872.0 | 250.8 | 2.09 |
| 2ER,300K | 306.7 | 368.0 | 16.9 |
| 2ER,200K | 312.6 | 372.2 | 11.6 |
| 2ER,100K | 317.6 | 377.6 | 9.19 |
| 2ER,10K | 318.9 | 378.7 | 7.30 |
| 3ER,300K | 94.3 | 200.6 | 7.10 |
| 3ER,200K | 93.3 | 203.2 | 5.91 |
| 3ER,100K | 94.6 | 203.6 | 4.37 |
| 3ER,10K | 95.0 | 202.4 | 2.86 |
| TOj | |||
| 1OR | 1453.8 | 399.2 | 23.8 |
| 2OR | 1425.5 | 980.0 | 15.0 |
| 3OR | 727.3 | 98.8 | 6.14 |
| 4OR,300K | 348.7 | 459.0 | 22.1 |
| 4OR,200K | 351.5 | 462.5 | 16.0 |
| 4OR,100K | 356.0 | 464.4 | 12.0 |
| 4OR,10K | 355.9 | 464.5 | 11.9 |
| 5OR,300K | 259.1 | 190.6 | 9.86 |
| 5OR,200K | 261.1 | 201.9 | 7.97 |
| 5OR,100K | 263.4 | 201.5 | 5.58 |
| 5OR,10K | 263.4 | 201.4 | 5.54 |
| 6OR,300K | 152.9 | 209.1 | 5.18 |
| 6OR,200K | 152.9 | 214.2 | 3.42 |
| 6OR,100K | 153.5 | 214.9 | 2.26 |
| 6OR,10K | 153.5 | 214.7 | 2.20 |
| 1ER | 874.9 | 301.0 | 2.98 |
| 2ER,300K | 364.8 | 335.8 | 20.4 |
| 2ER,200K | 368.5 | 341.8 | 16.3 |
| 2ER,100K | 370.7 | 349.8 | 12.7 |
| 2ER,10K | 371.5 | 356.4 | 11.9 |
| 3ER,300K | 316.8 | 179.5 | 9.13 |
| 3ER,200K | 319.4 | 175.6 | 8.24 |
| 3ER,100K | 321.3 | 168.1 | 6.05 |
| 3ER,10K | 321.6 | 178.0 | 5.05 |
| 4ER,300K | 171.9 | 30.5 | 8.76 |
| 4ER,200K | 174.0 | 29.2 | 6.42 |
| 4ER,100K | 174.4 | 31.1 | 5.56 |
| 4ER,10K | 174.8 | 34.4 | 4.97 |
| 5ER,300K | 150.3 | 243.2 | 3.35 |
| 5ER,200K | 151.2 | 247.5 | 3.29 |
| 5ER,100K | 151.4 | 249.8 | 2.31 |
| 5ER,10K | 152.2 | 260.4 | 2.17 |
3 Small particle spectra for different shape distributions
From the optical constants shown and discussed in the previous section, the absorption cross sections per particle volume – Cabs/V – have been calculated for grains of different shapes. Since the focus of this paper is on bands at large wavelengths, we choose the limit of particles being small compared to the wavelength (Rayleigh limit, size parameter x=2a/ 1 and x 1, being the grain radius or largest semidiameter).
The following grain shapes have been taken into account: spheres (according to Mie theory) and continuous distributions of ellipsoids (CDEs). As for the latter, two different modifications of it have been used: a CDE with equal probability for all ellipsoid axis ratios (‘mean CDE’, after Bohren & Huffman (1983)) and a CDE with maximum probability for spherical grains (‘weighted CDE’, after Ossenkopf, Henning & Mathis (1992)).
3.1 Temperature effects for spherical grains
Figures 4 and 5 show the volume normalized absorption cross sections Cabs/V calculated for spherical calcite and dolomite grains, respectively, depending on temperature. The figures demonstrate that the effect of the cooling on the band positions and band widths is present also in the small particle spectra. Similarly to the reflectance spectra, this effect is especially pronounced for the case of the 40 m band of calcite, which shifts from 42.6 m for 300 K to 41.4 m for 10 K, while at the same time, the Cabs/V peak value increases by a factor of 2.4. For the calcite bands around 30 and 80 m, the temperature dependence is not equally strong, but still significant.
In the case of CaMg[CO3]2, the temperature-dependent evolution of the spectra is similar apart from the effect that there is only an insignificant change between 100 K and 10 K (cf. Fig. 5). For the additional band in the dolomite spectrum (compared to calcite) around 31 m, the temperature dependence is rather moderate compared to the other bands. In the wavelength range 15 m, the dolomite and the calcite spectra resemble each other very closely.


3.2 Grain shape effects at low temperatures
Due to the high oscillator strengths characterizing most of the infrared bands of both calcite and dolomite, the grain shape dependence of the band profiles is very strong. For the FIR bands of calcite, this is evident from the comparison of Fig. 4 with Fig. 6 as well as from the peak wavelengths given in Tab. 3. Calcite’s 30 m band is shifted to the ‘red’ by about 2 m for a mean CDE compared to the case of spherical grains, and at the same time its width is increased by factor of four. The 80-90 m double-band of calcite degenerates into a broad single bump centered at 90.1 m with two wings for the mean CDE. For the weighted CDE case, the maximum of the absorption efficiency is located at 86.3 m for a grain temperature of 300 K. For the 40 m band, the broadening due to the shape distribution is not equally strong as for the 80-90 m band, and the shift of the band position to longer wavelengths is limited to 1 m for a given temperature (compared to more than 5 m for the 80-90 m band).
| 20 m complex | 40 m | 80–90 m | |
|---|---|---|---|
| Peak position | [m] | [m] | [m] |
| sphere | |||
| 10 K | 27.05, 27.84 | 41.40 | 79.62, 83.77 |
| 300 K | 28.58 | 42.64 | 80.56, 84.71 |
| weighted CDE | |||
| 10 K | 28.18 | 41.75 | 84.91 |
| 300 K | 29.13 | 43.09 | 86.25 |
| mean CDE | |||
| 10 K | 30.02 | 42.54 | 90.31 |
| 300 K | 30.66 | 43.68 | 90.14 |
Comparing the band properties for different temperatures within a given grain model, we find that the shift of the peak position is very prominent in the case of the 40 m feature, even for the grain shape distributions. It clearly dominates over shape effects for this band, whereas this is not true for the 30 and 80–90 m features. In the case of the latter both the shape effects are stronger due to the higher oscillator strengths and the temperature effects are intrinsically smaller as has been discussed in the previous section.

3.3 Comparison to PE powder spectra
Since powder spectra of calcite and dolomite – measured at room temperature – have been utilized by both Kemper et al. (2002a) and Chiavassa et al. (2005) in order to argue for the presence of carbonate dust in astronomical objects, it is important to discuss the relation between such powder spectra and the small particle spectra based on our optical constants. By ‘powder spectra’ or ‘PE spectra’, we understand the transmission spectra of sub-micron sized ground powder embedded in polyethylene (PE), transformed into absorption cross sections.
Powder spectra generally depend on various circumstances such as particle size and shape, orientation, agglomeration degree, and the refractive index of the surrounding medium (e.g. Bohren & Huffman (1983)).
Fig. 7 shows both the powder spectrum published by Kemper et al. (2002a) – measured on a sample of unsedimented calcite grains (dash-dotted-line) – and of a sample of calcite grains which had previously been subjected to sedimentation in a liquid (acetone), in order to remove large grains (solid line). The peak of the latter spectrum is shifted by about 2 m to shorter wavelengths with respect to the data published by Kemper et al. (2002a), although both have been measured at room temperature. This is due to the presence of large grains (several m in diameter) in the unsedimented powder. The spectrum of the sedimented powder is in good agreement with the result of the calculation for a mean CDE with PE environment (see Fig. 7), indicating the presence of a considerable fraction of grains with shapes far away from spherical symmetry.
Conversely, we find that the mean CDE is a good representation of the shape distribution of a real calcite powder with grain sizes within the Rayleigh limit. This justifies the use of this shape distribution for the comparison with observed data at large wavelengths. In the following (see Sect. 4.1) we will apply this model to simulate dust spectra at low temperatures.

4 Comparison with astronomical observations
The laboratory spectra presented so far are especially relevant for a comparison with FIR spectra of cold dust in objects such as the planetary nebula NGC 6302. Hence, we shall first give a brief review of some key properties of the dust spectrum of this object.
Barlow (1997) observed features 65 and 69 m and another possible broad band feature in the range of 88-98 m. While the 65 m feature was attributed to crystalline ice (see also Waters et al. 1996), the 69 m feature was suspected to be due to crystalline forsterite and the question for the carrier of the 88-98 m band remained open.
Molster et al. (2001) identified the 65 m band as a blend of diopside and crystalline water ice with enstatite. They also confirmed the reality of the broad feature around 90 m and suspected that there should be a very cold dust component present in the nebula.
Kemper et al. (2002a,b) first assigned the 65 m feature to cold dolomite (with additional contributions by diopside and water ice) and the broad emission band around 90 m to cold calcite dust. As already mentioned above, the temperature of the carbonate dust was assumed to be in the 30-60 K range. A mass fraction of less than 0.3% (for calcite as well as for dolomite) has been derived by these authors.
We retrieved an ISO-SWS and an ISO-LWS spectrum of NGC 6302 from the ISO archive and reduced it by means of the OLP version 10.0.
From the composite spectrum (ranging from 2.4–200 m), we subtracted a combination of Planck functions for temperatures of 30, 55 and 95 K. The remaining ‘residual dust emission’ is shown in Fig. 8 for the 35–105 m range; the individual broad peaks of the gray line result from various ice and dust species such as H2O, forsterite, enstatite, diopside, and – possibly – carbonates (see Kemper et al. 2002a, Tab. 2).
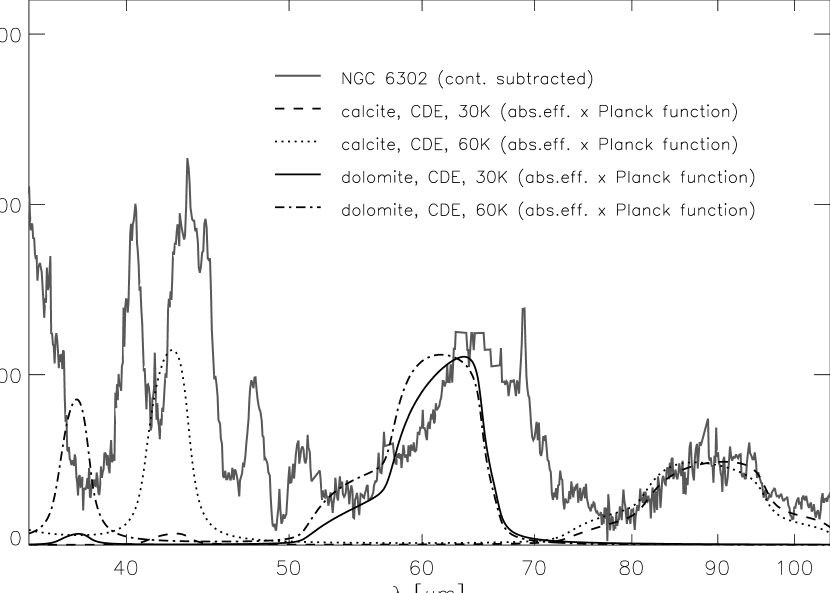
Our aim has been to examine whether the assignments of the 60-65 m and ‘92’ m bands to dolomite and calcite is compatible with the optical constants and powder spectra presented in Sect. 3, and, if so, for which temperatures and particle shapes this is the case. For answering this questions, the detectability of bands at wavelengths between 35 and 45 m depending on the dust temperature also plays a key role.
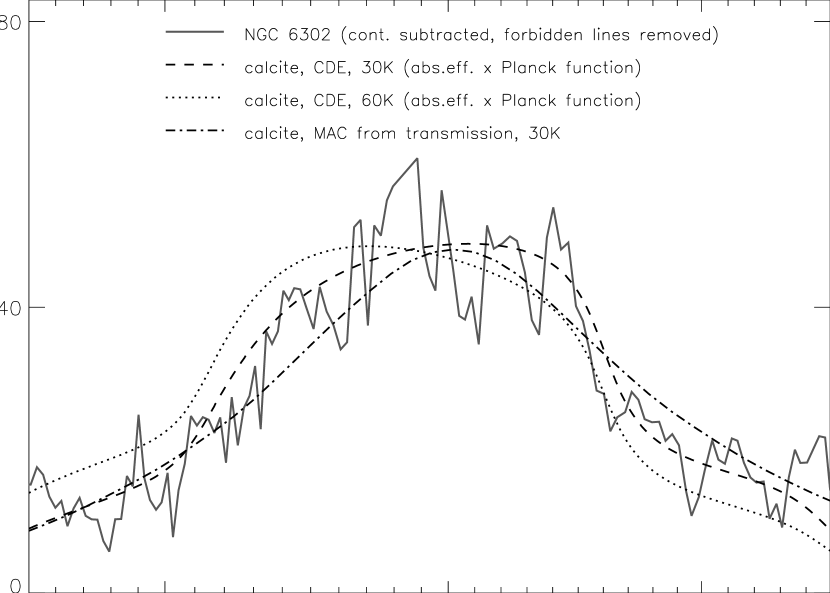
4.1 The ‘92’ m band in NGC 6302
A detailed view of the ‘92’ m band is given in Fig. 9. It can be seen from this figure (when compared to Fig. 6) that only for a mean CDE particle shape distribution of calcite grains, the bandwidth is as large as in the case of the NGC 6302 spectrum. For a weighted CDE, the bandwidth is smaller by 45% (at the relevant cryogenic temperatures). The best fit is achieved by the Cabs/V function for a mean CDE multiplied by a Planck function for a temperature of 30 K. A dust temperature of 60 K is hardly compatible with the observations, both with respect to the ‘92’ m band profile and with respect to the emergence of a 42 m feature (see dotted lines in Figs. 8 and 9). The calcite data derived from transmission spectroscopy of sedimented powder (dash-dotted line in Fig. 9) roughly reproduce the observed band profile as well. It is noteworthy that the ‘92’ m band profile of NGC 6302 obtained by Kemper et al. (2002a) is better fitted by the PE spectrum of an unsedimented calcite powder sample which is broader and peaks at a larger wavelength. This may be due to the use of different ISO LWS spectra (a mean of seven vs. a single) or due to some uncertainty in the continuum subtraction.
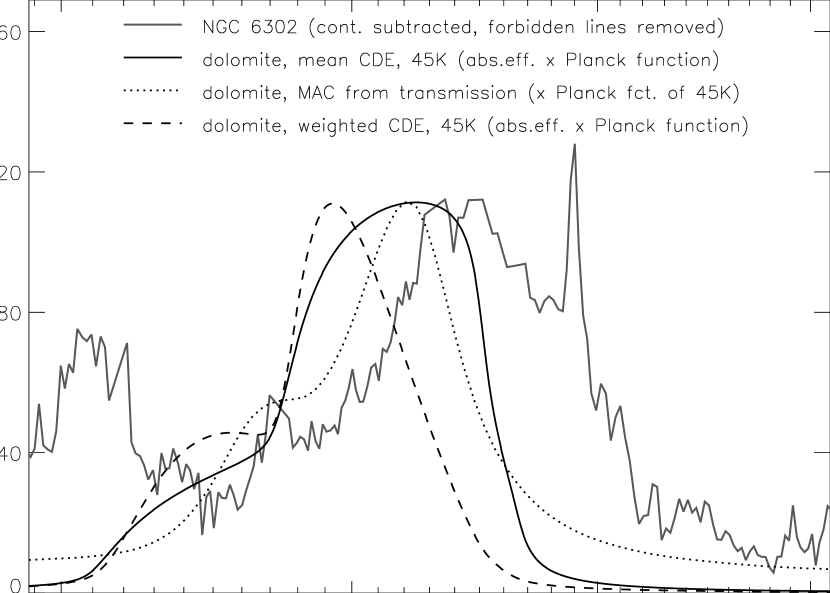
4.2 The 60-65 m emission complex in NGC 6302
In Fig. 10 a close-up view of the 60 m emission complex is shown. Although the bandwidth of a mean CDE particle shape distribution can reproduce the observed bandwidth of the 60 m feature, neither for a mean CDE nor for a weighted CDE – both at a temperature of 45 K – the positions coincide with the observed one. The difference between the band positions resulting from laboratory measurements and the observed band position ( 64 m) is too large as to be compensated by temperature effects – see also Fig. 8, where a comparison with dolomite dust at T=30 K is made. Dust temperatures lower than 40 K would allow to suppress the dolomite emission band at 37 m (see again Fig. 8), but the position of the 60 m feature would still not match. Therefore this feature cannot be fit only by dolomite, while it is not excluded that dolomite contributes to the ‘blue wing’ of the 60 m emission complex. Our study confirms that the 60-65 m band must have other major carriers, e.g. diopside as suggested by Kemper et al. (2002a). A recent publication by Chihara et al. (2007) shows that a mixture of diopside and åkermanite (Ca2MgSi2O7) at a temperature of 30 K provides a good match of the 60-65 m feature.
4.3 The 90–110 m band in protostars
Chiavassa et al. (2005) studied a sample of 32 low and intermediate mass protostars (mostly Class 0 and Herbig Ae/Be objects). Out of this sample, 17 sources show a broad band feature between 90 and 110 m. The dust temperature in these objects is found by blackbody fits to the continuum to be below 50 K (except for emission from the innermost regions). Calcite is suggested to be a possible carrier of this feature, which seems to be supported by the laboratory measurements of Kemper et al. (2002a) that show a peak at 93 m and a width (FWHM) of 16 m.
Our data show that for PE powder measurements on small grains and also for calculated spectra assuming a mean CDE, the maximum of the ‘92’m calcite band is located at 90m. For other particle shape distributions, it is narrower and located at much smaller wavelengths, especially for the temperature range relevant for PNe and protostars. The transverse optical resonance wavelength of mode 5OR,10K of about 96 m (Tab. 1) can be considered as the maximum peak position for this band (cf. Bohren & Huffman (1983)). The feature produced by the 3ER,10K mode with a TO resonance wavelength of about 105 m is much broader and therefore comparably weak and cannot dominate the calcite grain emission even if alignment effects were present.
Hence we conclude that the bands observed for the Herbig Ae/Be objects may in principle be compatible with emission from calcite grains, if sufficiently extreme shape distributions (much more extreme than the mean CDE) and/or large grains are assumed (cf. Fig. 7 in Chiavassa et al. 2005). For the Class 0 objects, in the contrary, we confirm that the feature characteristics are incompatible with laboratory data for calcite. Whether the incorporation of other ions into a carbonate can shift the band to still larger wavelengths has to be left open at this point.
5 Conclusions
While previous studies on carbonate dust in astronomical environments were largely based on powder measurements performed at room temperature, we have on the one hand derived optical constants of calcite and dolomite and on the other hand carried out measurements at cryogenic temperatures (200, 100 and 10 K). From these optical constants, small particle spectra (absorption efficiencies as functions of the wavelength and temperature) were calculated for different grain shapes.
Since the optical constants of calcite and dolomite reach peak values of 5–10 (corresponding to maxima of the imaginary part of the dielectric function of up to 150), their absorption efficiencies are extremely sensitive to particle shape effects. For the ‘92’ m band of calcite, e.g., the negativity range of the real part of the dielectric function is as large as 73–96 m for the ordinary ray (and even 75–105 m for the extraordinary ray). The former values approximately indicate how large the range is in which calcite’s ‘92’ m band can shift due to particle shape effects, since the ordinary ray is weighted more strongly than the extraordinary ray.
At cryogenic temperatures, the FIR bands of calcite and dolomite increase their intensity, get narrower and shift to shorter wavelengths. The temperature-related shift in position is largest for calcite’s 40 m band: in this case, it reaches 0.5 m per 100 K.
As for the ‘92’ m feature detected by Kemper et al. (2002a) in ISO-LWS spectra of NGC 6302, this feature can only be assigned to CaCO3 grains if the assumption of a mean CDE – with equal probability of all grain shapes – is made.
Furthermore, dust temperatures have to be well below 40 K in order to suppress the 30 m and 42 m bands of calcite which accompany the ‘92’ m band but are not seen in the spectra of NGC 6302.
References
- (1)
- Barlow (1997) Barlow, M.J., 1997, Ap&SS 255, 315
- (3)
- Bohren & Huffman (1983) Bohren, C.F., Huffman, D.R., 1983, Absorption and Scattering of Light by Small Particles, John Wiley, New York
- (5)
- Bregman & Rank (1975) Bregman, J.D. & Rank, D.M., 1975, ApJ195, L125
- (7)
- Bregman (1977) Bregman, J.D., 1977, PASP 89, 335
- (9)
- Ceccarelli et al. (2002) Ceccarelli, C., Caux, E., Tielens, A.G.G.M., Kemper, F., Waters, L.B.F.M., Phillips, T., 2002, A&A395, L29
- (11)
- Chiavassa et al. (2005) Chiavassa A., Ceccarelli, C., Tielens, A.G.G.M., Caux, E., Maret, S., 2005,A&A432, 547
- (13)
- Chihara et al. (2007) Chihara H., Koike, C., Tsuchiyama, A., 2007, A&A464, 229
- (15)
- Cohen et al. (1986) Cohen, M., Allamandola, L., Tielens, A.G.G.M., et al., 1986, ApJ302, 737
- (17)
- Erard et al. (2000) Erard, S., Lellouch, E., Encrenaz, T., Morris, P., de Graauw, T., & Burgdorf, M., 2000, LPI Conf. Abstr. 31, 1325
- (19)
- Ferrarotti & Gail (2005) Ferrarotti, A.S., & Gail H.-P., 2005, A&A430, 959
- (21)
- Gillet, Forrest & Merrill (1973) Gillett, F.C., Forrest, W.J., Merrill, K.M., 1973, ApJ183, 87
- (23)
- Hellwege et al. (1970) Hellwege, K.H., Lesch, W., Plihal, M., Schaack, G., 1970, Z. Physik 232, 61
- (25)
- Hofmeister, Wopenka & Lockock (2004) Hofmeister, A.M., Wopenka, B., Locock, A.J., 2004, Geochim. Cosmochim. Acta68, 4485
- (27)
- Joswiak & Brownlee (2001) Joswiak, D.J., Brownlee, D.E., 2001, Lunar and Planetary Institute Conference Abstracts, 32, 1998
- (29)
- Kemper et al. (2002a) Kemper, F., Molster, F.J., Jäger, C., Waters, L.B.F.M., 2002a, A&A394, 679
- (31)
- Kemper et al. (2002b) Kemper, F., Jäger, C., Waters, L.B.F.M., et al., 2002b, Nature 415, 295
- (33)
- Lellouch, Encrenaz & de Graauw (2000) Lellouch, E., Encrenaz, T., de Grauuw, T., et al., 2000, Planet. Space Sci., 48, 1393
- (35)
- Lisse et al. (2006) Lisse C.M., VanCleve J., Adams A.C., Science 313, 635
- (37)
- McCarthy, Forrest & Houck (1978) McCarthy, J.F., Forrest, W.J., Houck, J.R., 1978, ApJ224, 109
- (39)
- Molster et al. (2001) Molster, F.J., Lim, T.L., Silvester, R.J., et al., 2001, A&A372, 165
- (41)
- Onaka & Okada (2003) Onaka, T., & Okada, Y., 2003, ApJ585, 872
- (43)
- Orofino et al. (1998) Orofino, V., Blanco, A., Fonti, S., Proce, R., Rotundi, A., 1998, Planet. Space Sci., 46, 1659
- (45)
- Ossenkopf, Henning & Mathis (1992) Ossenkopf, V., Henning, Th., Mathis, J.S., 1992, A&A261, 567
- (47)
- Penman (1976) Penman, J.M., 1976, MNRAS176, 539
- (49)
- Quirico et al. (2000) Quirico, E., Raynal, P.-I., Borg, J., et al., 2000, Lunar and Planetary Institute Conference Abstracts, 31, 1260
- (51)
- Sandford (1986) Sandford, S.A., 1986, Science, 231, 1540
- (53)
- Tomeoka & Buseck (1986) Tomeoka, K., & Buseck, P.R., 1986, Science, 231, 1544
- (55)
- Toppani et al. (2005) Toppani A., Robert F., Libourel G., et al., 2005, Nature, 437, 1121
- (57)
- Waters (1996) Waters L.B.F.M, Molster F., de Jong T., et al., 1996, A&A315, L361
- (59)
- Wyckhoff (1964) Wyckhoff, R.W.G., 1964, Crystal structures, 2nd ed., vol. 2, New York and London: Sydney Interscience Publ.
- (61)