![[Uncaptioned image]](/html/0706.3955/assets/x1.png)
The Belle Collaboration
Study of charmonia in four-meson final states
produced in two-photon collisions
Abstract
We report measurements of charmonia produced in two-photon collisions and decaying to four-meson final states, where the meson is either a charged pion or a charged kaon. The analysis is based on a fb-1 data sample accumulated with the Belle detector at the KEKB electron-positron collider. We observe signals for the three -even charmonia , and in the , and decay modes. No clear signals for production are found in these decay modes. We have also studied resonant structures in charmonium decays to two-body intermediate meson resonances. We report the products of the two-photon decay width and the branching fractions, , for each of the charmonium decay modes.
pacs:
13.25.Gv, 13.66.Bc, 14.40.GxI Introduction
The two-photon decay widths () of charge-conjugation ()-even charmonium states are important observables that are sensitive to the properties of quarks inside charmonium bound states. Precise measurements of widths can give valuable constraints on the models that describe the nature of heavy quarkonia [1-3].
High luminosity electron-positron colliders are well suited to measurements of the two-photon production of charmonium states, since they provide a large flux of quasi-real photons colliding at two-photon center-of-mass energies covering a wide range. Various charmonium states, including the , , , and , have been observed so far in two-photon production processes.
In resonance formation, the production cross section from quasi-real two-photon collisions at an collider is proportional to the product of the two-photon decay width of the resonance and its branching fraction () to the observed final state:
where is the resonance. For the above charmonium states, the two-photon decay widths are mainly determined from two-photon collision measurements performed in a small number of specific decay modes only since the production rate of the corresponding states is limited. The results have rather large statistical errors and in some cases even larger systematic errors originating from uncertainties in the corresponding charmonium branching fraction to the observed final state. It is necessary to reduce these errors with high-statistics measurements in various decay channels. Through these measurements, we can also obtain ratios of branching fractions for various charmonium decay modes.
In this paper, we report the measurements of production of the charmonium states , and in two-photon collisions from their decays to four-meson final states , and , with the Belle detector. We have studied intermediate meson-resonant structures in these decay modes. We have also searched for production of the in these final states. Previous measurements of the same processes are found in Refs. [4-10]. Belle previously reported measurements of two-photon production of these charmonia in several decay modes: bellechic2 , and decays to the two-meson final states and nkzw as well as wtchen , and cckuo . Production of the in a two-photon process was observed in the mode by the CLEO and BaBar experiments cleo2s ; babar . This is the only decay mode so far directly observed for this charmonium state.
II Experiment and event selection
II.1 Data and the Belle detector
We use data that corresponds to an integrated luminosity of 395 fb-1 recorded with the Belle detector at the KEKB asymmetric-energy collider kekb . Since the beam energy dependence of two-photon processes is very small, we combine the on-resonance and off-resonance data samples; the off-resonance data were taken 60 MeV below the . The analysis is made in the “zero-tag” mode, where neither the recoil electron nor positron is detected. We restrict the virtuality of the incident photons to be small by imposing a strict transverse-momentum balance along the beam axis for the final-state hadronic system.
A comprehensive description of the Belle detector is given elsewhere belle . We mention here only the detector components essential to the present measurement. Charged tracks are reconstructed from hit information in a central drift chamber (CDC) located in a uniform 1.5 T solenoidal magnetic field. The axis of the detector and the solenoid are along the positron beam direction, with the positrons moving in the direction. The CDC measures the longitudinal and transverse momentum components (along the axis and in the plane, respectively). Track trajectory coordinates near the collision point are provided by a silicon vertex detector (SVD). Photon detection and energy measurements are performed with a CsI(Tl) electromagnetic calorimeter (ECL). Kaons are identified using information from the time-of-flight counters (TOF) and silica-aerogel Cherenkov counters (ACC). The ACC provides good separation between kaons and pions or muons at momenta above 1.2 GeV/. The TOF system consists of a barrel of 128 plastic scintillation counters, and is effective in separation mainly for tracks with momentum below 1.2 GeV/. Lower energy kaons are also identified using specific ionization () measurements in the CDC. The magnet return yoke is instrumented to form the and muon detector (KLM), which detects muon tracks and provides trigger signals.
Signal events are efficiently triggered by several kinds of track-triggers that require two or more CDC tracks with combinations of TOF hits, ECL clusters or summed energies of ECL clusters. No additional cuts on the trigger information are applied. The trigger conditions are complementary for the detection of four-prong events; we obtain an overall trigger efficiency of 95%.
separation uses a likelihood ratio formed from ACC, TOF and CDC information. No explicit lepton identification requirement is applied, since leptons are not a large background source in exclusive four-prong events.
II.2 Event selection
Candidate events are selected as follows; all variables in selection criteria (1)-(10) are measured in the laboratory frame. (1) There are exactly four charged particles and each satisfies the following criteria: GeV/, cm, cm, where is the transverse momentum of a track with respect to the axis, and and are the radial and axial distances, respectively, of the closest approach (as seen in the plane) to the nominal collision point; (2) the net charge of the four tracks is zero; (3) at least two of the four tracks satisfy the following additional criteria: GeV/, cm, and , where is the polar angle; in addition, the following two criteria are applied for the four-track systems: (4) the scalar sum of the momenta () of the four tracks must be smaller than 6 GeV/; (5) the average of the values for the four tracks is within 3 cm of the nominal collision point.
In order to reject backgrounds from single-photon annihilation or radiative events, the following criteria are required: (6) the invariant mass of track combinations that satisfy criterion (3) should be smaller than 4.5 GeV/ (here, zero mass is assigned to each of the charged tracks), and (7) the missing mass squared of the recoil against the track combination is larger than 2 (GeV/.
Calorimetry requirements are also applied: (8) the total calorimeter energy in an event is smaller than 6 GeV; (9) there is no electromagnetic cluster unassociated with a track (i.e., a neutral cluster) whose energy exceeds 0.4 GeV; (10) there is no candidate whose transverse momentum is larger than 0.1 GeV/.
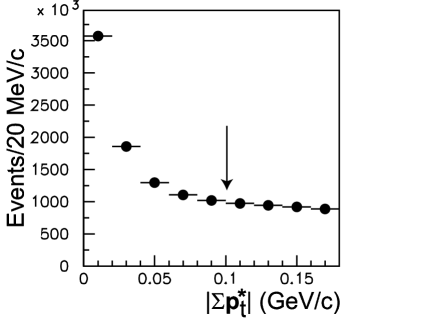
After all these selection criteria are applied, the four tracks are transformed into the center-of-mass (c.m.) frame, and the vector sum of their transverse momenta with respect to the beam direction in the c.m. frame, , is calculated. The variable approximates the transverse momentum of the two-photon-collision system. We require (11) GeV/ in order to enhance the number of events from quasi-real two-photon collisions. Figure 1 shows the transverse momentum () distribution near the selection region.
II.3 separation
We apply particle identification requirements for each track. A likelihood ratio, , is calculated, where the kaon and pion likelihoods, and , are determined from information provided by the ACC, TOF and the CDC system. All tracks with are assigned to be kaons. This requirement gives a typical identification efficiency of 90% with a probability of 3% for a pion to be misidentified as a kaon. All other tracks are treated as pions.
We take (12) only the combinations in which the net strangeness is conserved, , and . These final-state combinations are sometimes denoted , and , respectively, in this paper.
When a pair of pions (kaons) in the four prong decay of a certain charmonium are misidentified as a pair of kaons (pions), they could produce a broad enhancement in the spectrum of the misidentified channel at a mass very different from that of the original charmonium. However, these backgrounds do not make any pronounced peaks near the three charmonia masses.
II.4 Rejection of ISR events
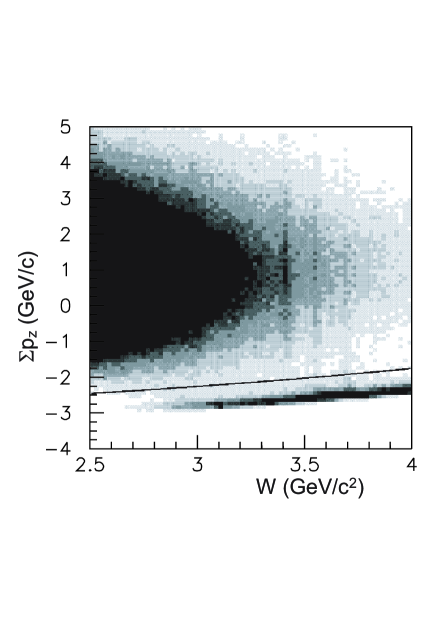
Two-photon events with relatively high c.m. energies (above 3.2 GeV in the case of Belle) are contaminated by background processes where a real or virtual photon is emitted in the direction of the incident electron. They are called ISR events or pseudo-Compton events, in case the positron collides with the electron () or with the virtual photon (), respectively. Such events have a kinematical correlation between the -component in the laboratory frame () and the invariant mass of the final-state hadron system (). We reject them with the following additional requirement: (13) . These backgrounds are not harmful in the measurements of -even charmonia, since at lowest order they produce only -odd hadron systems. We show a two-dimensional plot for vs invariant mass of the hadronic system for the four-pion final state candidate in Fig. 2.
After all these selections, we obtain events, events and 6003 events in the four-meson invariant mass region between 2.0 GeV/ and 5.0 GeV/.
III Yields for Charmonium Production
III.1 Yields of the charmonia
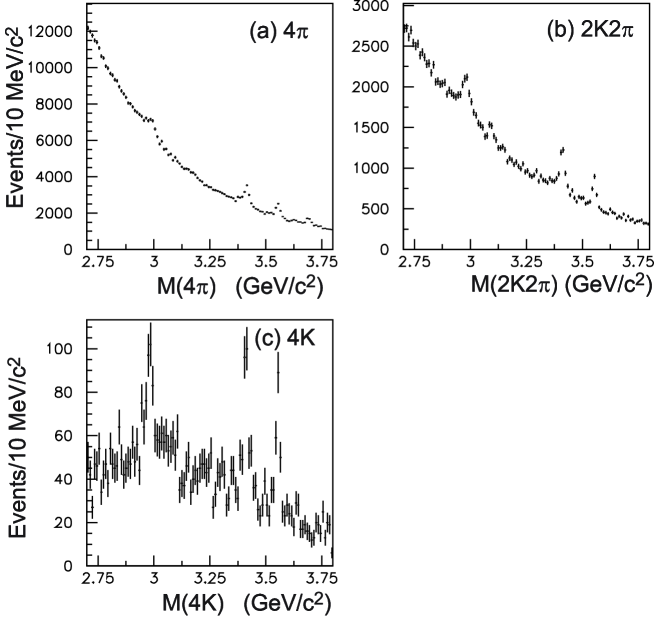
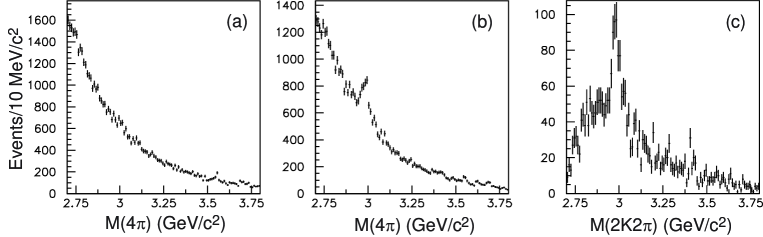
We measure the charmonium yields from the invariant mass distributions in each of the three final-state processes. The distributions are shown in Fig. 3. Peaks at the -even charmonium masses are assumed to be from two-photon production processes if the transverse-momentum distribution peaks in the vicinity of . We discuss the distributions in Sect. V.C.
We find clear enhancements for the (denoted hereafter as “”) at GeV/, at GeV/, and at GeV/ in all the final states. We do not find any clear signals, which would appear at around 3.63-3.65 GeV/ in the invariant mass distributions. A small peak near 3.69 GeV/ in the final state is from , , where the leptons are not identified and are treated as pions. These events are attributed primarily to the double ISR annihilation process, . Upper limits for production will be derived in Sect. VII.
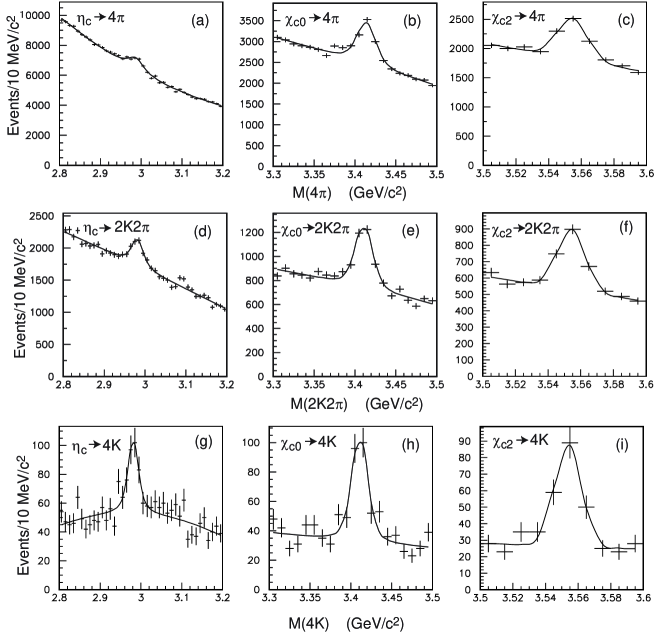
The invariant-mass distribution in the vicinity of each charmonium peak is fitted to the sum of charmonium and background components using minimization. We use a second-order polynomial for the background component. The fitted regions are 2.8-3.2 GeV/, 3.3-3.5 GeV/ and 3.5-3.6 GeV/ for the analyses of the , and , respectively. The energy dependence of the efficiency is small within each resonance region and is neglected. We adopt the relativistic Breit-Wigner function for the and signals, which are smeared with a Gaussian function whose width is fixed to the invariant-mass resolution (ranges in 7-10 MeV/ depending on the decay process) estimated by the signal Monte Carlo (MC) simulation. In the fit to the , we use a simple Gaussian function with a floating width, because the natural width is considerably smaller than the mass resolution. The mass resolutions from the fits, 8 - 9 MeV/, are consistent with the MC expectations at the mass.
The fit results are shown in Fig. 4 and are summarized in Table 1. In the table, the masses are corrected for the effects of a systematic shift seen in the signal MC mainly due to the tails of kaon energy loss in the innermost detector region. The correction size is typically MeV/), where is the number of kaons. The systematic errors for the masses include the uncertainty due to this effect (a half of the correction size) as well as the uncertainty of the mass scale (2.0 MeV/) originating from the uncertainty of the momentum scale, while those for the widths are obtained by changing the mass resolution by 1 MeV/. We confirm that the mass and width of the are robust for the change of the fit region as described in Sect. V.B.
We find a hint of a possible contribution from the double ISR background in the distribution. This could affect the yield and resonance parameters of the determined from the fit. We have tried a fit that includes a peak near the mass. The changes of the yield (7%) and the total width (1.9 MeV) are taken into account in the systematic errors. There is no detectable shift in the mass. The fit including a peak gives the mass, MeV/, where we apply the same correction and systematic error as applied for . This provides a confirmation of the mass scale in the present measurement.
Possible interference of the charmonia with the continuum component is not taken into account in the present analysis. It is difficult to separate the continuum-component amplitudes that interfere with the charmonium amplitude in each process, because different partial-wave components of the continuum appear within the background. In general, the interference effects could give different mass/width fit results for each decay mode. However, for the three considered processes the values obtained for these parameters from the no-interference fits to the separate decay modes are consistent with each other. The mass values for the are systematically higher than the world average value, MeV/ pdg . The width and the parameters of and are consistent with the previous measurements. Table 1 also shows the combined results from the measurements of the three decay processes, where the central values are derived from the weighted means of the three fits and the systematic errors are evaluated considering the full correlations between the error sources.
| Charmonium | Mass | Width() (or ) | Number of events | |
|---|---|---|---|---|
| final state | (MeV/) | (MeV) | ||
| 48.3/34 | ||||
| 61.7/34 | ||||
| 35.5/34 | ||||
| 27.1/14 | ||||
| 24.8/14 | ||||
| 24.7/14 | ||||
| () | 4.7/4 | |||
| () | 2.8/4 | |||
| () | 3.9/4 | |||
| (combined) | ||||
| (combined) | ||||
| (combined) |
III.2 Yields of two-body decays
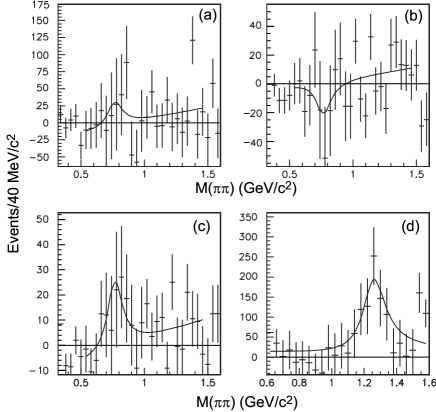
We study the sub-structure of the charmonium signals by searching for quasi-two-body components, in which a charmonium meson decays into two resonances, and each resonance decays to two final-state mesons. We determine the yields of these two-body decays using the following procedure: we first make two-dimensional plots of the two invariant masses constructed from the available two-meson combinations of , or , for each event. The and samples have two entries from each event. Such plots are made in each charmonium signal region and sideband region. The charmonium sideband distribution is then subtracted from the signal distribution bin-by-bin in two dimensions. We note that the non-charmonium background components are considerable even in the vicinities of the charmonium peaks.
The signal regions are defined as the ranges within MeV/ ( MeV/ for the ) of 2.98 GeV/, 3.41 GeV/, and 3.56 GeV/, for the , and , respectively. The sideband regions are taken on both sides of the signal region, MeV/ below and MeV/ above ( MeV/ and MeV/ for the ) the central point of the corresponding signal region. The sizes of the signal and sideband regions (in the sum of the two regions) in the invariant-mass range are chosen to be the same so that we can apply a simple sideband subtraction.
Next, we define the signal and sideband regions for the , , and mesons, based on their known masses and widths. (Hereafter, we refer to the , and as , and , respectively.) We apply the sideband subtraction at the side to extract the yield of the decay.
The signal regions are 0.64-0.88 GeV/, 1.08-1.40 GeV/, 0.80-0.96 GeV/ and 1.00-1.04 GeV/ for the , , and , respectively. We take sideband regions on both sides adjacent to the signal region. In the mode the sidebands cover the ranges from the mass threshold to 1.00 GeV/ and 1.04-1.08 GeV/. For each of the other resonances the sideband has a width that is half the size of the signal region on each side. The sideband subtraction is applied assuming the continuum yield has a linear dependence on invariant mass.
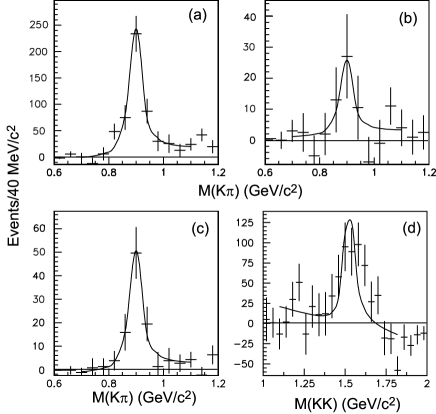
Thus, we obtain a one-dimensional histogram corresponding to a resonance signal component tagged by another resonance. We search for , , , and signals in the histograms. In the decays to pairs of same-kind resonances (such as or ), we symmetrized the two-dimensional distribution in two directions, by adding it to the same distribution where the two-masses are interchanged. In this case we must divide the peak yield by two to obtain the correct signal yield and take into account the statistical correlation.
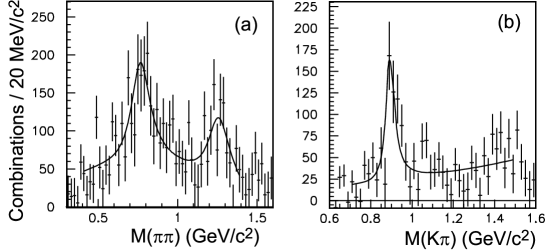
We fit the signal to a Breit-Wigner taking into account the angular momentum between the final state mesons and a linear continuum component in the one-dimensional distribution near the resonance masses. As the only exception, however, we count in decays the number of events in the invariant mass range, 1.00-1.04 GeV/ and subtract backgrounds from a sideband in the 1.04-1.24 GeV/ region, instead of performing a fit. The one-dimensional distributions and the fits for the , , and resonances in different charmonium decay modes are shown in Figs. 5 - 7.
Table 2 summarizes the signal yields. We assume that there are no effects from interference in the sideband subtractions as well as the fits of the invariant mass distributions. We have applied corrections for inefficiencies arising from sideband subtractions in the two-meson resonance and charmonium regions; the targeted resonance component partially leaks outside the signal region and enters the sideband regions. The inefficiencies are calculated by assuming Breit-Wigner forms for the charmonia and light-quark resonances using the known masses and widths pdg . The 90%-confidence-level (C.L.) upper limits correspond to the upper edge of a 90% confidence region derived from Feldman and Cousins’s table (Table X in Ref. felcou ) assuming statistical fluctuations follow Gaussian distributions (there is a large number of events in both signal and sideband regions in the present case), with the expected number of signal events constrained to be non-negative.
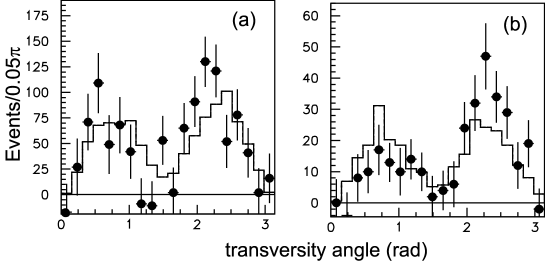
We do not observe a significant component in decays in spite of the signal reported for from measurements of radiative decays pdg . Meanwhile, we find and signals with greater than statistical significances. It can be noted that the observed yield for is comparable to the total yield of . This indicates that the component dominates decays. We confirm the decays to in the distribution of the transversity angle (Fig. 8(a)) defined as the angle between the decay planes of the two candidates in the rest frame. Here, the candidate is a combination whose invariant mass lies in the range 1.15-1.39 GeV/. The distribution shows a characteristic feature of tensor-meson decays. Similarly, is dominated by the sum of and . The transversity-angle distribution of the candidates is shown in Fig. 8(b) (here, the candidate is a combination whose invariant mass falls in 1.475 - 1.575 GeV/). The asymmetry with respect to 90∘ can be interpreted as the effect of interference between the above two decay modes; an asymmetry in directional correlations between and should not arise in a pure process. The (, ) distributions expected from the MC events overlap with the (, ) mass region near its lowest mass-combination edge. The histograms are the distributions of the corresponding signal MC events generated assuming pure P-waves between the two tensor mesons.
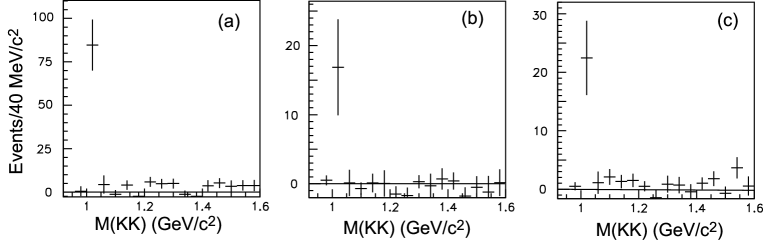
Figures 9 (a) and (b) show the invariant-mass distributions of events that are consistent with and , respectively. We find no prominent peaks at the mass in the former, but find a clear signal for the in the latter. An enhancement at the mass is also clearly visible in Fig. 9(c) which shows the invariant-mass distribution for candidates.
| Decay process | Number of events |
|---|---|
III.3 Yields of three-body decays
The distributions corresponding to the processes in Fig. 5(c) and or in Fig. 6(b) have significant net yields although there are no prominent structures from the two-body decay components, and . We obtain the yields of each three-body decay using the following procedure. For the two processes, we first obtain the numbers of ’s in and ’s in by fitting the invariant-mass distributions of (Fig. 10(a), 4 entries/event) and (Fig. 10(b), 2 entries/event) to functional forms corresponding to the sum of and resonances and a resonance, respectively. Here, we also take into account the continuum component parameterized by a second-order polynomial. The results obtained are converted into the yields of three-body decay events after subtracting possible resonance yields from via and (or c.c.) via using the best estimates of the corresponding two-body yields after doubling the number of events to take account of the multiple entries. The results after these subtractions are summarized in Table 2.
IV Derivation of Products of Two-photon Decay Width and Branching Fraction
The product of the two-photon decay width and branching fraction is obtained from the following formula:
where is the number of observed events, the efficiency, and the integrated luminosity. is a factor that is calculated from the two-photon luminosity function (), the charmonium mass () and the charmonium spin (), using the relation
that is valid when the resonance width is small compared to the available kinetic energy in the decay. The parameter is calculated to be 2.11 fb/eV, 1.15 fb/eV, 4.74 fb/eV and 0.861 fb/eV for the , , and , respectively, using the TREPS code treps . We take the signal yields from Tables 1 and 2. We subtract the small contributions from decays included in the and samples, and events respectively, which were determined from the two-dimensional invariant-mass plots mentioned in Sect. III.A. (, results from our experiment are reported separately wtchen . is prohibited from parity conservation.)
The efficiency in the detection of each process is determined from the signal MC events generated by the TREPS code treps and processed by a full detector simulation. Three- and four-body decays were generated according to phase space with a resonance mass distributed according to the Breit-Wigner function, and the () decaying to () isotropically.
For two-body decays involving resonances with spin, the decay amplitude takes into account correlations caused by spin, and the full matrix element is symmetrized with respect to identical final-state particles. We assume a pure state with the lowest possible orbital angular momentum that satisfies conservation laws in each decay channel. The helicity of the along the incident axis is assumed to be 2, following the previous experiment results bellechic2 and theoretical expectations chic2theo .
The trigger efficiency is taken into account; it is estimated to be around 95% within the acceptance for all the processes. The detection efficiency including that of particle identification is calculated using MC events passed through the detector simulation code. Typical efficiencies are 16%, 10%, 5%, and 9% in the final-state processes, final-state processes, with a phase-space distribution, and the process, respectively. Their dependence on the two-photon c.m. energy, or charmonium mass, is rather small.
We summarize the results on in Table 3. The systematic errors and comparison to the previous experimental results also given there are described in detail in the following two sections. In some decay channels, we assume isospin invariance and use necessary branching fractions from Ref. pdg . The “isospin ” factors in the table are the products of the isospin factor and the branching fraction(s) used to obtain the results.
V Systematic Errors
V.1 Uncertainties in efficiencies
The trigger efficiency is estimated using the Monte-Carlo trigger simulator to be , where the error is estimated from comparison of experimental and MC results in low-multiplicity events and the efficiency variation under different beam background conditions.
We obtain a 5.5% systematic error from the uncertainty in track reconstruction efficiency for the four-track events, as well as 2% per kaon track from the kaon identification efficiency. The latter is determined from a study of kinematically identified kaons in a sample of , decays. We check the kaon identification efficiency by loosening the -event selection requirement; we temporarily require only three kaons in an event. We obtain % more yield for the , and , on average with the looser condition. The charmonium peaks are less prominent with these selections, due to a larger contamination from non- events. The above ratio is consistent with expectations from the MC, %, for the average of the three charmonia decaying to the state.
We use the total widths of the charmonia for the determination of the efficiency in the sideband subtractions. Taking systematic errors in the and widths into account, we varied the widths of the and from their nominal values by MeV and MeV, respectively, and assigned the obtained efficiency changes, and , respectively, as a systematic error. We take a 3% systematic error in the case for the uncertainty in the treatment of its long Breit-Wigner tails.
Inefficiencies caused by the sideband subtractions of the isobar resonances decaying to two mesons are calculated using the resonance parameters. We estimated the systematic error from this effect by changing the integration range of the resonance function from to . It is estimated to be 5% for each two-body decay mode.
V.2 Systematic errors in signal yields
In the fits to the four-meson invariant-mass spectra described in Sect. III.A, we set the fit region for the analyses of the to be rather wide, considering the relatively large natural width and the relatively large size of the continuum components. As a result, we have a larger second-order polynomial term contribution from the continuum components, which correlates significantly with the size of the charmonium component and could bias the signal yield. We tentatively narrowed the fit region to 2.85 - 3.15 GeV/ and took the variations in the obtained yields as a systematic error. They amount to 7%, 13% and 24% for , and channels, respectively. We neglect this error source for the other charmonia, where the quadratic components in the continuum are small.
In the fits to the two-meson invariant-mass distributions used to obtain the yields of the two-body decays, we tried a second-order polynomial constrained to vanish at the two-body threshold for each continuum component. We assign the difference between the yields from this method and the standard fit (to a linear function) to the systematic error. Thus, the systematic errors are 20% for and less than 3% for the other two-body channels where we have significant signals.
In the case of the three-body modes, we tested an alternative functional form for the continuum component and used the shape of three-body phase space calculated by the MC generator and the detector simulator. We take the difference in the signal yields from this method as the systematic error, that is 4% and 7% for and , respectively.
V.3 Study of non-exclusive backgrounds
Backgrounds can come from general multi-hadron production in two-photon collisions and production in single-photon annihilation. Yields from the process in the latter category are estimated from the MC and found to be negligibly small () compared to the non-charmonium backgrounds from two-photon processes. However, the charmonium production rates from these processes cannot be reliably estimated.
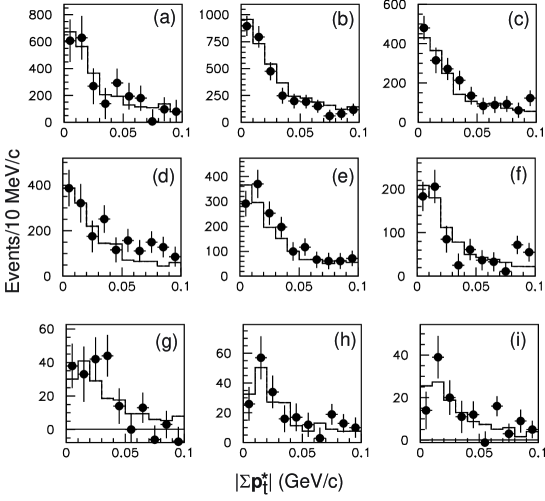
A more reliable signature is the -balance nature in the signal events. We expect that non- background processes cannot produce a -balanced distribution, except for double-ISR processes where exclusive production of charmonia is prohibited. Even in the decays where a is produced in an ISR or double ISR process, the distribution of will not peak inside the selected region, GeV/. We estimate the yield of this process to be about 1% of the and signals, based on the observed yields of decaying to .
We evaluate the non-exclusive backgrounds by examining the observed distributions. Figure 11 shows the distributions of the charmonium signal component after the sideband subtractions. The distributions are compared with the signal-MC expectations normalized to the sum of the two leftmost bins where the background contamination is expected to be very small. We expect that the background component has a linear shape in , in the region below 0.1 GeV/, based on geometrical considerations and some MC studies. Given this assumption, we obtain the background level from data, to be %, % and %, on average for the , and decay modes, respectively, using the experimental excesses seen in the bins of GeV/. Since there is no significant difference among these estimates, and they are consistent with zero (the overall average is %), we do not apply any corrections to this background source and assign a systematic error of 6% for all processes.
V.4 Total systematic errors
We consider other sources of systematic errors. The statistics of the signal MC events gives errors of 2-4% depending on the process. The calculation of the luminosity function has a systematic uncertainty of 5%. We take the differences among the efficiency estimates for different spin/angular-momentum assumptions for the decays to and as systematic errors. The nominal S-wave hypothesis gives the most conservative upper limit for the case. The total systematic errors are listed in Table III. The size of the systematic error relative to the central value is process dependent and ranges from 11% to 35% in the processes where finite results are presented. The upper limits in the table are shifted upwards by the systematic errors, in order to include the effect of systematic uncertainties.
VI Comparison with Previous Measurements
Some previous measurements give results for the processes measured here delphi ; cleo ; argus . We make direct comparisons with these measurements, which are listed in Table 3. We quote the world average value from Ref. pdg when two or more previous measurements are available. We can make such direct comparison only for a limited number of processes, since our results include many processes measured for the first time.
It is possible to make some indirect comparisons by converting the results measured for a different decay mode from the present measured mode and multiplying by the ratio of the branching fractions;
where is a “normalization” process for which previous measurement(s) are available. We adopt , (the average of the two modes) and as the normalization processes. Note that the two-photon decay widths for these charmonium states are so far measured only in a few decay modes; there are not enough consistency checks among the different decay modes available so far. We use the PDG’s fit when the average is unavailable pdg , and treat the errors shown there as independent from each other.
We find large differences between the present and previous measurements for in the direct comparisons, although they are not inconsistent considering the large errors assigned to the previous measurements. However, in the indirect measurements, for many decay modes our values are consistently smaller by factors of two to four compared to the previous determinations. We do not observe any significant signal in the mode in contrast with previous results dm2 ; bes2 . We conclude that these discrepancies are not likely to be due to statistical fluctuations, and there could be systematic deviations in previous measurements of the relevant partial decay widths or branching fractions.
In contrast, all the present and results are in agreement with previous values, and confirm the values of and results derived in previous experiments pdg .
| Process | Isospin | This paper | Direct | Indirect |
| factor | (eV) | (eV) | (eV) | |
| 1.0 | ||||
| 1.0 | ||||
| 1.0 | ||||
| 0.333 | ||||
| 0.320 | ||||
| 0.333 | ||||
| 0.251 | ||||
| 0.243 | ||||
| 1.0 | ||||
| 1.0 | ||||
| 1.0 | ||||
| 0.667 | ||||
| 0.333 | ||||
| 0.333 | ||||
| 0.243 | ||||
| 1.0 | ||||
| 1.0 | ||||
| 1.0 | ||||
| 1.0 | ||||
| 0.333 | ||||
| 0.333 | ||||
| 0.243 | ||||
| 1.0 | ||||
| 1.0 | ||||
| 1.0 |
VII Upper limits for Production
We search for the in the invariant-mass distributions of the four-meson final states. Since the final-state sample has a prominent peak just above the mass region, we veto events when the invariant mass of any combination falls within 0.1 GeV/ of the nominal mass. (The two tracks from the decay are misidentified leptons.)
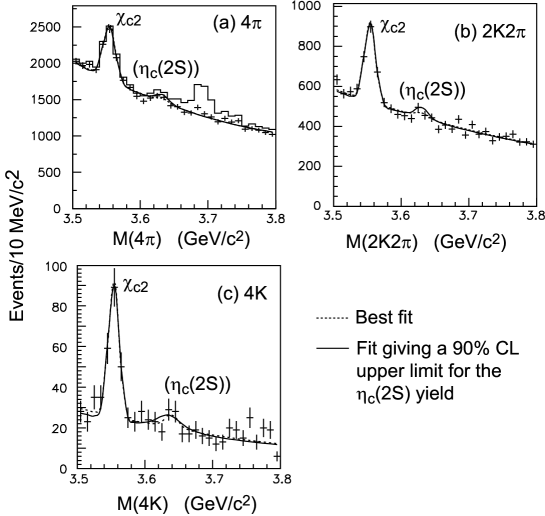
We obtain upper limits on yields from the four-meson invariant-mass distributions (Fig. 12). The mass and width of the are not very precisely determined so far. We consider a wide range for the mass and width, 3.62 GeV/ GeV/ and 10 MeV MeV, according to previous measurements belleetac2s ; belledccbar ; cleo2s ; babar ; pdg . Fits similar to those made in Sect. III.A are applied for the using a Breit-Wigner function with the mass resolution fixed to 9 MeV and a second-order polynomial for the background component, as well as a Gaussian function for the peak. The upper limits for the yields are 340, 164 and 55 events at 90% C.L., for the , and final-states, respectively. The curves corresponding to these upper limits are shown by the solid curves in Fig. 12. We calculate the upper limits using values from fits. We assume various non-negative values of the yield, and, for each case, we obtain the from the best fit while floating all the other parameters. We define the 90% C.L. upper limit of the yield as one whose is larger by than the minimum derived in the different assumptions of the yield. An application of the Feldman-Cousins method (Table X in Ref. felcou ) to the yields obtained from the fits gives the values very close to the yield upper limits, 338, 163 and 55 events for the , and modes, respectively.
We calculate the efficiency assuming a phase space distribution. The upper limit for for each decay mode of the is shown in Table 3. We find that the ratios are much smaller than unity in all three processes, as previously found in another decay mode, cleo2s . Although these results are still marginally consistent with the theoretical expectations, and , they give significant constraints on theoretical models [1-3], including calculations based on relativistic production.
VIII Conclusion
The production of the , and charmonium states in two-photon collisions has been observed in all of the four-meson final states, , and . We used data samples with one or two orders of magnitude larger statistics than previous measurements. No clear signature for the is found in any of decay processes, and we obtain the upper limits for the products of its two-photon decay width and the branching fractions. We have studied resonant substructures in these four-meson final states.
For the first time signals produced
in two-photon collisions are observed in the
or final states. We also find a new decay
mode, .
We have obtained products of the two-photon decay width
and branching fractions for various decays
of charmonium states. The present results for are systematically
smaller than the derived values from the world averages of
previous measurements.
We thank the KEKB group for the excellent operation of the accelerator, the KEK cryogenics group for the efficient operation of the solenoid, and the KEK computer group and the National Institute of Informatics for valuable computing and Super-SINET network support. We acknowledge support from the Ministry of Education, Culture, Sports, Science, and Technology of Japan and the Japan Society for the Promotion of Science; the Australian Research Council and the Australian Department of Education, Science and Training; the National Science Foundation of China and the Knowledge Innovation Program of the Chinese Academy of Sciences under contract No. 10575109 and IHEP-U-503; the Department of Science and Technology of India; the BK21 program of the Ministry of Education of Korea, the CHEP SRC program and Basic Research program (grant No. R01-2005-000-10089-0) of the Korea Science and Engineering Foundation, and the Pure Basic Research Group program of the Korea Research Foundation; the Polish State Committee for Scientific Research; the Ministry of Education and Science of the Russian Federation and the Russian Federal Agency for Atomic Energy; the Slovenian Research Agency; the Swiss National Science Foundation; the National Science Council and the Ministry of Education of Taiwan; and the U.S. Department of Energy.
References
- (1) C.R. Münz, Nucl. Phys. A 609, 364 (1996).
- (2) D. Ebert, R. N. Faustov and V. O. Galkin, Mod. Phys. Lett. A 18, 601 (2003).
- (3) J. P. Lansberg and T. N. Pham, Phys. Rev. D 74, 034001 (2006).
- (4) DELPHI Collaboration, J. Abdallah et al., Eur. Phys. Journ. C 31, 481 (2003).
- (5) DELPHI Collaboration, P. Abreu et al., Phys. Lett. B 441, 479 (1998).
- (6) L3 Collaboration, M. Acciarri et al., Phys. Lett. B 461, 155 (1999).
- (7) CLEO Collaboration, B.I. Eisenstein et al., Phys. Rev. Lett. 87, 061801 (2001).
- (8) ARGUS Collaboration, H. Albrecht et al., Phys. Lett. B 338, 390 (1994).
- (9) CLEO Collaboration, W.-Y. Chen et al., Phys. Lett. B 243, 169 (1990).
- (10) TPC/Two-Gamma Collaboration, H. Aihara et al., Phys. Rev. Lett. 60, 2355 (1988).
- (11) Belle Collaboration, K. Abe et al., Phys. Lett. B 540, 33 (2002).
- (12) Belle Collaboration, H. Nakazawa et al., Phys. Lett. B 615, 39 (2005).
- (13) Belle Collaboration, W.T. Chen et al., Phys. Lett. B 651, 15 (2007).
- (14) Belle Collaboration, C.C. Kuo et al., Phys. Lett. B 621, 41 (2005).
- (15) CLEO Collaboration, D.M. Asner et al., Phys. Rev. Lett. 92, 142001 (2004).
- (16) BaBar Collaboration, B. Aubert et al., Phys. Rev. Lett. 92, 142002 (2004).
- (17) S. Kurokawa and E. Kikutani, Nucl. Instr. and. Meth. A 499, 1 (2003), and other papers included in this volume.
- (18) Belle Collaboration, A. Abashian et al., Nucl. Instr. and Meth. A 479, 117 (2002).
- (19) Particle Data Group, W.-M. Yao et al., J. Phys. G 33, 1 (2006) and 2007 partial update for the 2008 edition available on the PDG WWW pages (URL: http://pdg.lbl.gov/).
- (20) G.J. Feldman and R.D. Cousins, Phys. Rev. D 57, 3873 (1998).
- (21) S. Uehara, KEK Report 96-11 (1996).
- (22) M. Poppe, Int. J. Mod. Phys. A 1, 545 (1986); H. Krasemann and J.A.M. Vermaseren, Nucl. Phys. B 184, 269 (1981).
- (23) DM2 Collaboration, D. Bisello et al., Nucl. Phys. B 350, 1 (1991).
- (24) BES Collaboration, M. Ablikim et al., Phys. Rev. D 72, 072005 (2005).
- (25) Belle Collaboration, S.-K. Choi et al., Phys. Rev. Lett. 89, 102001 (2002).
- (26) Belle Collaboration, K. Abe et al., Phys. Rev. Lett. 89, 142001 (2002).