Feedback in the Antennae Galaxies (NGC 4038/9): I. High-Resolution Infrared Spectroscopy of Winds from Super Star Clusters11affiliation: Data presented herein were obtained at the W.M. Keck Observatory, which is operated as a scientific partnership among the California Institute of Technology, the University of California and the National Aeronautics and Space Administration. The Observatory was made possible by the generous financial support of the W.M. Keck Foundation. 22affiliation: Data presented herein were obtained at the European Southern Observatory Very Large Telescope.
Abstract
We present high-resolution () near-IR spectroscopy of the youngest super star clusters (SSCs) in the prototypical starburst merger, the Antennae Galaxies. These SSCs are young ( Myr old) and massive ( M⊙ for a Kroupa IMF) and their spectra are characterized by broad, extended Brackett emission, so we refer to them as emission-line clusters (ELCs) to distinguish them from older SSCs. The Br lines of most ELCs have supersonic widths ( km s-1 FWHM) and non-Gaussian wings whose velocities exceed the clusters’ escape velocities. This high-velocity unbound gas is flowing out in winds that are powered by the clusters’ massive O and W-R stars over the course of at least several crossing times. The large sizes of some ELCs relative to those of older SSCs may be due to expansion caused by these outflows; many of the ELCs may not survive as bound stellar systems, but rather dissipate rapidly into the field population. The observed tendency of older ELCs to be more compact than young ones is consistent with the preferential survival of the most concentrated clusters at a given age.
1 Introduction
Star formation in starbursts creates massive young super star clusters (SSCs) that are not often found in more quiescent environments like the Milky Way’s disk. Their inferred masses ( M⊙) and Lyman continuum photon rates ( s-1) dwarf those of their lower-mass analogs in the Local Group. The most massive local SSC analog is R136 in 30 Doradus, with a mass of at least M⊙ (Massey & Hunter, 1998a) and s-1 (Walborn, 1991).
SSCs are found in all galaxy environments, from dwarf irregular starbursts (e.g. NGC 1569, O’Connell et al., 1994) to the prototypical starburst disk galaxy M82 (e.g. O’Connell et al., 1995), to merging systems such as the Antennae Galaxies (NGC 4038/39) (e.g. Whitmore & Schweizer, 1995; Gilbert, 2002), and some have been found in normal spiral galaxies (like NGC 6946 Larsen et al., 2001), whose young clusters typically populate a lower mass range, M⊙ (e.g. Larsen, 2002). Most observations of SSCs have focused on optical wavelengths, but near-infrared (near-IR) imaging has revealed young massive clusters that excite luminous H ii regions (HIIRs) that are invisible at optical wavelengths (e.g. Gilbert et al., 2000; Turner et al., 2003). Narrow-band imaging may also be important to track the faintest youngest members of the population, which may not be detected with broad-band IR imaging although they are bright in narrow filters tuned to the recombination lines of their HIIRs (Alonso-Herrero et al., 2002). Radio and mid-IR observations have uncovered still more heavily embedded regions of massive star formation that are heavily obscured even at 2 m (e.g. Kobulnicky & Johnson, 1999; Beck et al., 2000, 2001; Vacca et al., 2002; Cabanac et al., 2005); these objects are very young, dense, compact HIIRs that are the massive analogs of ultra-compact H ii regions (UCHIIs). Hence they are dubbed ultra-dense HIIRs, or UDHIIs, by Kobulnicky & Johnson (1999), and they are the supposed precursors of optically visible SSCs.
The high masses and stellar densities of SSCs resemble those of globular clusters (GCs), although metal abundances ought to be higher in SSCs than GCs and SSC ages are measured in Myr rather than Gyr. This suggests an evolutionary sequence in massive star-forming regions: UDHIIs become optically visible SSCs (Kobulnicky & Johnson, 1999) that may finally become (metal-rich) GCs. The idea of GC formation in mergers is supported by observations of young GCs (ages of a few Gyr) in several merger remnants (e.g. Schweizer, 1987; Ashman & Zepf, 1992; Fritze-v. Alvensleben & Gerhard, 1994; Schweizer et al., 1996; Schweizer & Seitzer, 1998), as well as the multi-modal color distributions and varied spatial distributions of GCs. However, establishing the relationship between SSCs and GCs requires examination of both the photometric and kinematic properties of the SSC population. By measuring an individual SSC’s age, mass, density profile and initial mass function (IMF), and modeling its stellar and dynamical evolution, one can predict whether it may survive internal and galactic dynamical processes to join a population of GCs (e.g. Ho & Filippenko, 1996; Böker et al., 1999; Smith & Gallagher, 2001; Larsen et al., 2001; Mengel et al., 2002; Gilbert, 2002; McCrady et al., 2003). The IMF of SSCs is especially important for this question because the light of SSCs is dominated by massive stars, while old GCs are comprised entirely of sub-solar mass stars (and stellar remnants). Observations of SSC dynamical masses to date suggest that some SSCs do have normal IMFs and could become GCs, while others cannot (e.g. Sternberg, 1998; Smith & Gallagher, 2001; Mengel et al., 2002; Gilbert & Graham, 2001; McCrady et al., 2003, 2005), although these results could be subject to systematic errors in extinction corrections or neglect of effects like spatial mass segregation, and they always rely on the assumption of cluster virialisation.
Another important issue is the evolution of the SSC population as whole: GC populations have kinematic distributions resembling those of bulges (spheroidal with high velocity dispersions), while SSCs form where gas is available, usually in disk-like environments with much lower dispersions; GCs have log-normal luminosity functions (Harris, 1991), while SSCs display power-law luminosity functions (e.g. Whitmore et al., 1999), as do the giant molecular clouds (GMCs) and H ii regions from which they presumably form (e.g. Williams & McKee, 1997; Kennicutt & Chu, 1988; McKee & Williams, 1997). Simulations have shown that power-law cluster LFs can evolve into log-normal ones as the faint end of the LF is eroded by tidal disruption in the galactic potential, dynamical friction, stellar mass loss, and evaporation of stars from clusters (e.g. Fall & Zhang, 2001).
Whether young SSCs survive to become GCs or disperse completely into the field star population of a galaxy, they have great potential to affect the energetics of its interstellar medium (ISM) because they harbor thousands of massive stars producing ionizing and FUV radiation. The radiation from OB stars excites HIIRs and photodissociation regions (PDRs), and heats the ISM. Their winds and supernova (SN) ejecta stir and inject energy into the surrounding ISM. In the most extreme starbursts, the combined effects of a starburst drive large-scale galactic winds (e.g. in M82, Shopbell & Bland-Hawthorn, 1998) that can eject matter into the intergalactic medium (especially in dwarf galaxies, e.g. NGC 1569, Heckman et al., 1995). SSCs are concentrated power sources for feedback on both star-cluster and galactic scales.
The Antennae (NGC 4038/9) are a nearby pair of disk galaxies in an early stage of merging that are well-known for their numerous SSCs, distributed along their spiral arms and around their interaction region (Whitmore et al., 1999). Their molecular gas distribution peaks at both nuclei and in the overlap region (Stanford et al., 1990), but the gas is not yet undergoing a global starburst typical of more advanced mergers (Nikola et al., 1998). The current global star-formation rate of the system is estimated at about 20 M⊙ yr-1 by Zhang et al. (2001) from extinction-corrected H. ISO observations of the Antennae show that the mid-IR ( m) flux from warm dust follows the optical distribution of bright blue SSCs, but peaks in the overlap region in a single point source that emits 15% of the ISO flux (Mirabel et al., 1998). This source is an optically faint and unremarkable star cluster (Whitmore & Schweizer, 1995) that near-IR observations reveal as one of the youngest ( Myr), most massive ( M⊙) SSCs in the system (Gilbert et al., 2000; Mengel et al., 2001). This cluster powers a dense (average ), large (half-light radius 32 pc) H ii region with a Lyman continuum rate of order s-1; it excites even more extended, clumpy PDRs with nearly fluorescent H2 emission; and it is embedded behind mag (Gilbert et al., 2000).
In § 2 we present near-IR imaging and spectroscopic observations of a sample of young Antennae SSCs in order to identify the emission-line clusters (ELCs) among them. We derive ages and stellar masses for the ELCs from their Br spectra and magnitudes in § 3. In § 4 we compare the widths of the broad, extended Br emission lines of ELCs with the inferred escape velocities of the exciting SSCs, and argue that ELCs drive cluster outflows. In § 5 we estimate electron densities for ELCs, and we compare ELCs with other types of HIIR. We discuss the evolution of ELCs and survival of massive clusters undergoing expansion due to mass loss in § 6, estimate the ELC contribution to the total star-formation rate in the Antennae in § 7, and conclude in § 8. In a companion paper (Paper II, Gilbert & Graham, 2007), we present a kinematic model for the cluster outflows, fit it to the data presented here, and discuss the mass-loss rates and energy budget of ELC outflows relative to similar systems such as superbubbles and galactic superwinds.
2 Observations & Data Reduction
On 2002 January 21 and February 22, we obtained -band spectra of a sample of 17 young SSCs and the nuclei of NGC 4038 and NGC 4039 in the Antennae using NIRSPEC (McLean et al., 2000), a facility near-infrared (m) spectrometer for the Keck-II telescope (McLean et al., 1998). Using the cross-dispersed echelle mode and the N7 order-sorting filter, we detected Brackett with little or no continuum in 16 of the targets with . During the course of these observations we recorded N7 images of the fields around the (3-pixel) slit using NIRSPEC’s slit-viewing camera (SCAM); these images were used to create a mosaicked finding chart of the Antennae field from which offsets between the infrared clusters were measured. Cluster photometry was performed on -band images taken with NIRSPEC’s slit-viewing camera (SCAM) in good seeing ( or better) and photometric conditions on 2000 January 17 and 2001 March 10. We later obtained higher quality VLT ISAAC (Moorwood et al., 1998) narrow-band images at 2.17 and 2.25 m on 11 January 2004 in K-band seeing of ; the former filter includes Br emission and is shown in the finding chart of Figure 1.
2.1 Imaging
The bright northern and southern sources in Figure 1 are the two nuclei in the system, NGC 4038 and NGC 4039. Overplotted are the positions of the brightest young ( Myr old) clusters detected in optical HST images reported by Whitmore et al. (1999). The HST and NIRSPEC data sets were registered using the foreground star at the origin of the figure (Star 4 of Whitmore et al. 1999)111Whitmore et al. (1999) report a position for Star 4 of RA = and DEC = (J2000), although an offset of to the southwest of the HST positions from radio observations Neff & Ulvestad (2000) was reported by Whitmore & Zhang (2002).. Comparing the relative HST positions of the nine cleanly overlapping sources with their relative IR positions yielded a SCAM plate scale of per pixel. This is consistent with the value of measured by Figer et al. (2000). About half of our sample of bright young SSCs does not appear in the optical brightest cluster list due to dust extinction, although most of these sources are detected at least in F814W (see Figure 2). SSC B1 highlights the importance of long-wavelength observations in probing the most recent star formation: it is deeply embedded and quite faint in the optical, with a K-band extinction of at least 1 mag (Gilbert et al., 2000), and it is the most massive young SSC in the system after correcting for this extinction (Table 4).
The -band SCAM images were reduced and calibrated relative to the Persson et al. (1998) standards SJ 9150 and SJ 1952. Aperture magnitudes for the clusters were calculated using DAOPhot (Stetson, 1987) routines in IDL. The fields containing the clusters are complex and it is evident that the accuracy of our photometry is limited by systematics associated with eliminating contributions from unrelated sources and with estimating the local background. In an attempt to reduce these systematic errors we also computed magnitudes based on fitting a 2-d Gaussian to the resolved cluster light profile. The mean difference between the diameter aperture and fitting magnitudes is mag with an rms of 0.2 mag. Inspection of the field confirms that the apertures represent a compromise between isolating the clusters from their environment while encompassing most of the light (point-source aperture corrections were applied using Star 4 of Whitmore et al., 1999). We therefore adopt these magnitudes in what follows and assume 0.2 mag as the rms error. Table 1 lists the magnitudes of the selected targets for spectroscopy. Our photometry agrees with other measurements from the literature: for SSC B1 (known as SSC A by Gilbert et al., 2000), we find K = 14.7 0.2 mag, Gilbert et al. (2000) report N7 = 14.6 mag, and Mengel et al. (2001) report K = mag; for SSC F we find K 0.2 mag and Mengel et al. (2002) report K mag. For SSC S we did not have adequate data for photometry, so we use values reported by Mengel et al. (2002).
The ISAAC images were reduced, corrected for distortion, and combined. Sizes of ELCs and Star 4 were measured via 2D Gaussian and Lorentzian fits, which gave comparable results, and the latter were adopted because they better reproduced the observed profiles. We derived FWHMs from the geometric mean radii of the fits because it is a better indicator than the arithmetic mean of the area in an image that encloses half of the profile’s light. The FWHM of Star 4 was subtracted in quadrature to compute the deconvolved FWHMs that are reported in Table 1 and plotted in Figure 6. Throughout this paper we adopt a redshift distance for the Antennae of 19.2 Mpc ( pc, distance modulus mag for km s-1 Mpc-1), although we note that a smaller distance of 13.8 Mpc has been measured by Saviane et al. (2004) based on the tip of the red giant branch (TRGB) in the southern tail of the Antennae. If the TRGB distance is correct, all linear dimensions discussed in this paper decrease by a factor of 1.4.
2.2 Brackett Spectroscopy
A finding chart similar to that in Figure 1 from prior -band observations permitted the selection of cluster targets for spectroscopy. Targets were chosen on the basis of brightness; whenever feasible we oriented the long slit to encompass multiple clusters.
Table 2 lists exposure times for the targets that are identified in the image of the Antennae in Figure 1. SSCs are named roughly according to the lettering scheme adopted for H-emitting regions in the system by Rubin et al. (1970). Along with the SSCs we observed the two nuclei and detected broad emission in the northern nucleus, NGC 4038, but not in the southern one, NGC 4039, although we did detect broad Br in a faint cluster near the latter nucleus. This off-nuclear source is labeled “A1” in Figure 1 and in Table 3.
Raw exposures were first corrected for electronic noise which appears as horizontal striping in a few of the 32 analog channels. The images were then dark-subtracted (because on-minus-off sky subtraction was not possible for a few exposures), flat-fielded, and corrected for bad pixels and cosmic rays. A wavelength scale was determined from atmospheric OH lines (Rousselot et al., 2000) and used to rectify the Brackett echelle order (order 35), in which spatial and spectral directions are curved, onto an orthogonal grid of wavelength and slit position. In order 35 the spectral resolution measured from OH lines was , or about 12 km s-1 FWHM.
A primary sky subtraction was performed by differencing pairs of frames where possible, and then a secondary sky subtraction was done by fitting and removing the background in each column. Emission-line spectra were optimally extracted using a Gaussian weighting function matched to the spatial extent of the Br emission, and then an aperture correction was applied to recover the full flux.
A B4IV/V star was observed as an atmospheric standard. Although most of our Br spectra were unaffected by atmospheric absorption, at the radial velocities of some objects a small feature absorbs some flux in the wing of the line, so we applied the atmospheric correction in all spectra. A flux scale was derived by requiring the 2.2 m continuum flux of the standard star to equal that corresponding to its K magnitude. Reduced line spectra for the ELCs from which we detected broad Br (excepting only D1) are shown in Figure 3, and position-velocity diagrams for the four brightest ELCs are shown in Figure 4. Signal-to-noise ratios per pixel in the fully reduced spectra ranged from around 3.5 in the weakest lines to 75 in the strongest, with continuum levels low in all but the brightest sources, which have continuum signal-to-noise ratios per pixel of only a few. Sources for which we did not detect Br, clusters 10, 16, and 1 from Whitmore et al. (1999), are not considered further in this paper. We refer to the SSCs with Br emission as emission-line clusters (ELCs).
The Br profiles in Figure 3 are well resolved and exhibit high-velocity non-Gaussian wings. The isothermal sound speed of ionized gas at temperature K is 12 km s-1 where is the mean molecular weight and is the proton mass, so linewidths FWHM = km s-1 are supersonic. Nearly all of the line widths, determined from Gaussian fits to the line cores, are supersonic. Cluster D1 (FWHM = 14 km s-1) is the only Br source without a supersonic component and cluster F is marginal with FWHM = km s-1. We refer to these young SSCs with supersonic Br line widths as broad emission-line clusters (bELCs).
The broad Br lines of ELCs may arise from individual hot stars or dilute photoionized gas. Individual O stars have EW[Br] of only a few Å (e.g. Hanson et al., 1996), while the Antennae clusters have EW[Br] from a few up to a few hundred Å. The observed Br lines are also too narrow to be associated with individual O-star winds, and as already noted, they are too broad (and non-Gaussian) to simply reflect the virial motion of the constituent stars. Thus, photospheric and wind emission from O stars alone cannot explain the intensity or width of Br emission from ELCs. Even though the ELC lines are too narrow to be stellar wind features, WR stars could produce the observed equivalent widths. Figer et al. (1997) measure the combined EW of blended He i, He ii and Br lines from low-resolution IR spectra of WR stars, finding values of about 20–130 Å. However, the line widths are far too narrow to be dominated by WR emission (which has line widths km s-1, e.g. Abbott & Conti, 1987). Thus the ELC line fluxes most likely originate not from gas in photospheres and winds of hot stars, but in the expanding H ii regions that they excite. The broad lines must be formed from rapidly expanding ionized gas swept up by the cumulative effect of stellar winds and photoevaporated flows driven by the thousands of hot stars in the clusters.
Table 3 summarizes the measured Br fluxes, equivalent widths, barycentric radial velocities, and line widths for the ELCs. Our Br radial velocities are consistent with those reported from HST H spectroscopy by Whitmore et al. (2005) for sources in the vicinities of SSCs B, D, and F (a direct cluster-to-cluster comparison is not possible because the slit positions and sizes are different). The listed Br FWHMs are the observed values, not corrected for either the instrumental line-spread function (12 km s-1) or thermal broadening (21.4 km s-1). We also detected He i 3F3G emission at 2.1647 m near the blue wing of Br in the brightest sources (B1, B, C, and D) at a level of % of the Br fluxes. For SSC D2, whose Br emission includes a very narrow component (FWHM = 23 km s-1) as well as a weak broad component (FWHM = 55 km s-1), we list the total line flux but only the line width of the broad part.
We consider the kinematics of the ELC population in the Antennae by computing the rms radial velocity dispersion of the 14 targets in the overlap region. We find a value of km s-1 rms, which is comparable with a disk galaxy’s rms integrated velocity dispersion (Bottema, 1993). Some of this velocity dispersion is due to a general gradient in the north-south direction along the overlap region between the two nuclei (Amram et al., 1992; Gilbert, 2002), but the gradient is not monotonic: both nuclei have higher radial velocities of at least 1600 km s-1 (Amram et al., 1992), and some ELCs lie at minima in H radial velocity, i.e. in H superbubbles (Amram et al., 1992; Whitmore et al., 1999; Zhang et al., 2001). In the northern overlap region, the ELC rms radial velocity dispersion is 21 km s-1 (for eight ELCs) about a mean of 1573 km s-1. In the southern overlap region, the velocity dispersion of six younger ELCs is 48 km s-1, equivalent to that of the giant molecular complexes, (49 km s-1, Wilson et al., 2000) about a mean of 1445 km s-1, so the kinematics of this group reflect those of the nearby molecular material. Velocity dispersions for smaller groupings on scales of , e.g. the two B, three D, five E, or three F clusters, are 21, 56, 22, and 18 km s-1, respectively, which apart from the larger D cluster value are comparable with the raw dispersions for sources over similar spatial scales in Whitmore et al. (2005).
High-resolution near-IR spectroscopy has recently revealed broad supersonic Br emission from massive embedded star-forming regions in two other systems: Turner et al. (2003) observed a deeply embedded radio source in NGC 5253 and Henry et al. (2007) observed two similar sources in Henize , for which they derived Q[H+] values above s-1 and FWHMs of order km s-1. While these dwarf galaxies are different in scale from the merging Antennae disks, their starbursts have much in common: optically visible SSCs that have already disrupted their ISM on large scales (seen e.g. in X-ray and H superbubbles), bELCs that appear to be blowing out of their natal cocoons, and even younger heavily enshrouded star-forming regions seen as radio-bright UDHIIs.
3 Ages & Masses of ELCs
Br fluxes trace the ionized gas within a cluster and hence the young, massive stellar content. We assume that this flux arises from the O/WR stars of a population that formed in a short-lived burst and has an initial mass function (IMF) that is usually characterized as a power law, . Employing a stellar population synthesis model such as Starburst99 (Leitherer et al., 1999) permits an inference of ELC age by comparing observed and predicted Br equivalent widths (EWs) for a cluster as a function of age, and an inference of mass follows from scaling the predicted magnitude of the fiducial M⊙ cluster at the determined age to match the observed magnitude. We assume solar metallicity for the clusters222We note that while Mengel et al. (2002) found a handful of Antennae SSCs to be consistent with having solar metallicity, they argue that one (ELC S, their [W99]-2) may have a supersolar metallicity. and adopt the Galactic field star average IMF of Kroupa (a broken power law with for stellar masses M⊙ and for M⊙, Kroupa, 2001). The slope of this IMF at the high-mass end is nearly equivalent to that of the solar neighborhood IMF of Salpeter (a single power law with , Salpeter, 1955), and is consistent with that measured by Massey & Hunter (1998a) for the massive, dense cluster R136 in the Large Magellanic Cloud.
Those assumptions yield ELC ages of Myr and masses of M⊙(incorporating an extinction correction where possible), as listed in Table 4. The ELC ages have a gradient across the overlap region: the five ELCs that are younger than 6 Myr reside in the southern overlap region where the bulk of the molecular gas is concentrated (e.g. Wilson et al., 2000), and the older sources reside in the northern overlap region. We estimate fit errors for the ages of less than 0.1 Myr and relative errors in masses of 20% for most ELCs (see Table 4). However, more significant than the fit errors may be systematic errors, possible sources of which include the unknown -band extinction for some ELCs, our assumptions that the ELCs are ionization-bounded, and uncertainties in the models. We discuss these possibilities in turn below, and then compare our ages for two ELCs with literature values.
From an ELC Br line flux we derive Q[H+] under case B assumptions for an ionized H ii region at K (e.g. Osterbrock, 1974; Hummer & Storey, 1987). The resulting values are listed in Table 4 where they are uncorrected for extinction, whereas in the text we always adopt the listed extinction corrections where available. ELC B1 has Q[H+] s-1, so it emits nearly half of the total Lyman continuum rate from all 17 ELCs observed: s-1. ELCs B1 and B have Q[H+] at the high end of the range observed for SSCs in other systems (e.g. He region A at s-1, Johnson et al., 2000). UDHIIs are also observed to have Q[H+] values of order s-1 (Beck et al., 2000). The faintest Antennae ELCs in our sample have Q[H+] s-1, which is comparable with the fluxes of the brightest Galactic giant H ii regions (e.g. W43 and NGC 3606).
ELCs can suffer significant extinction even at band, and where estimates are available we include them in Table 4. In the case of ELC B1, Gilbert et al. (2000) measured an extinction at band of mag from Br and 20 Pfund recombination lines. This corresponds to mag for a standard extinction law (Rieke & Lebofsky, 1985). Other authors have inferred lower extinctions to this source: Mengel et al. (2001) derived mag by comparing Br and H fluxes; Whitmore & Zhang (2002) report mag from optical imaging. We use radio continuum flux densities for ELC counterparts (from Neff & Ulvestad, 2000) together with Br fluxes to estimate -band extinctions for a few ELCs (B1, B, D2, and F1) under the assumption that the radio emission is unabsorbed. For ELC B1, our inference of mag (Gilbert et al., 2000) from K-band data agrees with the extinction derived using the radio-IR flux ratio, suggesting that the emitting nebular gas and obscuring dust in the ELC are probably mixed; optical measurements only probe part-way into the emitting region so they underestimate the overall extinction and hence the intrinsic . Turner et al. (2003) find the same bias for the compact, heavily obscured source in NGC 5253: near-IR and radio measurements give a consistent value for the extinction of mag, a value that is six times greater than the optically-determined one. We emphasize that infrared-radio determinations of are more reliable than optical-infrared ones. In Tables 3 and 4 we present observed fluxes and derived masses (uncorrected for extinction). Extinction does not affect the ages since they are derived from extinction-independent equivalent widths.
There is evidence that ionizing photons escape from young clusters in starburst HIIRs (e.g. in He and NGC 4214, Johnson et al., 2000; Leitherer et al., 1996). Photoionization models of GHIIRs require of the Lyman continuum flux to escape (Castellanos et al., 2002). The escape fraction of Lyman continuum photons from Galactic OB associations is estimated at (Dove et al., 2000). Observations of diffuse H emission throughout the Antennae (not only in association with stellar clusters, e.g. Whitmore et al., 1999) may also suggest leakage of Lyman continuum flux from its HIIRs, i.e. that ELCs are density-bounded. Beckman et al. (2000) find that a transition between ionization-bounded and density-bounded HIIRs in spiral galaxies occurs at a constant H luminosity of erg s-1. For Case B recombination this corresponds to a Br luminosity erg s-1, which is below the observed values for all of the ELCs. Presumably such a threshold in a merging pair of disk galaxies is higher than in a spiral because it depends on the available gas supply and the strength of the starburst, both of which are stronger in the overlap region of a merger. If ELCs are density-bounded, then some of their Lyman continuum photons escape to ionize and dissociate the surrounding medium, and our Br measurements would underestimate . We would thus overestimate ELC ages and expect them to be fainter, which would also lead to overestimated masses.
For two sources in our sample, Mengel et al. (2002) measured -band magnitudes and dynamical masses based on high-resolution spectroscopy, and used additional diagnostics with EW[Br], i.e. EW[CO] and EW[CaT], to derive ages for the clusters. We compare our ages with theirs to give an idea of the significance of IMF choice, metallicity, and the level of systematic errors that may be inherent to the observations and Starburst99 models, which we both employ. For ELC S (their cluster [W99]2), we infer an age of Myr using EW[Br], assuming a full ( M⊙) Kroupa IMF at solar metallicity. Mengel et al. (2002) obtain the same age ( Myr) for a Salpeter IMF ( M⊙) at twice solar metallicity. Our measurements of EW[Br] differ by a factor of two (ours: Å, theirs: Å), most likely because we use different apertures: theirs is a 22 box that includes strong diffuse line emission surrounding ELC S (which is not at a peak in H or Br), while our aperture encompasses less diffuse line emission because it is the best-fit Gaussian spatial profile of the cluster Br line, or 09 FWHM for ELC S. In this case the differences in ages due to these other differences (between IMFs, abundances, and even EW[Br]) cancels out to be insignificant. However, the typical size of the age offsets due to these factors is a few tenths of a Myr in the sense that the Salpeter IMF gives an older age than the Kroupa IMF for a given EW[Br], and a larger EW[Br] for the same IMF gives a younger age, while the metallicity difference in age is quite small for this range of EW[Br]. But Mengel et al. (2002) infer that neither of these IMFs may be appropriate for the cluster based on the dynamical mass measurement ( M⊙), which is lower than the photometric mass predicted by the models. This implies that the cluster has less than a full complement of low-mass stars or a shallower IMF slope (Mengel et al., 2002).
In ELC F (their [W99]15), Mengel et al. (2002) measure a high EW[CO 2.29m] of Å. This requires an age 7 Myr, when the brightest supergiants dominate a cluster’s infrared emission. They estimate an age for ELC F of Myr for a Salpeter IMF, while we find Myr for a Kroupa IMF or ( Myr for the same Salpeter IMF), where we both assume solar metallicity. Again the dynamical mass implies that neither of these IMFs is correct, but in the opposite sense to that of ELC S. Mengel et al. (2002) measure a dynamical mass of M⊙, which suggests a steeper than Salpeter IMF slope (2.5 rather than 2.35). The discrepancy between ages determined from Br and those determined from photospheric features of supergiants cannot be explained by our different IMF choices or different magnitudes or extinctions (these are the same). It may be due to different values of EW[Br] determined from different types of data: a spectrum in this work versus narrow-band imaging in theirs, which are subject to different difficulties in removing diffuse stellar and nebular backgrounds. The discrepancy may also be due to diverging model predictions for our differing spectral diagnostics. Strong Br from O stars and CO absorption in supergiants are not found simultaneously in the spectrum of a single-aged stellar population based on the latest tracks used in Starburst99. However, these are single-star evolutionary tracks, so the models do not yet account for binary systems (in which most stars are thought to reside) or the interactions between binaries and stars in cluster environments, e.g. mass transfer, wind-wind interactions, etc. Finally, SSCs may not form instantaneously, but rather over the course of several Myr, and if SSCs observed at large distances are actually unresolved clusters of clusters then they could have larger age spreads–on scales similar to the ELC sizes, 30 Doradus has an age range of about 25 Myr due to propagating star formation: R136 contains low-mass stars with ages of Myr and massive stars with ages of Myr (Massey & Hunter, 1998b), while nearby Hodge 301 ( pc away) harbors supergiants with ages of Myr (e.g. Grebel & Chu, 2000). We view ELC F and 30 Dor as a warning that ages determined via single-star, single-aged population synthesis models may have systematic errors of a few Myr at ages near the end of the O star era, and proceed with this caveat in mind.
4 Mass Loss from ELCs
With mass estimates for the ELCs in hand, we now assess the ability of the ELCs to gravitationally bind their H ii gas by comparing the observed Br line widths of ELCs with their escape velocities , which depend upon cluster mass and size. We can write in terms of the 1D stellar velocity dispersion of a virialized cluster as . The virial relation can be expressed as , where is the projected half-light radius and is a constant that depends upon the mass distribution of the cluster (e.g. Spitzer, 1987). The value of is often taken to be about 10, although for a range of realistic globular cluster concentration parameters, , Mengel et al. (2002) found that (more concentrated clusters have smaller ). Boily et al. (2005) calculated the time evolution of in SSCs using a gas-dynamical model that incorporates stellar evolution; they found that in low-density clusters, does not change much over the first 10 Myr, but in intermediate- and high-density clusters that resemble M82-F and R136 in 30 Doradus, respectively, increases by factors of about and , while the clusters grow more compact and decreases. An increasing implies a decreasing , which makes it progressively easier for H ii gas to escape from a cluster. If the measured equals or exceeds , then the cluster cannot gravitationally bind the high-velocity ionized gas in the line wings, which has sufficient energy to escape from the cluster potential in an unbound outflow (in the absence of a confining external pressure). For the two ELCs (S and F) whose were measured by Mengel et al. (2002), we can directly compare and . Assuming that the measured represents a virial velocity dispersion, ELC S has km s-1 and km s-1 (corrected for the instrumental line profile, Table 3), so most of its gas is not bound to the cluster. If the other ELCs in Table 3 share this typical value for an SSC stellar velocity dispersion, then nearly all of them have predominantly unbound gas. ELC F has the second-lowest intrinsic nebular line width at km s-1, and it has km s-1, which suggests that most of its gas is bound to the cluster. If mass segregation is present in these ELCs, then the measured would be an underestimate of the true value because it is dominated by the light of massive, centrally concentrated stars. In that case, ELCs S and F would be better able to bind their nebular gas.
In order to estimate escape velocities for the other ELCs, we consider the mass of both the cluster’s stellar component (implied by Starburst99 for a Kroupa IMF extending from 0.1 to 100 M⊙, § 3) and its ionized gas component (whose mass ranges from 0.01 to 2.6 times the stellar mass333The ionized gas mass is deduced from outflow model fits in Paper II, §2.3 and Table 1.). We adopt an extinction correction where possible (as in Table 4), and we assume that stars and gas fill the same volume out to the smaller of the half-light radii measured from the 2.17 and 2.25 m FWHMs (see Figure 6 and Table 1). These assumptions are conservative in the sense that they place the total amount of mass available in the minimum volume, which leads to an upper limit for . Adopting a value of , we derive escape velocities for most sources that are well below the observed H ii line widths: ranges from 0.1 to 0.3 for all ELCs except the two clusters with the narrowest Br emission (i.e., all bELCs have ). The exceptions are ELC F, which we have already concluded can bind its gas, and ELC D1, which has the narrowest Br line in the sample, and . A more conservative estimate of the gas boundedness comes from assuming that most of the ELC mass is actually concentrated in a 4 pc radius (median value for SSC effective radii in Whitmore et al., 1999) that is unresolved in our data; this leads to higher values of for bELCs, but still suggests that much of the HII gas in the observed profiles is not bound to the clusters. If we consider both this smaller radius and decrease to the minimum value of 5.6 that corresponds to a high-concentration globular (Mengel et al., 2002), then the ratios for ELCs B1, B, and E5 rise to , while those of the remaining bELCs are in the range . Thus even with the most compact mass distribution that we imagine they could have, even in the ELCs with the largest ratios, the high-velocity gas in the broad line wings would be unbound. This suggests that a significant fraction of the ionized gas in bELCs is unbound and may be outflowing, but that narrow-lined ELCs can gravitationally bind their HIIRs and do not drive outflows.
An exception to this rule may be the compact, embedded broad-line source in NGC 5253 (Turner et al., 2003) that resembles the Antennae bELCs in terms of line width, mass, and luminosity. Although its Br line is very broad (76 km s-1 FWHM) and hence supersonic, it appears to be compact enough to bind its H ii gas if the most conservative choices for and half-light radius (the smallest radio semimajor axis is 0.5 pc) are adopted for a M⊙ cluster (Turner et al., 2003); in this case, km s-1, which greatly exceeds the measured line width, and leads to the conclusion that the cluster easily binds its UDHII. However, if we assume and use the -band size of the nebula to delineate the Br-emitting region (1 pc radius for their H2, Alonso-Herrero et al., 2004) rather than the radio size, then we find km s-1. This would suggest that plenty of gas in the Br line wings has adequate energy to escape the cluster’s potential well. Either way, the NGC 5253 cluster is far more compact than the Antennae ELCs; this difference may be due to a higher ISM pressure in NGC 5253 that confines the UDHII at high density and prevents any significant outflow of gas.
In the foregoing discussion we have assumed that the stars in ELCs are distributed like their infrared light. The -band half-light radii of ELCs range from about 10 to 50 pc, measured either in the continuum narrow-band filter at 2.25 m, which is dominated by starlight (Table 1), or in the 2.17 m filter, which also includes Br nebular emission (Figure 6). ELC radii are up to an order of magnitude larger than the median effective radius of optically visible SSCs of all ages in the Antennae (4 pc), measured from HST images (Whitmore et al., 1999, and see Figure 1). Mengel et al. (2002) measured an effective radius of pc for the apparent optical counterpart of ELC F from the -band HST observations, and they found similar values up to 6 pc for a few other optically revealed clusters. However, Mengel et al. (2005) reported that the mean -band effective radius is 16 pc (with a standard deviation of 15 pc) for seven isolated young (age Myr) Antennae clusters. The 2.25 m half-light radii of ELCs B1, B, and D, whose ages are below 4 Myr, are 29, 49, and 40 pc, respectively (Table 1, Figure 6). Thus young clusters are intrinsically large at visible wavelengths even at the WFPC2 resolution of . Most ELCs are resolved in our near-infrared images (with point source FWHM of in the combined frames, see Fig. 5), but what we view as a single source could break up into multiple sources when viewed with better angular resolution. In order to check this, we examined archival optical and near-IR HST images of several ELCs together with ISAAC ones: Figure 2 shows that while some ELCs consist of multiple sources, even at the finest spatial resolution they tend to be dominated by a single bright one. ELC B, for example, is comprised of a very bright source in band surrounded by fainter emission and at least one neighboring source to the southwest, but there are a handful of spatially coincident sources in HST filter F555W (Figure 1 inset, Whitmore et al., 1999); it may be a cluster of clusters. ELC B1 is a single bright source (like most other ELCs) in band and a very faint one in . Caution must be exercised in attempting to match sources observed at different wavelengths and resolutions, especially when extinction can be important.
The position-velocity diagrams in Figure 4 show that the Br emission in ELCs B1, B, and D has spatial and velocity structure. ELC C, which appears complex and diffuse in optical and near-IR images, also has extremely extended spatial and velocity structure in Br with a very weak continuum that is centered between its high- and low-velocity ’lobes’; it may comprise several cluster components, or it may be driving a bipolar outflow. Figure 6 shows that most (but not all) bELCs have slightly more extended emission in the 2.17 m filter, which includes Br, than in the 2.25 m filter, and that there is a weak tendency for the ratio of 2.17 m to 2.25 m sizes to increase with age. An HIIR might have more extended line than continuum emission (which is dominated by stars) because Lyman continuum photons are escaping to ionize the surrounding ISM, and this may produce some of the observed extended emission of ELCs. However, another process that would produce extended line emission is the escape of ionized gas in an outflow, which is suggested by the high velocities of some of the extended Br relative to the line centers, as well as the double-lobed appearance of ELC C in Figure 4. An increase in Br-to-continuum size ratio with bELC age could be due to expansion of an outflow into the surrounding ISM and/or contraction of the stellar cluster with time (see § 6).
5 The Nature of ELC HIIRs
It is useful to compare the HIIRs that are excited by ELCs with three familiar catagories of HIIRs (Galactic compact and ultra-compact HIIRs ((U)CHIIs), Galactic HIIRs, and extragalactic GHIIRs), as well as with the recently discovered class of UDHIIs (Kobulnicky & Johnson, 1999). We will discuss four properties that distinguish different types of HIIRs: luminosity (in the form of ), line width, size, and electron density .
We presented values for ELCs in § 3 and discussed the Br line widths of ELCs in § 4; we now place bELCs (excluding the narrow-lined ELCs D1 and F) in context with other HIIRs by plotting their vs. H i recombination line widths (with instrumental and thermal components, assuming a K HIIR, removed), together with data for other objects in Figure 7. The luminosity of 30 Doradus in the LMC is taken from Walborn (1991) and its integrated H line width inferred from the spatially resolved echelle spectroscopy of Chu & Kennicutt (1994). The luminosity and Br width for the ELC-like source in NGC 5253 are from Turner et al. (2003). For the UDHIIs in He the values are derived from the radio data of Johnson & Kobulnicky (2003), and the line width adopted is the typical value of about 55 km s-1 observed for Br (corrected for instrumental and thermal contributions, which resembles bELC line widths) in several slits that overlap with several of the radio sources (Henry et al., 2007). The line widths for a sample of (U)CHIIs from Garay & Lizano (1999) are for H i radio recombination lines. The sample of top-ranked GHIIRs in nearby galaxies is from Arsenault & Roy (1988), who compiled H line widths, luminosities, rms values, and diameters from the literature. We assume case B recombination to determine values from line fluxes. Figure 7 shows bELCs at the high end of the range in and FWHM, where they overlap with the GHIIRs, which are characterized by supersonic linewidths (Smith & Weedman, 1970) and s-1. Galactic (U)CHIIs have much lower luminosities because they are powered by just one or a few massive stars ( s-1, Garay & Lizano, 1999), but their line widths overlap with those of the brighter HIIRs. Not shown are common Galactic HIIRs, which exhibit narrower H recombination line FWHMs of km s-1 and s-1 (Churchwell et al., 1978). A loose correlation between FWHM and is evident, and its slope for bELCs is consistent with that reported for GHIIR populations of nearby spirals (i.e. NGC 4449 and NGC 4321, Arsenault et al., 1990; Rozas et al., 1998; Fuentes-Masip et al., 2000).
We also compare measurements of size (diameter ) and for several types of HIIRs in Figure 7. The variations in and within the (U)CHII, UDHII, and bELC populations extend along tracks of constant for a constant-density Strömgren sphere: (solid lines in Figure 7), while GHIIRs cover a broader range in values. While GHIIRs are similar to bELCs in terms of luminosity or inferred stellar mass, they are larger ( pc) and much less dense (e.g. ELC B1 has cm-3 from [Fe iii] ratios, Gilbert et al., 2000, and see below). GHIIRs have rms densities of a few to a few cm-3 (derived from emission measure profiles), but forbidden-line diagnostics, e.g. [S ii] and [O ii], yield densities that are ten times greater (e.g., Kennicutt, 1984). This range of densities is commonly interpreted as evidence for clumpiness of the HIIRs, and it suggests filling factors of dense gas of (Kennicutt, 1984). Such a variable-density medium in GHIIRs is certainly plausible: inhomogeneities are common in resolved HIIRs like 30 Dor (Chu & Kennicutt, 1994, e.g.), and density variations have been measured in both Galactic and extragalactic HIIRs (Copetti et al., 2000; Castaneda et al., 1992).
(U)CHIIs are included in Figure 7 because they represent extremes in all of the plotted parameters. Although their low values, small implied stellar masses, and sub-parsec sizes clearly differentiate Galactic (U)CHIIs from GHIIRs and bELCs, their extremely high densities are similar to that of ELC B1: compact (diameter pc) and ultra-compact ( pc) HIIRs have ranging over cm-3 (Wood & Churchwell, 1989). Common Galactic HIIRs (not plotted) have comparable luminosities to those of (U)CHIIs, but they are larger ( pc) and have slightly lower densities ( cm-3) than their compact cousins. Moreover, UCHIIs have dynamical ages indicating extreme youth (5000 years, Wood & Churchwell, 1989), although they could live much longer ( years) (Garay & Lizano, 1999), so the UCHIIs may be the precursors of common HIIRs. The bELCs appear to be Myr old (§ 3) and therefore much more evolved than UCHIIs, yet they are clearly more compact and perhaps at an earlier stage of evolution than the diffuse GHIIRs.
We estimate a volume-averaged for all ELCs by assuming ionization and recombination balance for a K HIIR with Q[] (extinction-corrected, where possible) from Table 4 along with their Br sizes (i.e. the FWHM measured in our 2.17 m narrow-band image, see Figure 6). The resulting values range from 30 to 600 cm-3 with an average of 180 cm-3, and they represent lower limits on the electron densities of ELCs. For the four bELCs that have thermal radio counterparts, Neff & Ulvestad (2000) compute similar rms values of cm-3 by assuming measured diameters of up to pc (which in some cases gives an upper limit on size and lower limit on because the sources are not resolved by their pc beam). Neff & Ulvestad (2000) also consider the possibility that their thermal radio sources have pc diameters that are nearer to those observed for SSCs ( pc, Whitmore et al., 1999), and thereby obtain higher estimates of cm-3. If the -band emission from ELCs is concentrated in compact, unresolved cores that are the size of the optical SSCs, then the density estimates would increase correspondingly, to cm-3 with a mean of 2250 cm-3; the maximum value is that of ELC B1, and it is consistent with the range inferred from [Fe iii] ratios by Gilbert et al. (2000). Thus the radio-inferred densities for a subset of ELCs are comparable with the IR-inferred ones. For consistency, the values plotted in Figure 7 are the lowest (rms ) estimates for GHIIRs, ELCs, and UDHIIs, which we discuss next.
We estimate densities for the UDHIIs of He in the same way as for the ELCs, using the values from 0.7 cm data of Johnson & Kobulnicky (2003) and the 10 m sizes of Vacca et al. (2002), where we combine their objects 1 and 2 since they are blended in the observations of the latter work. Thus we assume that the mid-IR and near-IR sizes are comparable, and that the stars and warm dust share the same volume. We find densities for the two compact UDHIIs (4 and 5, with radii of 4 and 5 pc) of 2200 and 1280 cm-3. For the two larger UDHII regions (1+2 and 3, with radii of 16 and 17 pc), we find and 180 cm-3. The lowest estimates of average ELC densities are thus similar to those of the more extended UDHIIs in He , and the SSC-size estimates are similar to those of the compact UDHIIs.
However, Vacca et al. (2002) do not assume that the stars and warm dust in UDHIIs share the same volume; they estimate for the He UDHIIs by fitting the radio-NIR SEDs. Vacca et al. (2002) model a UDHII as a central HIIR that envelopes a young SSC and extends out to the inner radius of a surrounding annular dust cocoon that extends to an outer radius. Their best-fit inner radii are similar to the sizes of optical SSCs, pc, and they are consistent with fits to more recent radio data of Johnson & Kobulnicky (2003). This leads to average values for of cm-3, which agree well with the radio estimates of the average from Kobulnicky & Johnson (1999) and Johnson & Kobulnicky (2003). For the compact radio counterpart of the NGC 5253 HIIR, Turner et al. (2000) report an even larger estimate of the rms of cm-3, which is in the range of UDHII . Adopting the higher estimates of for UDHIIs or bELCs444We discuss further evidence for high-electron-density material in bELCs in Paper II, where we derive radial density distributions for the bELC HIIRs by fitting the Br profiles with a kinematic model for a cluster outflow; this yields even higher values for the emissivity-weighted average : cm-3. would move them toward to the (U)CHIIs in the panel of Figure 7, while adopting the higher estimates for GHIIRs would move them up; the figure would still display a strong anticorrelation between and diameter in which bELCs and UDHIIs occupy a central region that is distinct from that of the other massive systems plotted, the GHIIRs.
Although the populations of HIIRs that are discussed above exist in a variety of environments and were all observed in different ways and subject to different selection effects from ELCs, their comparison shows how ELCs fit into the broader context of star formation. Their nearest relatives are the UDHIIs, whose Lyman continuum luminosities and electron densities are similar, but UDHIIs are so heavily obscured that they are rarely visible in the optical range and are thought to be younger than ELCs. UDHIIs are classified based on their radio properties, and ELCs based on their recombination lines, but we have already conflated the two groups by assuming the Br line fluxes of Henry et al. (2007) emerge from the radio/MIR sources of Kobulnicky & Johnson (1999) and Vacca et al. (2002). That is because all evidence suggests that ELCs and UDHIIs represent the same objects, perhaps at slightly different evolutionary stages, so that massive clusters form within gas- and dust-shrouded UDHIIs, which become ELCs as their massive hot stars drive winds (that are visible in recombination line emission) and expel gas to reveal young SSCs with low extinctions at visible wavelengths. If these massive clusters form hierarchically from clusters of subclusters (e.g. Testi et al., 2000; Bonnell et al., 2003), then the ELCs may be comprised of several evolving UDHIIs that our data cannot resolve. We conclude that bELCs and UDHIIs have some properties in common with other types of HIIRs, but taken together, their broad lines, high densities, intermediate sizes, and large luminosities constitute a new class of massive HIIRs that is distinct from GHIIRs.
While our small sample spans two orders of magnitude in and inferred cluster mass, it may represent only the bright end of the full young cluster population in the Antennae. If the mass function of young clusters in the Antennae starburst reaches down to single-star scales, would those objects resemble Galactic UCHIIs? The analogy between UCHIIs and UDHIIs may extend beyond extreme densities, compactness, and extinctions: the massive stars within UCHIIs are thought to spend % of their main-sequence lifetimes in an embedded phase (Wood & Churchwell, 1989), and those in UDHIIs may spend even longer fractions of their lives hidden from optical view, e.g. 15 % in He (Kobulnicky & Johnson, 1999) to 40 % in NGC 5253 (Martín-Hernández et al., 2005), until their cluster winds remove much of the obscuring gas. Such an extended embedded phase for massive stars in starbursts is proposed to explain discrepancies between measured mid-IR line ratios and stellar population synthesis models with normal upper mass limits by Rigby & Rieke (2004), who point out that the higher ISM pressures in starbursts should lengthen their embedded compact HIIR phase relative to that in the Galaxy. The implications of a long embedded phase in which IR nebular lines are suppressed are serious for starburst population synthesis modeling (Rigby & Rieke, 2004).
6 Evolution of ELCs
In an evolutionary sequence determined by cluster age and embeddedness, massive stellar clusters form in heavily obscured UDHIIs, evacuate their surroundings as wind-blowing ELCs, and, if they survive the mass-loss phase, emerge as SSCs, which may ultimately become GCs if they survive further destructive cluster dynamical processes and tidal interactions with their host galaxy. This scenario requires some explanation of cluster size evolution, in particular how the large -band radii of ELCs ( pc, Table 1 and Figure 6) can be reconciled with the typical half-light radii of optically revealed SSCs ( pc in the Antennae, Whitmore et al., 1999). We assume that ELCs are young SSCs embedded in HIIRs because their inferred stellar masses are similar to those of SSCs, which can be factors of a few to ten times more compact than ELCs. Figure 6 shows a wide scatter in the 2.25 m stellar continuum sizes of 10 ELCs at ages of Myr: their mean ( standard deviation) half-light radius is pc. Younger ELCs (5 have ages of Myr) have a larger mean half-light radius of pc at 2.25 m. Additional evidence for a decrease in Antennae cluster size with age, as well as a large scatter in size, is presented by Mengel et al. (2005), who report average ( standard deviation) WFPC2 -band effective radii for 18 isolated clusters with ages below 4 Myr and in the range Myr of pc and pc, respectively.
This tendency of older clusters to be more compact could be explained by cluster contraction with age or by the preferential survival of more concentrated clusters at any given age. Clusters that form hierarchically would contract as subclusters merge to form a single cluster. Simulations by Bonnell et al. (2003) show that star clusters may form hierarchically, such that fragmentation in a molecular cloud produces sheets and filaments which form stars before the rest of the cloud material, and these stars form high-density subclusters that merge after several free-fall times to create a centrally condensed cluster. Observations of the Serpens molecular cloud core provided the first evidence for hierarchical cluster formation: Testi et al. (2000) find that star formation is not homogeneous in the core, but rather is concentrated in dense subclusters that are well separated spatially and kinematically. If ELCs are young enough to be undergoing the final merger of their initial subclusters, this might explain their size trend in Figure 6.
However, even if hierarchical formation is still underway in ELCs and causing contraction, it must compete with the countervailing influence of mass loss due to stellar winds that lead to cluster outflows. Cluster expansion is caused by the loss of gas via stellar evolution and stars via relaxation, tidal stripping, and dynamical friction. Mass loss and consequent expansion can unbind a cluster and cause it to dissolve below detection limits into the background stellar population (see Fall & Zhang, 2001, for an analysis of these effects across the cluster mass spectrum); hence compact clusters live longer than less compact ones, and they increasingly dominate the cluster population as they age. Two recent studies of the age distribution of stellar clusters in the Antennae argue that the sharp decrease in the number of clusters as a function of age is strong evidence for rapid dissolution of the majority of young clusters on timescales of order 10 Myr (Mengel et al., 2005; Fall et al., 2005). Thus we favor expansion and rapid dissolution over contraction due to hierarchical formation in explaining the smaller sizes of older ELCs.
Large ELCs may therefore be puffed-up young SSCs that have expanded due to prodigious mass loss, which limits their chances for survival if they are not compact enough, if their IMF is top-heavy or truncated at low masses, or if their star-formation efficiency (SFE) is not high enough. Boily & Kroupa (2003) simulate cluster evolution in the presence of rapid (i.e. instantaneous) mass loss; after equilibrium is re-established, they find expansion factors for the half-mass radii of up to a factor of ten or more for bound clusters having Plummer and King distribution functions with varied concentrations and assumed SFEs. This is a plausible explanation for the sizes of ELCs if they were born as more compact clusters within UDHIIs; however, the mass loss in ELCs proceeds over the course of at least several Myr, so they would not suffer such extreme expansion as the clusters simulated by Boily & Kroupa (2003).
The expansion of young clusters due to dynamical evolution is observed in nearby resolved clusters: cluster core radii in the LMC and SMC increase with age, at varying rates, up to ages of at least 1 Gyr (Elson et al., 1989; Mackey & Gilmore, 2003a, b). These young clusters ( yrs old) have power-law luminosity profiles that often show bumps or dips that suggest the presence of substructures that have not been smoothed out by relaxation (Elson et al., 1987; Mackey & Gilmore, 2003b, a). These profiles do not display the tidal truncation of a King profile (King, 1966), which best describes the luminosity profiles of much more evolved GCs. There is evidence that the more massive SSCs in nearby galaxies also have power-law light profiles, some extending beyond 100 pc in radius, some with clumpy substructure (see references in Schweizer, 2004); evidence for the onset of tidal truncation in older SSCs (beyond a few 100 Myr) and intermediate-age GCs has also been found (Whitmore et al., 1999; Schweizer, 2004). Larsen (2004) finds that extended envelopes relative to King profiles are common among the youngest clusters in a sample of spiral galaxies observed with HST WFPC2, but his sample does not show the trend of increasing cluster radii with age that is seen in the LMC and SMC.
The interpretation of large ELCs as puffed-up SSCs that are caught in the act of dissolving assumes that their -band light at large radii is dominated by stellar continuum emission. Alternative explanations for their sizes might, however, involve dust scattering and emission from a shell at larger radii surrounding an SSC-sized cluster, or differential extinction that preferentially obscures the cluster core relative to its outer radii, making the observed FWHM larger than the intrinsic one. A final possibility is that SSCs may form hierarchically from clusters of smaller subclusters that merge rapidly to make a single massive cluster (within a couple of free-fall times for a low-mass cluster, Bonnell et al., 2003); in this picture, prior to the final merger into a single cluster, the average stellar density is smaller than in individual subclusters, and the overall structure is probably not spherically symmetric. Observations at higher angular resolution at infrared wavelengths, either space-based or adaptive optics-assisted, will be able to test these scenarios.
7 Star Formation in Massive Clusters
Comparing the star-formation rate (SFR) in ELCs with that of the entire system is difficult because the SFRs of galaxies are determined from observed quantities such as H and far-infrared (FIR) luminosities averaged over large spatial scales, and they consider continuous star formation (e.g. Kennicutt, 1998). Assuming the calibrations of Kennicutt (1998), adopting an IRAS luminosity of L⊙ for the Antennae leads to an SFR M⊙ yr-1; Zhang et al. (2001) use Kennicutt’s H calibration to estimate SFR M⊙ yr-1. If we apply this H calibration to the sample of ELCs by assuming case B recombination, we derive a total SFR of 3.2 M⊙ yr-1. Thus the fraction of the recent SFR of the Antennae that is provided by ELCs is at least 15%, and half of this contribution is provided by ELC B1 alone. This is a lower limit because we have neglected extinction in two-thirds of the ELCs, our sample probably does not include all ELCs, and there could be a significant escape fraction for ionizing photons from the clusters. From a photometric study of the current star cluster population in the Antennae, Mengel et al. (2005) estimate a total SFR in clusters over the past 25 Myr of at least 20 M⊙ yr-1 (in agreement with the H estimate for all star formation), but they argue that the age distribution of SSCs implies rapid dissolution of most clusters, and that accounting for this could raise the SFR to at least 50 M⊙ yr-1.
An estimate of the fraction of stars that are formed in clusters rather than in the field may be derived from imaging observations that compare amounts of discrete and diffuse emission from star-formation tracers: Fischer et al. (1996) reported that about 70% of the Br emission in a 30″ aperture including the nucleus of NGC 4039 and the southern overlap region is diffuse, while the remaining 30% is associated with H and radio knots. Similarly, Hummel & Van Der Hulst (1986) report that the total fraction of radio continuum emission from discrete knots (at 6″ resolution) is about 35%, with errors of %. Our lower limit to the fraction of the star-formation rate in ELCs is about half of what one might expect from these imaging studies. These results are consistent with the range deduced from UV observations of samples of starbursts: about 15–50% of the UV light is typically associated with stellar clusters (e.g. Meurer et al., 1995; Maoz et al., 1996). Radio continuum imaging of the Wolf-Rayet starburst He 2-10 reveals that 15% of the O stars in the galaxy reside in UDHIIs (Kobulnicky & Johnson, 1999), which are probably the progenitors of ELCs and SSCs. Since our measurement is a lower limit on the fraction of star formation in Antennae clusters, it appears that ELCs constitute the majority of the clustered star-formation rate in the Antennae, and at least 15% of the H-derived total SFR.
The actual proportion of clustered star formation in the Antennae may be nearer to 100% if many of the young SSCs are quickly dissolved or disrupted (e.g. Mengel et al., 2005; Fall et al., 2005). Whitmore et al. (1999) find a power-law form for the luminosity function for Antennae SSCs that closely resembles that of other SSCs in other starbursts (see e.g. Meurer, 1995; Larsen, 2002) as well as that of OB associations and GHIIRs (e.g. Kennicutt et al., 1989; McKee & Williams, 1997). Many of the low-mass SSCs must dissolve into the field population in order for a power-law SSC population to evolve into a log-normal globular cluster population; simulations indicate that this is plausible (Fall & Zhang, 2001), and observations have begun to reveal the process (e.g. de Grijs et al., 2003; Lamers et al., 2005). Indeed, Mengel et al. (2005) and Fall et al. (2005) argue that rapid dissolution into the field population is the normal fate for SSCs in the Antennae; those that survive mass loss in the ELC phase are subject to further destructive dynamical and evolutionary processes that may prevent them from becoming GCs.
8 Conclusions
High-resolution spectroscopy of the youngest SSCs in the Antennae reveals broad, spatially extended, non-Gaussian, supersonic Br emission ( km s-1 FWHM) in the ELCs. Typical GHIIRs also have supersonic linewidths and luminosities at the low end of the ELC ranges, but they are much larger and less dense than ELCs, and are generally excited by lower-mass clusters and OB associations. Thus ELCs appear to represent a different class of dense extragalactic HIIR that is powered by young SSCs and may be associated with high-pressure environments. Their closest relatives are the UDHIIs, which are younger (age Myr), more heavily embedded radio and mid-IR nebulae with high electron densities. UDHII Lyman continuum luminosities and infrared sizes are similar to those of ELCs, so UDHIIs require similar stellar masses for their embedded ionizing clusters as ELCs, M⊙. Thus UDHIIs are the probable precursors of ELC.
The youngest ELCs (ages Myr) are concentrated in the southern overlap region of the Antennae, while those in the northern overlap region are slightly older ( Myr). The rms radial velocity dispersion of the youngest ELCs is consistent with that measured for molecular gas via CO in the same region, so the young clusters and dense gas share similar kinematics. ELCs in our incomplete sample comprise about 15% of the current SFR in the Antennae (half of that is concentrated in the brightest cluster) and they make up a significant fraction of the expected clustered star formation in the system.
Because bELC Br linewidths typically exceed the most conservative estimates of the cluster escape velocities, much of the H ii gas is not bound to the clusters–it is flowing out in a cluster wind. The greater extent of Br emission relative to continuum emission is consistent with escape of ionized gas in winds. Although this mass loss takes place over the course of several Myr rather than instantaneously, it may be dramatic enough to prevent some of the ELCs from surviving as bound SSCs; their large -band sizes and the decrease in mean ELC size with age may be the signature of rapid cluster expansion and dissolution, which leads to the preferential survival of the most compact clusters in each age group. In Paper II we present a kinematic model for cluster outflows to infer their mass-loss rates and energetics, and discuss ELC feedback in the context of similar systems such as wind-blown superbubbles and galactic superwinds.
References
- Abbott & Conti (1987) Abbott, D. C. & Conti, P. S. 1987, ARA&A, 25, 113
- Alonso-Herrero et al. (2002) Alonso-Herrero, A., Rieke, G. H., Rieke, M. J., & Scoville, N. Z. 2002, AJ, 124, 166
- Alonso-Herrero et al. (2004) Alonso-Herrero, A., Takagi, T., Baker, A. J., Rieke, G. H., Rieke, M. J., Imanishi, M., & Scoville, N. Z. 2004, ApJ, 612, 222
- Amram et al. (1992) Amram, P., Marcelin, M., Boulesteix, J., & Le Coarer, E. 1992, A&A, 266, 106
- Arsenault & Roy (1988) Arsenault, R. & Roy, J.-R. 1988, A&A, 201, 199
- Arsenault et al. (1990) Arsenault, R., Roy, J.-R., & Boulesteix, J. 1990, A&A, 234, 23
- Ashman & Zepf (1992) Ashman, K. M. & Zepf, S. E. 1992, ApJ, 384, 50
- Böker et al. (1999) Böker, T., van der Marel, R. P., & Vacca, W. D. 1999, AJ, 118, 831
- Beck et al. (2001) Beck, S. C., Turner, J. L., & Gorjian, V. 2001, AJ, 122, 1365
- Beck et al. (2000) Beck, S. C., Turner, J. L., & Kovo, O. 2000, AJ, 120, 244
- Beckman et al. (2000) Beckman, J. E., Rozas, M., Zurita, A., Watson, R. A., & Knapen, J. H. 2000, AJ, 119, 2728
- Boily & Kroupa (2003) Boily, C. M. & Kroupa, P. 2003, MNRAS, 338, 673
- Boily et al. (2005) Boily, C. M., Lançon, A., Deiters, S., & Heggie, D. C. 2005, ApJ, 620, L27
- Bonnell et al. (2003) Bonnell, I. A., Bate, M. R., & Vine, S. G. 2003, MNRAS, 343, 413
- Bottema (1993) Bottema, R. 1993, A&A, 275, 16
- Cabanac et al. (2005) Cabanac, R. A., Vanzi, L., & Sauvage, M. 2005, ApJ, 631, 252
- Castaneda et al. (1992) Castaneda, H. O., Vilchez, J. M., & Copetti, M. V. F. 1992, A&A, 260, 370
- Castellanos et al. (2002) Castellanos, M., Díaz, Á. I., & Tenorio-Tagle, G. 2002, ApJ, 565, L79
- Chu & Kennicutt (1994) Chu, Y. & Kennicutt, R. C. 1994, ApJ, 425, 720
- Churchwell et al. (1978) Churchwell, E., Smith, L. F., Mathis, J., Mezger, P. G., & Huchtmeier, W. 1978, A&A, 70, 719
- Copetti et al. (2000) Copetti, M. V. F., Mallmann, J. A. H., Schmidt, A. A., & Castañeda, H. O. 2000, A&A, 357, 621
- de Grijs et al. (2003) de Grijs, R., Bastian, N., & Lamers, H. J. G. L. M. 2003, ApJ, 583, L17
- Dove et al. (2000) Dove, J. B., Shull, J. M., & Ferrara, A. 2000, ApJ, 531, 846
- Elson et al. (1987) Elson, R. A. W., Fall, S. M., & Freeman, K. C. 1987, ApJ, 323, 54
- Elson et al. (1989) Elson, R. A. W., Freeman, K. C., & Lauer, T. R. 1989, ApJ, 347, L69
- Fall et al. (2005) Fall, S. M., Chandar, R., & Whitmore, B. C. 2005, ApJ, 631, L133
- Fall & Zhang (2001) Fall, S. M. & Zhang, Q. 2001, ApJ, 561, 751
- Figer et al. (2000) Figer, D. F., Becklin, E. E., McLean, I. S., Gilbert, A. M., Graham, J. R., Larkin, J. E., Levenson, N. A., Teplitz, H. I., Wilcox, M. K., & Morris, M. 2000, ApJ, 533, L49
- Figer et al. (1997) Figer, D. F., McLean, I. S., & Najarro, F. 1997, ApJ, 486, 420
- Fischer et al. (1996) Fischer, J., Shier, L. M., Luhman, M. L., Satyapal, S., Smith, H. A., Stacey, G. J., Unger, S. J., Greenhouse, M. A., Spinoglio, L., Malkan, M. A., Lord, S. D., Miles, J. W., Shure, M. A., Clegg, P. E., Ade, P. A. R., Armand, C., Burgdorf, M., Church, S. E., Davis, G. R., di Giorgio, A., Ewart, D., Furniss, I., Glencross, W. M., Gry, C., Lim, T., Molinari, S., Nguyen-Q-Rieu, Price, M. C., Sidher, S. D., Smith, A., Swinyard, B. M., Texier, D., Trams, N. R., & Wolfire, M. G. 1996, A&A, 315, L97
- Fritze-v. Alvensleben & Gerhard (1994) Fritze-v. Alvensleben, U. & Gerhard, O. E. 1994, A&A, 285, 775
- Fuentes-Masip et al. (2000) Fuentes-Masip, O., Muñoz-Tuñón, C., Castañeda, H. O., & Tenorio-Tagle, G. 2000, AJ, 120, 752
- Garay & Lizano (1999) Garay, G. & Lizano, S. 1999, PASP, 111, 1049
- Gilbert (2002) Gilbert, A. M. 2002, Ph.D. Thesis, University of California, Berkeley
- Gilbert & Graham (2001) Gilbert, A. M. & Graham, J. R. 2001, in IAU Symp. Ser. 207: Extragalactic Star Clusters (Astronomical Society of the Pacific), 471
- Gilbert & Graham (2007) Gilbert, A. M. & Graham, J. R. 2007, ApJ submitted
- Gilbert et al. (2000) Gilbert, A. M., Graham, J. R., McLean, I. S., Becklin, E. E., Figer, D. F., Larkin, J. E., Levenson, N. A., Teplitz, H. I., & Wilcox, M. K. 2000, ApJ, 533, L57
- Grebel & Chu (2000) Grebel, E. K. & Chu, Y. 2000, AJ, 119, 787
- Hanson et al. (1996) Hanson, M. M., Conti, P. S., & Rieke, M. J. 1996, ApJS, 107, 281
- Harris (1991) Harris, W. E. 1991, ARA&A, 29, 543
- Heckman et al. (1995) Heckman, T. M., Dahlem, M., Lehnert, M. D., Fabbiano, G., Gilmore, D., & Waller, W. H. 1995, ApJ, 448, 98
- Henry et al. (2007) Henry, A. L., Turner, J. L., Beck, S. C., Crosthwaite, L. P., & Meier, D. S. 2007, AJ, 133, 757
- Ho & Filippenko (1996) Ho, L. C. & Filippenko, A. V. 1996, ApJ, 466, L83
- Hummel & Van Der Hulst (1986) Hummel, E. & Van Der Hulst, J. M. 1986, A&A, 155, 151
- Hummer & Storey (1987) Hummer, D. G. & Storey, P. J. 1987, MNRAS, 224, 801
- Johnson & Kobulnicky (2003) Johnson, K. E. & Kobulnicky, H. A. 2003, ApJ, 597, 923
- Johnson et al. (2000) Johnson, K. E., Leitherer, C., Vacca, W. D., & Conti, P. S. 2000, AJ, 120, 1273
- Kennicutt & Chu (1988) Kennicutt, R. C. & Chu, Y.-H. 1988, AJ, 95, 720
- Kennicutt (1984) Kennicutt, R. C. 1984, ApJ, 287, 116
- Kennicutt (1998) —. 1998, ApJ, 498, 541
- Kennicutt et al. (1989) Kennicutt, R. C., Edgar, B. K., & Hodge, P. W. 1989, ApJ, 337, 761
- King (1966) King, I. R. 1966, AJ, 71, 64
- Kobulnicky & Johnson (1999) Kobulnicky, H. A. & Johnson, K. E. 1999, ApJ, 527, 154
- Kroupa (2001) Kroupa, P. 2001, MNRAS, 322, 231
- Lamers et al. (2005) Lamers, H., Gieles, M., & Portegies Zwart, S. 2005, A&A, 429, 173
- Larsen (2002) Larsen, S. S. 2002, AJ, 124, 1393
- Larsen (2004) Larsen, S. S. 2004, A&A, 416, 537
- Larsen et al. (2001) Larsen, S. S., Brodie, J. P., Elmegreen, B. G., Efremov, Y. N., Hodge, P. W., & Richtler, T. 2001, ApJ, 556, 801
- Leitherer et al. (1999) Leitherer, C., Schaerer, D., Goldader, J. D., Delgado, R. M. G., Robert, C., Kune, D. F., de Mello, D. F., Devost, D., & Heckman, T. M. 1999, ApJS, 123, 3
- Leitherer et al. (1996) Leitherer, C., Vacca, W. D., Conti, P. S., Filippenko, A. V., Robert, C., & Sargent, W. L. W. 1996, ApJ, 465, 717
- Mackey & Gilmore (2003a) Mackey, A. D. & Gilmore, G. F. 2003a, MNRAS, 338, 120
- Mackey & Gilmore (2003b) —. 2003b, MNRAS, 338, 85
- Maoz et al. (1996) Maoz, D., Barth, A. J., Sternberg, A., Filippenko, A. V., Ho, L. C., Macchetto, F. D., Rix, H.-W., & Schneider, D. P. 1996, AJ, 111, 2248
- Martín-Hernández et al. (2005) Martín-Hernández, N. L., Schaerer, D., & Sauvage, M. 2005, A&A, 429, 449
- Massey & Hunter (1998a) Massey, P. & Hunter, D. A. 1998a, ApJ, 493, 180
- Massey & Hunter (1998b) —. 1998b, ApJ, 493, 180
- McCrady et al. (2003) McCrady, N., Gilbert, A. M., & Graham, J. R. 2003, ApJ, 596, 240
- McCrady et al. (2005) McCrady, N., Graham, J. R., & Vacca, W. D. 2005, ApJ, 621, 278
- McKee & Williams (1997) McKee, C. F. & Williams, J. P. 1997, ApJ, 476, 144
- McLean et al. (1998) McLean, I. S., Becklin, E. E., Bendiksen, O., Brims, G., Canfield, J., Figer, D. F., Graham, J. R., Hare, J., Lacayanga, F., Larkin, J. E., Larson, S. B., Levenson, N., Magnone, N., Teplitz, H., & Wong, W. 1998, in Proc. SPIE: Infrared Astronomical Instrumentation, ed. A. M. Fowler, Vol. 3354, 566–578
- McLean et al. (2000) McLean, I. S., Graham, J. R., Becklin, E. E., Figer, D. F., Larkin, J. E., Levenson, N. A., & Teplitz, H. I. 2000, in Proc. SPIE: Optical and IR Telescope Instrumentation and Detectors, ed. M. Iye & A. F. Moorwood, Vol. 4008, 1048–1055
- Mengel et al. (2002) Mengel, S., Lehnert, M. D., Thatte, N., & Genzel, R. 2002, A&A, 383, 137
- Mengel et al. (2005) —. 2005, A&A, 443, 31
- Mengel et al. (2001) Mengel, S., Lehnert, M. D., Thatte, N., Tacconi-Garman, L. E., & Genzel, R. 2001, ApJ, 550, 280
- Meurer (1995) Meurer, G. R. 1995, Nature, 375, 742
- Meurer et al. (1995) Meurer, G. R., Heckman, T. M., Leitherer, C., Kinney, A., Robert, C., & Garnett, D. R. 1995, AJ, 110, 2665
- Mirabel et al. (1998) Mirabel, I. F., Vigroux, L., Charmandaris, V., Sauvage, M., Gallais, P., Tran, D., Cesarsky, C., Madden, S. C., & Duc, P.-A. 1998, A&A, 333, L1
- Moorwood et al. (1998) Moorwood, A., Cuby, J.-G., Biereichel, P., Brynnel, J., Delabre, B., Devillard, N., van Dijsseldonk, A., Finger, G., Gemperlein, H., Gilmozzi, R., Herlin, T., Huster, G., Knudstrup, J., Lidman, C., Lizon, J.-L., Mehrgan, H., Meyer, M., Nicolini, G., Petr, M., Spyromilio, J., & Stegmeier, J. 1998, The Messenger, 94, 7
- Neff & Ulvestad (2000) Neff, S. G. & Ulvestad, J. S. 2000, AJ, 120, 670
- Nikola et al. (1998) Nikola, T., Genzel, R., Herrmann, F., Madden, S. C., Poglitsch, A., Geis, N., Townes, C. H., & Stacey, G. J. 1998, ApJ, 504, 749
- O’Connell et al. (1994) O’Connell, R. W., Gallagher, J. S., & Hunter, D. A. 1994, ApJ, 433, 65
- O’Connell et al. (1995) O’Connell, R. W., Gallagher, J. S., Hunter, D. A., & Colley, W. N. 1995, ApJ, 446, L1
- Osterbrock (1974) Osterbrock, D. E. 1974, Astrophysics of gaseous nebulae (San Francisco: W. H. Freeman and Co.)
- Persson et al. (1998) Persson, S. E., Murphy, D. C., Krzeminski, W., Roth, M., & Rieke, M. J. 1998, AJ, 116, 2475
- Rigby & Rieke (2004) Rigby, J. R. & Rieke, G. H. 2004, ApJ, 606, 237
- Rieke & Lebofsky (1985) Rieke, G. H. & Lebofsky, M. J. 1985, ApJ, 288, 618
- Rousselot et al. (2000) Rousselot, P., Lidman, C., Cuby, J.-G., Moreels, G., & Monnet, G. 2000, A&A, 354, 1134
- Rozas et al. (1998) Rozas, M., Sabalisck, N., Beckman, J. E., & Knapen, J. H. 1998, A&A, 338, 15
- Rubin et al. (1970) Rubin, V. C., Ford, W. K., & D’Odorico, S. 1970, ApJ, 160, 801
- Salpeter (1955) Salpeter, E. E. 1955, ApJ, 121, 161
- Saviane et al. (2004) Saviane, I., Hibbard, J. E., & Rich, R. M. 2004, AJ, 127, 660
- Schweizer (1987) Schweizer, F. 1987, in Nearly Normal Galaxies. From the Planck Time to the Present, 18–25
- Schweizer (2004) Schweizer, F. 2004, in ASP Conf. Ser. 322: The Formation and Evolution of Massive Young Star Clusters, 111
- Schweizer & Seitzer (1998) Schweizer, F. . & Seitzer, P. 1998, AJ, 116, 2206
- Schweizer et al. (1996) Schweizer, F., Miller, B. W., Whitmore, B. C., & Fall, S. M. 1996, AJ, 112, 1839
- Shopbell & Bland-Hawthorn (1998) Shopbell, P. L. & Bland-Hawthorn, J. 1998, ApJ, 493, 129
- Smith & Gallagher (2001) Smith, L. J. & Gallagher, J. S. 2001, MNRAS, 326, 1027
- Smith & Weedman (1970) Smith, M. G. & Weedman, D. W. 1970, ApJ, 161, 33
- Spitzer (1987) Spitzer, L. 1987, Dynamical Evolution of Globular Clusters (Princeton: Princeton Univ. Press, 1987)
- Stanford et al. (1990) Stanford, S. A., Sargent, A. I., Sanders, D. B., & Scoville, N. Z. 1990, ApJ, 349, 492
- Sternberg (1998) Sternberg, A. 1998, ApJ, 506, 721
- Stetson (1987) Stetson, P. B. 1987, PASP, 99, 191
- Testi et al. (2000) Testi, L., Sargent, A. I., Olmi, L., & Onello, J. S. 2000, ApJ, 540, L53
- Turner et al. (2003) Turner, J. L., Beck, S. C., Crosthwaite, L. P., Larkin, J. E., McLean, I. S., & Meier, D. S. 2003, Nature, 423, 621
- Turner et al. (2000) Turner, J. L., Beck, S. C., & Ho, P. T. P. 2000, ApJ, 532, L109
- Vacca et al. (2002) Vacca, W. D., Johnson, K. E., & Conti, P. S. 2002, AJ, 123, 772
- Walborn (1991) Walborn, N. R. 1991, in IAU Symp. 148: The Magellanic Clouds, ed. R. Haynes & D. Milne, Vol. 148 (Dordrecht: Kluwer Academic Publishers), 145
- Whitmore et al. (2005) Whitmore, B. C., Gilmore, D., Leitherer, C., Fall, S. M., Chandar, R., Blair, W. P., Schweizer, F., Zhang, Q., & Miller, B. W. 2005, AJ, 130, 2104
- Whitmore & Schweizer (1995) Whitmore, B. C. & Schweizer, F. 1995, AJ, 109, 960
- Whitmore & Zhang (2002) Whitmore, B. C. & Zhang, Q. 2002, AJ, 124, 1418
- Whitmore et al. (1999) Whitmore, B. C., Zhang, Q., Leitherer, C., Fall, S. M., Schweizer, F., & Miller, B. W. 1999, AJ, 118, 1551
- Williams & McKee (1997) Williams, J. P. & McKee, C. F. 1997, ApJ, 476, 166
- Wilson et al. (2000) Wilson, C. D., Scoville, N., Madden, S. C., & Charmandaris, V. 2000, ApJ, 542, 120
- Wood & Churchwell (1989) Wood, D. O. S. & Churchwell, E. 1989, ApJS, 69, 831
- Zhang et al. (2001) Zhang, Q., Fall, S. M., & Whitmore, B. C. 2001, ApJ, 561, 727
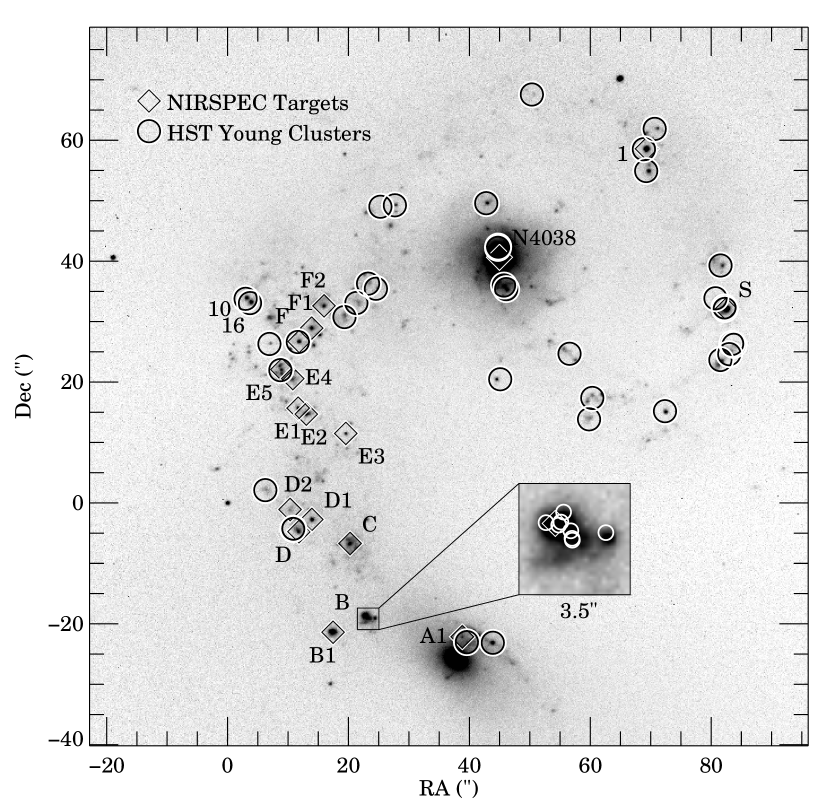
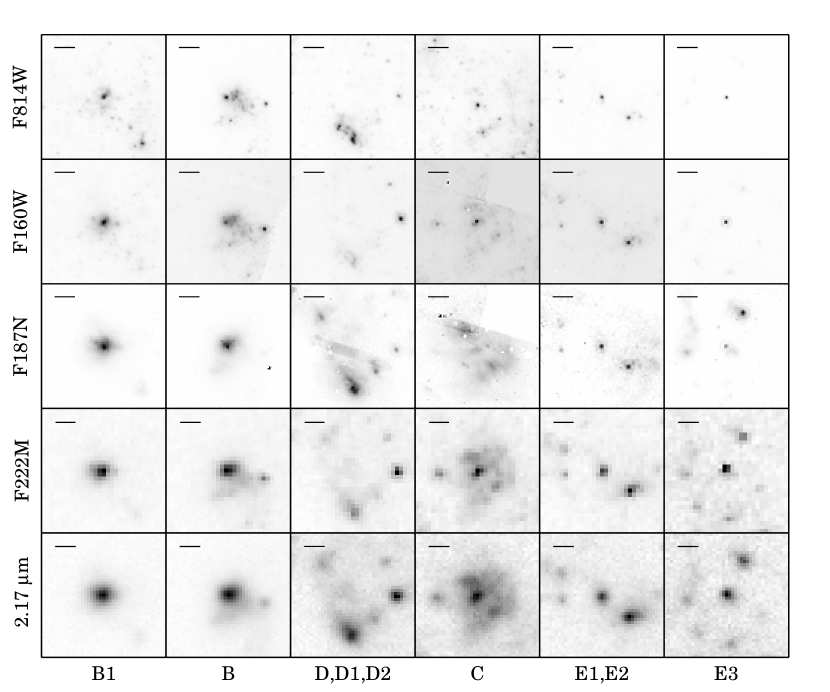


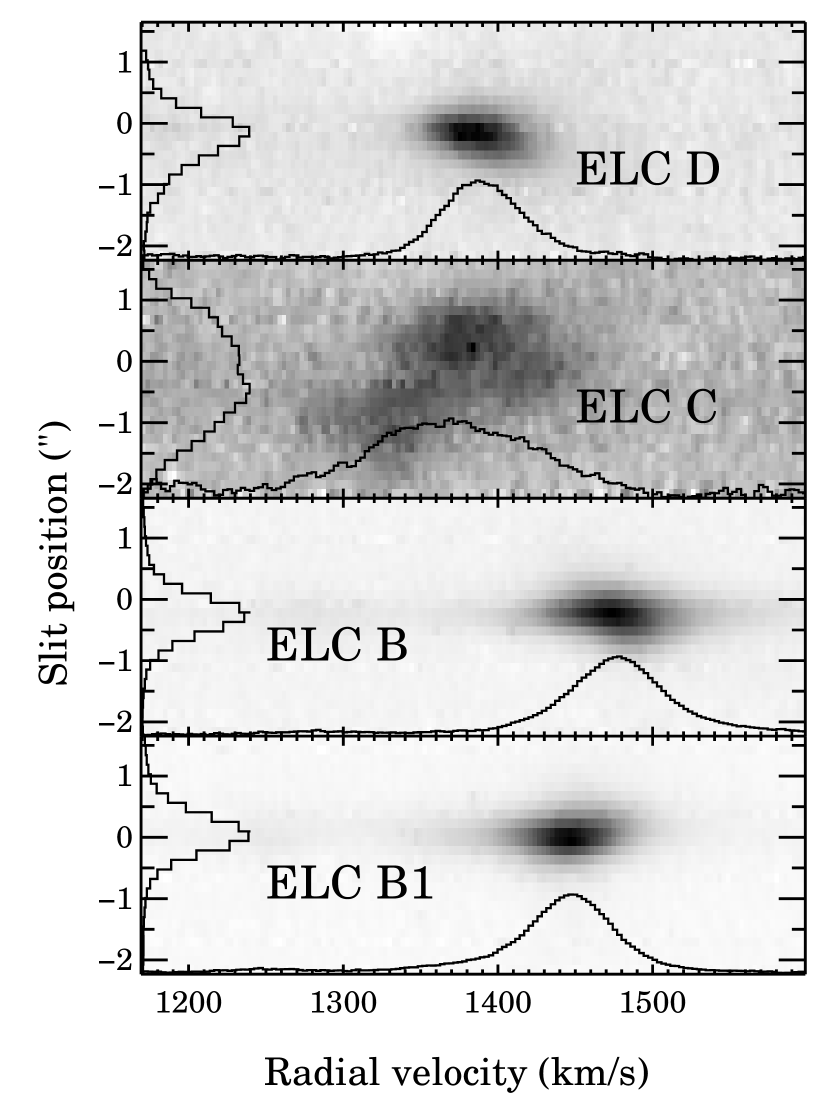


| SSC | R.A.aaPositions in arcseconds relative to Star 4 of Whitmore et al. 1999, whose position is reported as R.A. = and DEC = (J2000), although Whitmore & Zhang (2002) find an offset of to the southwest of the HST positions from radio observations Neff & Ulvestad (2000). All offsets are measured from our NIRSPEC N7 mosaic except that of S, which is derived from Whitmore et al. (1999). | DecaaPositions in arcseconds relative to Star 4 of Whitmore et al. 1999, whose position is reported as R.A. = and DEC = (J2000), although Whitmore & Zhang (2002) find an offset of to the southwest of the HST positions from radio observations Neff & Ulvestad (2000). All offsets are measured from our NIRSPEC N7 mosaic except that of S, which is derived from Whitmore et al. (1999). | KbbK magnitude from NIRSPEC SCAM photometry, except for SSC S from Mengel et al. (2002). Systematic errors are 0.2 mag. | FWHMccDeconvolved FWHM (from geometric mean radius of 2D Lorentzian fit) from distortion-corrected 2.25 m narrow-band ISAAC image; at the Antennae pc. Lorentzian FWHM of Star 4 is 0.27″, which was used to derive seeing-deconvolved FWHMs. |
|---|---|---|---|---|
| Name | (”) | (”) | (mag) | (”) |
| B1 | -17.7 | -21.0 | 14.7 | 0.62 |
| B | -23.1 | -18.2 | 14.5 | 1.05 |
| D | -11.7 | -4.5 | 15.4 | 0.87 |
| C | -20.2 | -6.3 | 15.2 | 0.46 |
| D1 | -13.9 | -2.7 | 15.8 | 0.23 |
| D2 | -10.3 | -1.1 | 16.9 | 0.75 |
| E1 | -11.7 | 15.5 | 16.1 | 0.28 |
| E2 | -13.0 | 14.7 | 15.6 | 0.54 |
| E3 | -19.5 | 11.4 | 17.1 | 0.23 |
| F | -11.9 | 26.6 | 15.9 | 0.20 |
| E5 | -8.9 | 21.8 | 15.3 | 0.50 |
| F2 | -15.9 | 32.5 | 15.8 | 0.36 |
| F1 | -13.9 | 28.8 | 15.7 | 0.33 |
| E4 | -10.7 | 20.4 | 15.7 | 0.77 |
| A1 | -39.8 | -23.0 | 17.5 | 0.32ddA1 is too faint and confused to fit as above, so its FWHM is estimated from a spline fit to the azimuthally averaged profile, subtracting in quadrature Star 4’s size measured the same way (0.38″). |
| S | -82.3 | 32.1 | 14.0 | 0.30 |
| Source | Date | |
|---|---|---|
| Names | (UT) | (s) |
| B,B1aaSSC B1 is SSC A of Gilbert et al. (2000). | 2002-02-22 | 2 600 |
| C,D | 2002-02-22 | 2 600 |
| D1,D2 | 2002-02-22 | 1 600 |
| E1,E2,E3 | 2002-02-22 | 3 600 |
| FbbYoung cluster 15 of Whitmore et al. (1999). | 2002-02-23 | 2 600 |
| W99 10,16ccYoung clusters 10, 16, and 1 of Whitmore et al. (1999). | 2002-02-23 | 2 600 |
| F1,F2,E5 | 2002-02-23 | 3 600 |
| E4 | 2002-02-23 | 1 600 |
| N4039 nucleus, A1 | 2002-02-23 | 1 300 |
| N4038 nucleus | 2002-02-23 | 1 300 |
| SddYoung cluster 2 of Whitmore et al. (1999). | 2000-12-11 | 7 900 |
| W99 1ccYoung clusters 10, 16, and 1 of Whitmore et al. (1999). | 2001-02-04 | 10 900 |
| Name | F[Br] aaBr flux is not corrected for extinction (see Table 4). | EW[Br] | bbAverage error in barycentric Br radial velocity is 1 km s-1, with a maximum of 2.8 km s-1. | ccObserved FWHM, not corrected for instrumental line-spread function (FWHM 12 km s-1). This correction is significant for the marginally resolved line of SSC D1. The corrected FWHM of SSC F is 27 km s-1. Average error in Br FWHM is 2.6 km s-1, with a maximum of 7.5 km s-1. |
|---|---|---|---|---|
| (erg s-1 cm-2) | (Å) | (km s-1) | ||
| B1 | 155.7 2.4 | 254.8 8.0 | 1476 | 70 |
| B | 166.1 1.6 | 260.9 5.3 | 1447 | 63 |
| D | 47.5 1.7 | 189.7 10.6 | 1390 | 57 |
| C | 40.5 2.1 | 63.8 3.6 | 1383 | 109 |
| D1 | 3.1 0.6 | 24.2 10.4 | 1485 | 14 |
| D2ddFor D2, total flux and EW are listed, but vrad and vFWHM refer only to the broad component of the line. | 30.9 7.2 | 123.2 52.4 | 1487 | 55 |
| E1 | 5.1 0.2 | 2.6 0.1 | 1599 | 40 |
| E2 | 5.2 0.2 | 2.5 0.1 | 1580 | 39 |
| E3 | 5.2 0.3 | 1.7 0.1 | 1544 | 53 |
| F | 6.7 0.5 | 8.4 0.7 | 1583 | 30 |
| E5 | 6.2 0.5 | 20.8 3.6 | 1558 | 44 |
| F2 | 13.4 1.1 | 2.8 0.3 | 1601 | 80 |
| F1 | 2.3 0.5 | 15.9 3.5 | 1566 | 42 |
| E4 | 34.5 1.8 | 6.0 0.4 | 1558 | 54 |
| A1eeRefers to an off-nuclear HIIR near the NGC 4039 nucleus. | 64.2 1.8 | 1.6 0.0 | 1575 | 45 |
| N4038 | 33.4 3.5 | 1.6 0.2 | 1597 | 77 |
| S | 6.6 2.2 | 4.8 1.6 | 1566 | 76 |
| Name | Log Q[H+]aaQ[H+] is derived from Br fluxes and not corrected for extinction, which scales it up by factor . | Ageb,cb,cfootnotemark: | Massb,db,dfootnotemark: | |
|---|---|---|---|---|
| (s-1) | (Myr) | (106 M⊙) | (mag) | |
| B1 | 52.71 | 3.45 | 4.23 | 1.2ee Estimated from Br fluxes and radio measurements reported by Neff & Ulvestad (2000) (see § 3). |
| B | 52.74 | 3.44 | 5.00 | 0.2ee Estimated from Br fluxes and radio measurements reported by Neff & Ulvestad (2000) (see § 3). |
| D | 52.19 | 3.85 | 1.93 | … |
| C | 52.12 | 5.72 | 4.13 | … |
| D1 | 51.01 | 6.13 | 1.62 | … |
| D2 | 52.00 | 5.36 | 0.80 | 0.8ee Estimated from Br fluxes and radio measurements reported by Neff & Ulvestad (2000) (see § 3). |
| E1 | 51.22 | 6.75 | 0.26 | … |
| E2 | 51.23 | 6.76 | 0.41 | … |
| E3 | 51.23 | 6.94 | 0.07 | … |
| F | 51.34 | 6.47 | 0.74 | 0.1ff Reported by Mengel et al. (2002). |
| E5 | 51.31 | 6.19 | 2.60 | … |
| F2 | 51.64 | 6.73 | 0.35 | … |
| F1 | 50.87 | 6.29 | 1.47 | 0.3ee Estimated from Br fluxes and radio measurements reported by Neff & Ulvestad (2000) (see § 3). |
| E4 | 52.05 | 6.55 | 0.65 | … |
| A1 | 52.32 | 7.00 | 0.50 | |
| N4038 | 52.04 | 7.00 | 3.45 | … |
| S | 51.33 | 6.61 | 3.22 | 0.0ff Reported by Mengel et al. (2002). |