The X-ray binary population in M33: II. X-ray spectra and variability
Abstract
In this paper we investigate the X-ray spectra and X-ray spectral variability of compact X-ray sources for 3 Chandra observations of the Local Group galaxy M33. The observations are centered on the nucleus and the star forming region NGC 604. In the observations 261 sources have been detected. For a total of 43 sources the number of net counts is above 100, sufficient for a more detailed spectral fitting. Of these sources, 25 have been observed in more than one observation, allowing the study of spectral variability on months timescales. A quarter of the sources are found to be variable between observations. However, except for two foreground sources, no source is variable within any observation above the 99% confidence level. Only six sources show significant spectral variability between observations. A comparison of values with HI observations shows that X-ray absorption values are consistent with Galactic X-ray binaries and most sources in M33 are intrinsically absorbed. The pattern of variability and the spectral parameters of these sources are consistent with the M33 X-ray source population being dominated by X-ray binaries: Two thirds of the 43 bright sources have spectral and timing properties consistent with X-ray binaries; we also find two candidates for super-soft sources and two candidates for quasi-soft sources.
Subject headings:
X-rays: binaries — galaxies: Local Group — galaxies: individual (M33)1. Introduction
M33 is a late-type spiral galaxy, Sc II-III, and the third largest galaxy in the Local Group. It is a unique galaxy in the Local Group since morphologically it is of intermediate type between the large early-type spiral galaxies and the numerous dwarf galaxies. Other galaxies of this type cannot be investigated with the same depth even with Chandra . At a distance of 840 kpc (Freedman et al., 1991) from the Milky Way (MW) M33 is the second nearest major galaxy. It spans roughly 73’45’ on the sky. The line-of-sight absorption column density is small, cm-2 (Stark et al., 1992). M33 is more actively star forming than either the MW or M31 (Hippelein et al., 2003), particularly compared to its much smaller mass.
M33 has been studied with every X-ray mission since Einstein (Markert & Rallis, 1983). But only recently have high angular resolution and high sensitivity instruments like Chandra and XMM allowed us to study the X-ray source population in depth. Grimm et al. (2005) and Pietsch et al. (2005) have provided source lists and fluxes for the X-ray source population in M33, from the Chandra and XMM observations respectively. In this paper we follow up on the Grimm et al. (2005) Chandra survey and present an analysis of the X-ray spectra and variability behavior of X-ray sources in M33. Apart from fluxes, variability and spectral energy distributions are an important diagnostic tool for understanding the emission mechanism(s) in X-ray sources, and for classifying these sources. Moreover, spectral and time variability are the main characteristics of X-ray binaries, as shown by the detailed work done for X-ray binaries in the Milky Way, see e.g. van der Klis (2005).
The paper is organized as follows. In Sec. 2 we describe the data processing, followed in Sec. 3 by the analysis procedures. The results and their implications for the nature of the X-ray source population in M33 are discussed in Sec. 4; we also discuss individual bright sources in detail in Sec. 4.4. We conclude with a summary of the results in Sec. 5. The figures showing the results for the spectral analysis for sources with more than one observation are shown in the Appendix in the electronic edition only.
2. Data
M33 has been observed with the ACIS instrument on Chandra four times, see Grimm et al. (2005). In this paper we use three observations whose ObsIds and dates are given in Table 1. Due to its angular extent the observed parts of M33 cover all active chips, the standard ACIS-S configuration for ObsId 786 (catalog ADS/Sa.CXO#obs/00786), and the standard ACIS-I configuration for ObsId 1730 (catalog ADS/Sa.CXO#obs/01730) and ObsId 2023 (catalog ADS/Sa.CXO#obs/02023). There is considerable overlap between the different observations. However, due to the decreasing resolution/sensitivity with increasing off-axis angle only the inner part of M33 ( 8-10 arc minutes) has a significant number of sources in two observations, 786 (catalog ADS/Sa.CXO#obs/00786) and 1730 (catalog ADS/Sa.CXO#obs/01730). A fourth observation, ObsId 787, was disregarded because it was aimed at studying the nucleus and suffers from both high background and small FOV.
| ObsId | Date | Aim point | Duration [ks] |
|---|---|---|---|
| 786 (catalog ADS/Sa.CXO#obs/00786) | 2000-08-30 | Nucleus | 45 |
| 1730 (catalog ADS/Sa.CXO#obs/01730) | 2000-07-12 | Nucleus | 45 |
| 2023 (catalog ADS/Sa.CXO#obs/02023) | 2001-07-06 | NGC 604 | 90 |
The data from the three observations were processed according to the standard data processing procedure with CIAO versions 3.1, including exposure correction. Source detection was performed with wavdetect with scales of 1, 2, 4, 8, 10, 12, and 16 in the energy range 0.3–8 keV. The signal detection threshold was set to . Source regions correspond to the 95% encircled energy area. For more details of the data analysis see Grimm et al. (2005).
3. Analysis
We separate the analysis in three parts, short term, long term, and spectral variability. The different methods are discussed in the following subsections. We assume that the variability of individual sources is independent, so there is no correlation between short term and long term variability. Because the number of counts observed in a single observation is not very large even for bright sources we restrict the spectral variability analysis to a comparison between different observations, when applicable.
The nucleus was excluded from the following analysis because it suffers from strong pile-up in two observations.
3.1. Short and long term variability
In order to establish short timescale variability we perform a Bayesian block analysis of the lightcurves of individual sources. A Bayesian block analysis computes the best approximation to the lightcurve shape in terms of piecewise constant flux levels or blocks. The discriminator between a single flux level for the whole lightcurve or two flux levels is the ratio of likelihoods of describing a data segment with one or two blocks. In this analysis the algorithm used is iterative. It starts with the whole lightcurve and subsequently divides it until the likelihood ratio for dividing a lightcurve segment becomes smaller than a predefined prior, in this case corresponding to 99% confidence level. The Bayesian block analysis is particularly suited for burst-like variability. For more details about the principle of Bayesian blocks and the algorithm used in this analysis see Scargle (1998). The implementation used here is the same as used by the CHAMP project and described in (Kim et al., 2004).
Since a Bayesian block analysis uses only the photon arrival times for computation of the blocks, no binning is necessary. Therefore there is no intrinsic restriction to the number of photons the algorithm is applicable to. Obviously establishing variability with a certain confidence becomes less likely for fainter sources.
Because a Bayesian block analysis is particularly sensitive to burst-like variability we also performed a search for periodic variability with the XRONOS v5.21 tool efsearch. This analysis did not yield any source with significant short term variability.
To establish long timescale variability we use simple Poisson statistics. This is justified because, with the exception of two foreground sources, no source exhibits strong short term variability. We compare the difference in fluxes between two observations to the quadratically added errors for the fluxes. If a source is undetected in an observation in which it was in the field of view of Chandra , we calculate an upper limit to the source flux using an algorithm developed by Kraft et al. (1991). Since the upper limit value already corresponds to the 99% confidence level, for a comparison with a detected flux we compare the 3 sigma error of the detection directly with the upper limit.
3.2. Spectra and spectral variability
For 43 out of the total 261 sources the number of counts in at least one observation was larger than 100 net counts, which we consider sufficient to attempt spectral fitting. Of these 43 sources 25 have been observed in at least two observations. For these sources we also compare the spectral properties with time. The spectral fitting was done with XSPEC v11.3.1. Because of the generally low number of counts the fitting was done for all sources with Cash statistics (Cash, 1979). At 100 counts we expect only 3 background sources based on the CDF-N LogN–LogS (Alexander et al., 2003), so the vast majority of these sources are likely to belong to M33.
We first fit the bright sources with two simple absorbed spectral models, power law and bremsstrahlung, to check the validity of our assumptions about the spectral shape of the faint sources that do not have sufficient counts for detailed spectral modeling (see derivation of the X-ray luminosity function in Grimm et al. (2005)). The absorption was in one case a free parameter in the other case it was fixed to the Galactic value. After validating that the assumptions about the general power law shape are correct, we proceeded to fit more complex model to the bright sources.
The results of the simple spectral fitting are presented in Sec. 4. Spectra of sources with more than one observation with best fit values and corresponding confidence contour plots are shown in Appendix B in the electronic edition, except for the spectra of M33 X-7 (CXO J013334.1+303210 (catalog )) and M33 X-9 (CXO J013358.8+305004 (catalog )), which are shown in Figs. 7 and 8, and will be discussed in Sec. 4.4.
Based on the confidence regions for the fit parameters, shown in Appendix B, only one of the X-ray sources shows significant spectral variability from observation to observation, M33 X-4 (CXO J013315.1+305317 (catalog )). For the other sources in different observations none of the parameters of a source spectrum show changes corresponding to more than 99% confidence level. This is despite the fact that some sources show significant time variability between observations. However, the number of counts available for most sources for fitting is insufficient to determine spectral parameters to an accuracy good enough to compare two observations. Moreover, degeneracies between model parameters complicate the establishing of variability.
Another approach to spectral variability is the use of hardness ratios. These are relatively crude estimators of spectral changes but because of the smaller number of degrees of freedom compared to a spectral fit can be statistically preferable. We therefore take all sources that were observed in at least two observations, divide each observation in three equally long parts, and construct hardness ratios from these intervals. Because only sources with more than 100 counts are used in this part of the analysis the separation in three parts still gives sufficient number of counts () in each time bin for a hardness ratio analysis (Prestwich et al., 2003). Note that ObsId 2023 (catalog ADS/Sa.CXO#obs/02023) is roughly twice as long as the other observations. The energy bands used are the same as in Grimm et al. (2005); 0.3–1.0 keV for the soft band, 1.0–2.1 keV for the medium band, and 2.1–8.0 keV for the hard band. The hardness ratios are defined as
| (1) |
where , , and are the background and exposure corrected counts in the soft, medium, and hard band, and are the corrected counts in the whole energy band. To compare two observations it is important to take into account the different effective areas of the source location in each observation, especially if the source is located on a front-illuminated chip and in another observation on a back-illuminated chip. We compute the effective area of the source in each observation for each energy band. For comparison with the other observations of the source we normalize the effective area in each band by the effective area value of the aim point of ObsId 1730 (catalog ADS/Sa.CXO#obs/01730). Note that the choice of the normalization constant is arbitrary. The results are combined for all available observations. The results for all sources that show evidence of variability are shown in Appendix B in the electronic edition.
4. Results and Discussion
4.1. Short timescale variability
Except for two sources which are foreground Galactic stars, no source presents variability above the 99% confidence level. In Fig. 1 we show the results of the Bayesian block analysis for the only two sources that are variable on short timescales. The dotted histograms represent the count rate binned in 400 second intervals. Note that the binning is for plotting purposes only. The green line is the power spectrum of the lightcurve. The thick solid line is the result of the Bayesian block analysis. The small square to the right of the lightcurve is a thumbnail image of the source from the observation.
Source CXO J013327.7+304645 (catalog ) shows a clear X-ray outburst in ObsId 2023 (catalog ADS/Sa.CXO#obs/02023). This outburst, lasting about 10,000 seconds completely accounts for the long term variability of the source. The lightcurve of the outburst is well fit by an exponential decay with a decay timescale of 3900 seconds. The persistent luminosity in ObsId 2023 (catalog ADS/Sa.CXO#obs/02023) is consistent within the errors with the luminosities in the other observations. Outburst and persistent counts are not large enough to investigate changes in spectral shape. An X-ray color comparison of the burst and persistent emission shows a softening of the emission in HR2 and a slight hardening in HR1 that is significant only at the 2-sigma level. The optical counterpart to source CXO J013327.7+304645 (catalog ) is a star in the USNO catalog with a V magnitude of 16.8. We have analyzed archival HST WFPC2 data. The object was detected in bands corresponding to U, B, V, and I. The colors are consistent with an early M type star, either on the main sequence or a giant. Using normal V magnitudes for M stars this puts the star at a distance of 90–320 pc for a main sequence star, or 24–29 kpc for a giant. Considering the relatively high galactic latitude of M33, deg, the lower distance value, and thus a main sequence star is more likely. Assuming a main sequence star the peak luminosity is between ergs s-1, and the total energy between ergs.
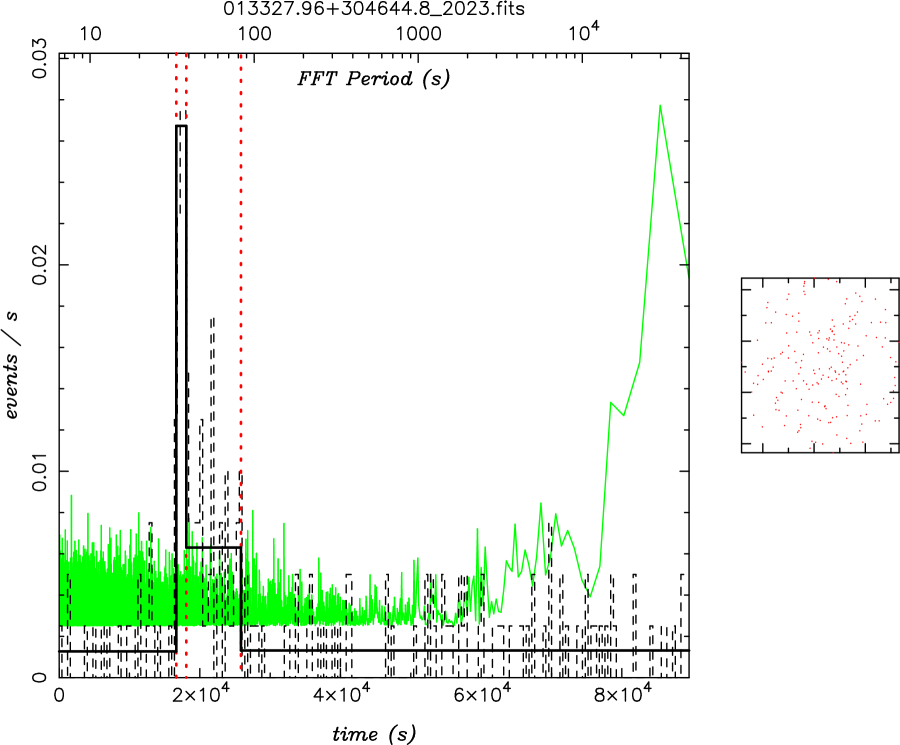
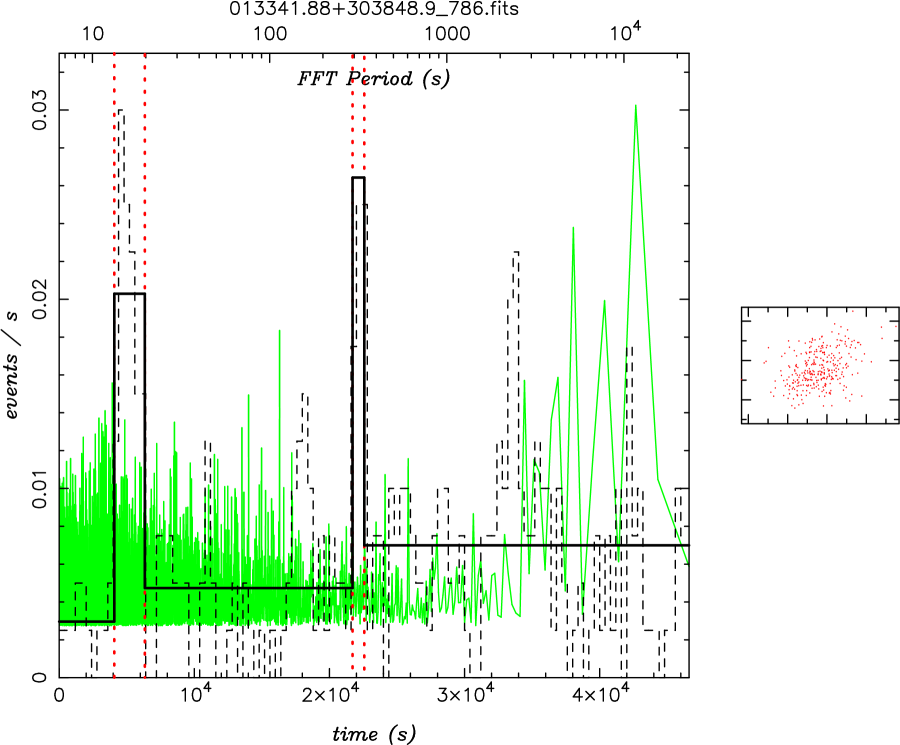
Source CXO J013341.8+303848 (catalog ), a foreground star as well, has two outbursts in ObsId 786 (catalog ADS/Sa.CXO#obs/00786). The first outburst lasts about 2600 seconds, the second outburst 18000 seconds later lasts about 800 seconds. The persistent level of X-ray emission increases slightly after each outburst. As shown in the long term lightcurve the source also has a long term trend to increasing luminosity for the 3 observations. The decay of the outbursts cannot be fit uniquely; an exponential decay with a decay constant of 1000 seconds or a linear decay are both possible. During both outbursts the source becomes softer, but only at the level. This source has no HST coverage.
4.2. Long term variability
Of a total of 261 sources, 198 have been detected in at least two observations, and 62 in all three observations. The luminosities for comparison are taken from spectral fits for the brighter sources (more than 100 counts), or from the assumed spectrum, absorbed power law with a photon index of 2 and Galactic absorption. We find that 49 of 198 sources show variability between observations above 3 sigma. An additional 29 sources show signs of variability between 2 and 3 sigma. Of the 49 variable sources only 16 are apparently persistent.
The strength of the variability can in fact be used to confirm the nature of most of these sources as X-ray binaries. AGN in general show variability on weeks or months timescale only up to factors of 2–3 (Mushotzky et al., 1993; Paolillo et al., 2004). Most of the sources in M33 show stronger variability, particularly since the flux ratios for most sources are only lower limits. Moreover, the sources with flux ratios below 2 are bright sources that are unlikely to be AGN based only on brightness.
Taking into account that 80–90 of the 198 sources are likely background AGN, somewhat less than half the sources in M33 are variable. Of these two thirds (34/49) may be candidate transients. This number is somewhat higher than the about 50% in the Milky Way and Magellanic Clouds (Liu et al., 2000, 2001). But the detection limits (few erg s-1) do not allow to establish true transient behavior for undetected sources so the number of two thirds is only an upper limit.
For the brighter sources ( erg s-1) past X-ray satellites also provide data for long term variability. Fig. 2 shows data from Einstein HRI and IPC (Trinchieri et al., 1988), ROSAT HRI (Schulman & Bregman, 1995) and PSPC (Long et al., 1996), BeppoSAX (Parmar et al., 2001) as well as from this work for the bright sources in the field of view of Chandra . The quoted luminosities are converted to the Chandra band of 0.3–8.0 keV and, if they are not individual measurements of spectra, converted to the spectral shape of a power law with photon index of 2 and the Galactic absorption value towards M33, cm-2. The error bars in the plot only contain errors due to counting statistics. Other errors, e.g. due to the conversion of energy bands and different assumed spectral shapes, add generally another 20–30% uncertainty in the luminosity. In addition different instrument responses, cross-calibration issues and other systematic effects add another source of systematic errors, which is hard to quantify. An exception is the supernova remnant M33 X-14, for which converting the luminosity given by Long et al. (1996) would result in variability at over compared to other observations. However, Long et al. (1996) assume a power law spectrum with a photon index of 2 to compute the source luminosity. Although this is a reasonable choice for X-ray binaries or AGN, the spectrum of M33 X-14 is quite soft. We extracted a spectrum of X-14 from the ROSAT observation rp600023a00, the longest of the PSPC observations with 29 ks. The spectrum is well fit by an absorbed blackbody model with a column density of cm-2 and a temperature of 0.09 keV. Although this model is rather unphysical for a SNR we are interested only in the flux, which is sufficiently accurate for the purpose of comparison. The ROSAT data also agree with the spectrum obtained from Chandra . Extrapolating this spectrum to the Chandra energy range gives a luminosity of ergs s-1 which agrees very well with other observations of the source, in particular the Chandra observed value of ergs s-1.
It is clear from Fig. 2 that four of the bright X-ray sources are variable. The sources that do not show evidence of variability at the level are M33 X-1, X-2, and the SNR X-14.

The variability pattern is very similar to that observed in other X-ray source populations, regardless of galaxy type, e.g. The Antennae (Zezas et al., 2006), M101 (Jenkins et al., 2005), NGC 4697 (Sivakoff et al., 2005). In particular that only very few, if any, sources show short-term variability is very common, although this is most likely due to limited photon statistics. On the other hand a large fraction (10-40%) of sources exhibit long-term variability. Moreover, the fraction of sources with strong long term variability is quite confidently identified as X-ray binaries, and not background AGN.
4.3. Spectra
Fitting all the 43 sources detected with more than 100 net counts with a power law and a thermal bremsstrahlung spectrum, with column density fixed to the Galactic value or as a free fit parameter, provides about half of the sources with a good fit to the data. The other sources require either different models, e.g. black body or other thermal plasma models, or multiple components. The results of the simple power law/bremsstrahlung fits support the validity of our assumptions of a fixed spectral model for conversion from counts to fluxes for fainter sources, assuming that the spectral properties of bright and faint sources are not systematically different (Grimm et al., 2005).
In Fig. 3 we show histograms for the best fit power law and bremsstrahlung values for all sources. The upper left panel shows the comparison between photon indices of a power law with column density being a free fit parameter versus column density fixed to the Galactic value. The Galactic absorption towards M33 is only cm-2. The upper right panel shows the same for bremsstrahlung temperature . The lower left panel shows the histogram of for the case of as a free fit parameter. The power law slopes are concentrated around 2, the canonical value for X-ray binaries and AGN. The peak at comprises all sources with photon index larger than or equal to 5. Individually, all these sources are fit well with a blackbody or plasma model with temperatures of 0.1–0.13 keV (blackbody) or 0.2–0.3 keV (plasma model). The lower right panel finally shows the distribution of bremsstrahlung temperatures. Note that the influence of is stronger in case of a power law than for a bremsstrahlung spectrum as is evident in the generally smaller deviations from the one-to-one correlation for the bremsstrahlung temperatures compared to the photon indices in the upper panels.


As expected, fits with a fixed low column density produce smaller photon indices or larger bremsstrahlung temperatures, respectively. However, changes of temperature and photon index between fits with fixed and free column density are not significantly larger than the errors in the majority of cases. Comparing the difference between photon indices divided by the square root of the errors shows that 80% of the sources have values of less than 3. For thermal bremsstrahlung model the corresponding value is 73%. Thus the assumption of a general power law spectrum with , and Galactic absorption is quite good (Grimm et al., 2005).
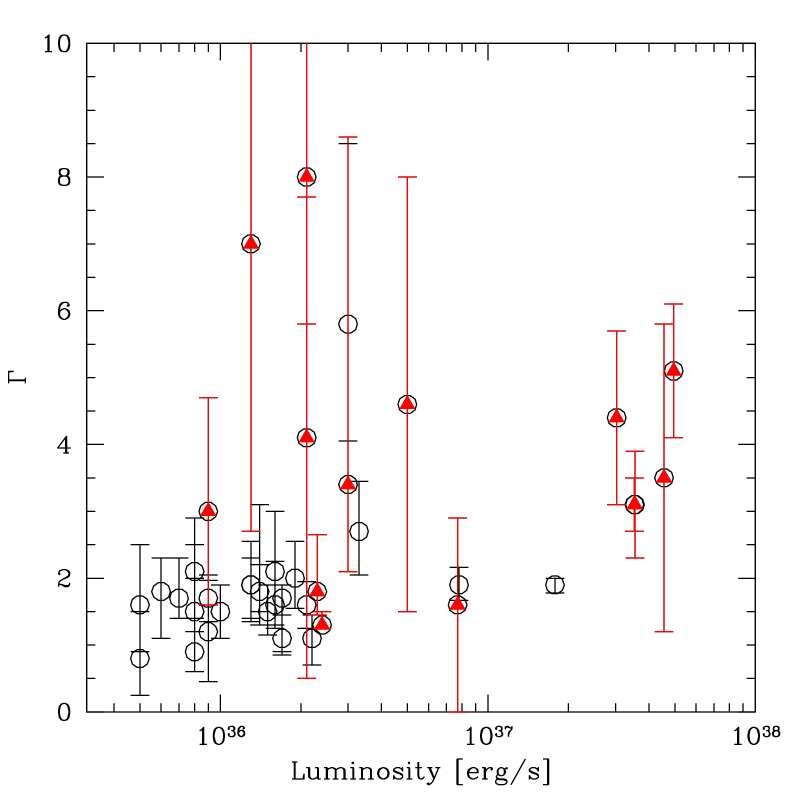


Using the results of the more detailed spectral fitting of the 43 bright sources, we can confirm the results of the relatively blind spectral fitting of all sources with a power law model. The left panel of Fig. 4 shows the photon indices of spectra that are well fit by either a single power law (open circles) or a combination of a power law and other components (filled triangles) versus luminosity. Errors are 90% errors on the slope. There is a clear trend that photon indices in multi-component fits are larger than for single power law fits, and there is an indication that brighter sources are more likely well fit by multi-component fits than by single power laws. The reason is most likely that the single power law sources have lower counts and multiple components are not distinguishable. We also fit the single power law sources with a disk black body model, XSPEC model diskbb, which has the same number of degrees of freedom than the power law model. Two thirds of the spectra are well fit by a disk black body model, the best fit temperatures being in the range from 1 to 3 keV, as expected for X-ray binaries (Tanaka, 2001). The inner disk temperatures versus luminosity are shown in the middle panel of Fig. 4. The values are the same as for the sources that require disk black bodies for a good fit. This suggests that the single power law sources are likely to be X-ray binaries and only the low number of counts allows a good fit with a single power law.
There are 10 spectra (5 sources) that are best fit with a single bremsstrahlung model with temperatures of 0.1–0.3 keV. The bremsstrahlung temperatures versus luminosity are shown in the right panel of Fig. 4 (open squares). Since these values are unusually low for real bremsstrahlung sources, and the luminosities of the sources relatively low, erg s-1, we fit these spectra with a thermal plasma model (XSPEC model apec) as well. With one exception we obtain good fits with the plasma model as well, the temperatures are in the range from 0.1 keV to 0.4 keV, and metallicities from 0.05 to 0.3 solar with considerable uncertainties. These values are at or below the expected metallicity for M33 (Blair & Kirshner, 1985). The good fit quality is not surprising considering that the apec model has one degree of freedom more than the simple bremsstrahlung model. However, given the low temperatures and the consistent metallicities we consider the apec model to be the more physical model for these sources. The sources with good fits for the apec model are marked in Table 3 (Appendix B) and the apec model parameters are given, in Fig. B1 (Appendix B) the contour plots for these fits are shown as well. Also shown in the right panel of Fig. 4 are six sources well fit by a black body model with very low temperatures at or below 0.1 keV (filled triangles). For two sources the black body is the only component in the spectrum. These sources are candidates for super-soft sources and are discussed below in Sec. 4.4. Three of the other four sources have an additional power law component, that ranges from hard () to very soft (). The black body temperatures are even lower than the temperatures inferred from ULX intermediate mass black hole candidates, see e.g. Miller et al. (2004). A truncated disk would be a possibility to explain the low temperature, similar to the scenario suggested by Kubota & Done (2004). However, given the luminosities the sources would be in the hard state (e.g. Maccarone (2003)) but, except for CXO J013444.6+305535 (catalog ), the photon indices are larger than 2. CXO J013444.6+305535 (catalog ) could indeed be in the hard state with a photon index of 1.3 but that number is not well constrained. This hard source could also be a candidate for a magnetic CV that are known to have hard spectra and relatively high luminosities (Kuulkers et al., 2006). The soft power law in the other sources might on the other hand be another thermal component. Alternatively, the soft emission might be generated in an outflow from the system, or heating of a surrounding medium.
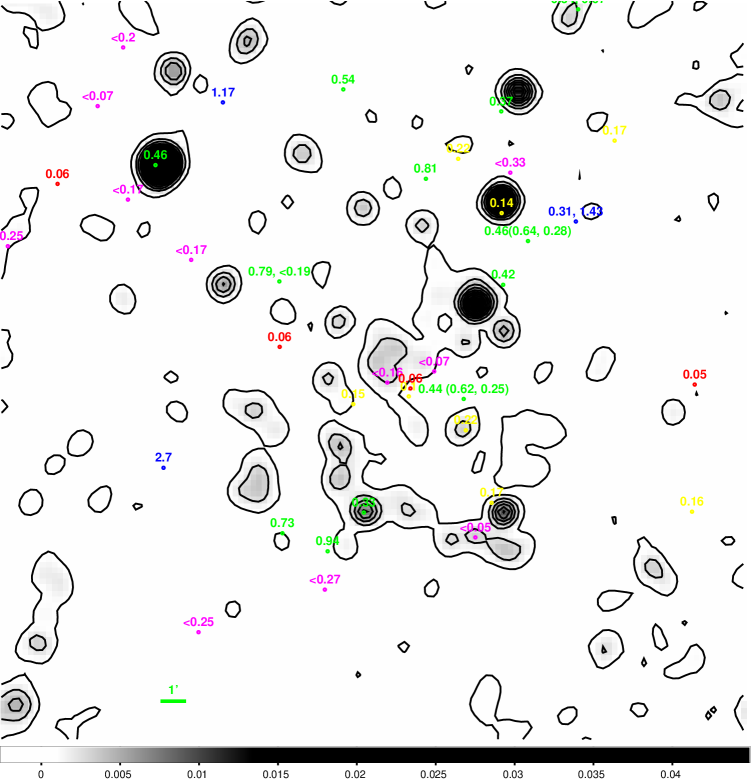
Fig. 5 shows a comparison of measured values for column density overlaid on a 1.49 GHz contour map of the central part of M33 from VLA (Condon, 1987). The resolution of the VLA map is about 1 arcminute, and the confusion limit is given as 0.1 mJy. There is no spatial correlation between the contour map and the magnitude of the measure column densities. Thus the X-ray absorption value is in parts due to location of sources in front of/behind HI gas, and in parts due to intrinsic absorption around the X-ray source.
To compare actual values for the column density due to HI, we compute the brightness temperature of the HI gas according to
| (2) |
with the radio flux in units of Jy/steradian at frequency (1.49 GHz), the opening angle of the beam (1’), and the brightness temperature; is the Boltzmann constant, the speed of light. Assuming optically thin emission we compute the HI column density according to
| (3) |
Within the size of a beam the radio flux has an RMS of 5 mJy around the zero point. Therefore we take 5 mJy as the upper limit on the sensitivity in a beam. This flux corresponds to 320 K or of cm-2, which is very close to the Galactic absorption value. Fig. 6 shows the comparison between the X-ray absorption values from spectral fitting and the “expected” absorption from HI.
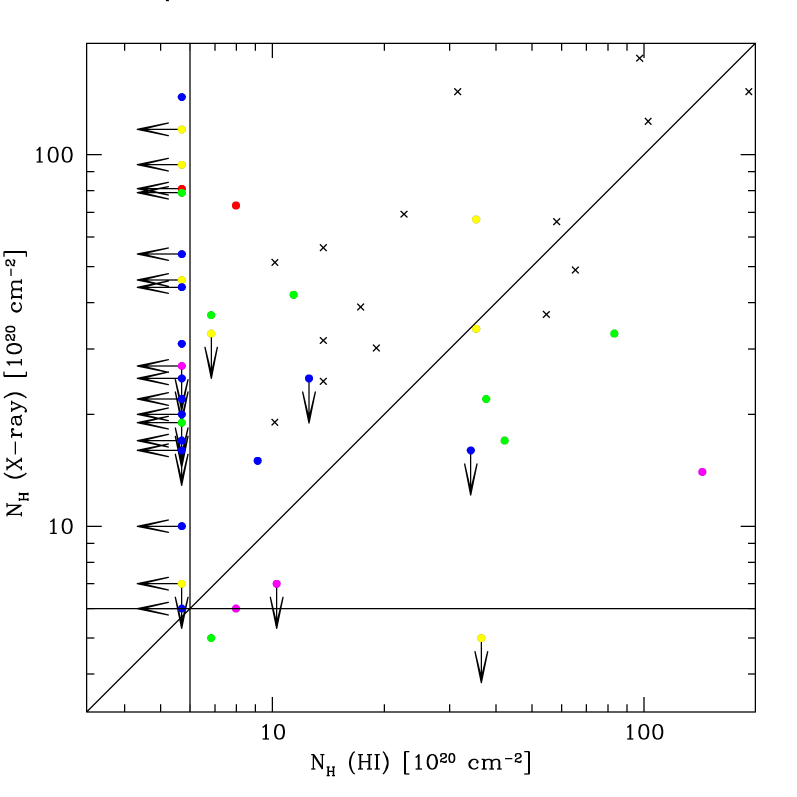
Filled circles are sources in M33, crosses are a selection of Galactic X-ray binaries from Vrtilek et al. (1991). Upper limits are shown as arrows. The vertical and horizontal lines denote the Galactic absorption value. The figure can be separated in roughly three regions: 1. Sources at or below the horizontal line, i.e. sources with apparently less absorption than the Galactic value, which probably have an undetected thermal component in the spectrum. 2. Sources below the diagonal line which are probably located in front of at least parts of the HI emission. These sources are most likely on the Milky Way facing side of M33. 3. Sources above the diagonal line are intrinsically absorbed. No conclusion as to their location can be drawn.
Values for Galactic X-ray binaries are taken from Vrtilek et al. (1991) and Liu et al. (2001) for values missing in the former. We convert the optical extinction to neutral hydrogen column density according to Predehl & Schmitt (1995) in units of cm-2, and use in cases where only the reddening in available. The comparison with Galactic X-ray binaries shows that M33 X-ray sources also often show excess absorption at levels comparable with Galactic X-ray binaries. The larger values for (HI) in the Milky Way can be explained simply by our location in the Milky Way, compared to the nearly face-on orientation of M33.
Only six of the 25 sources observed in more than one observation with more than 100 counts show significant variability in the hardness ratio diagram, see Appendix B. Three of the sources are the well known sources, M33 X-4, M33 X-5, and M33 X-13. The other three are CXO J013329.0+304216 (catalog ), CXO J013329.3+304508 (catalog ), and CXO J013410.5+303946 (catalog ). There is a clear separation in that most sources have a very small significance for moving in the hardness ratio diagram, whereas four of the ones that show changes in hardness ratio are above 99.99% confidence level.
Based on spectral shape (photon indices, temperatures) and absorption properties we conclude that M33 X-ray sources as a population are very similar to Galactic X-ray binaries.
4.4. Individual sources
Here we discuss the properties of individual bright M33 sources. These include previously known sources (M33 X-…) and sources newly discovered in our Chandra observations. Wide band spectral studies exist in the literature for some of these sources. In particular, BeppoSAX has observed the brightest sources in M33 and measured spectra of the sources M33 X-4 to M33 X-10 in the energy range from 2.0-10.0 keV (Parmar et al., 2001). Of these sources X-6 and X-10 are not in the field of view of the Chandra observations, and X-8 is the nucleus which is not discussed here.
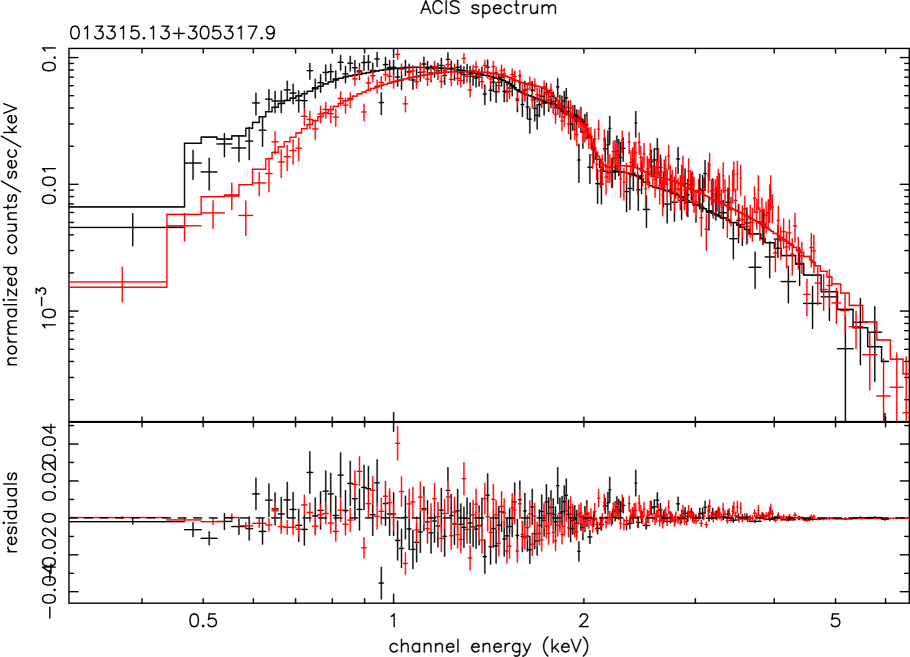
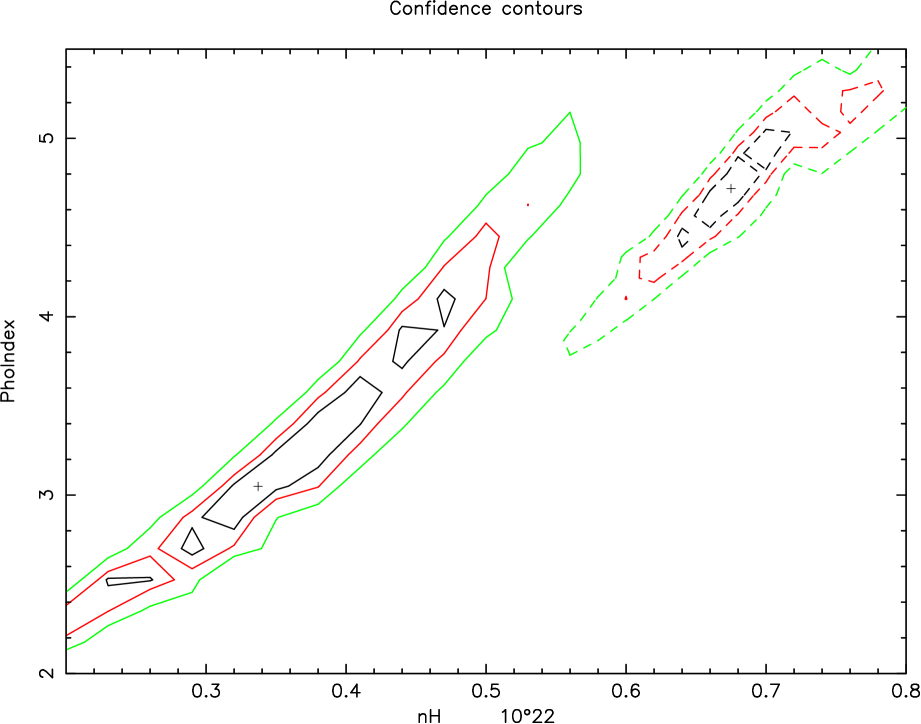
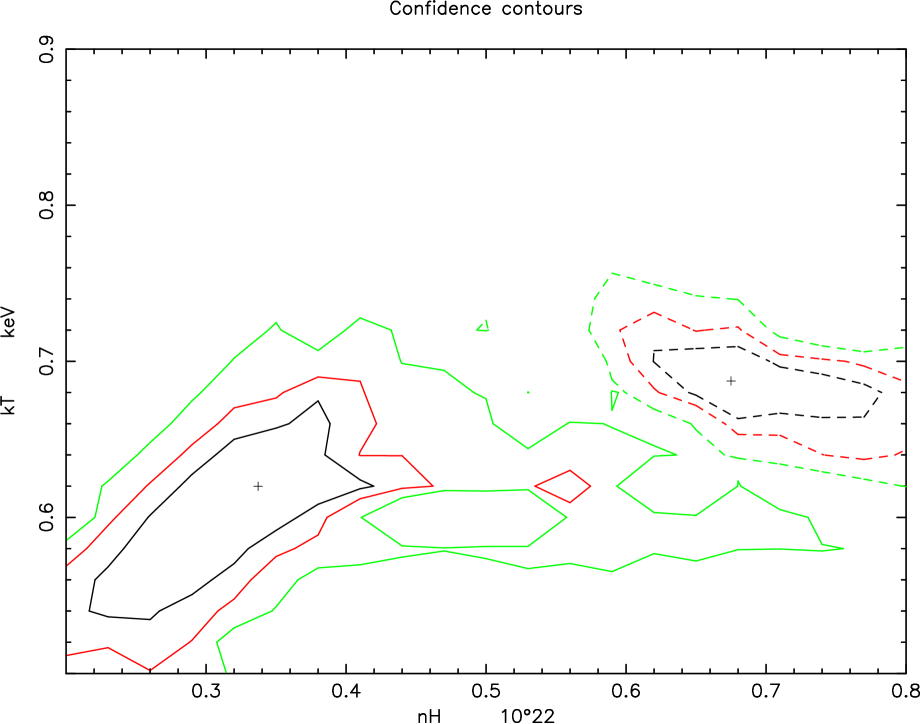
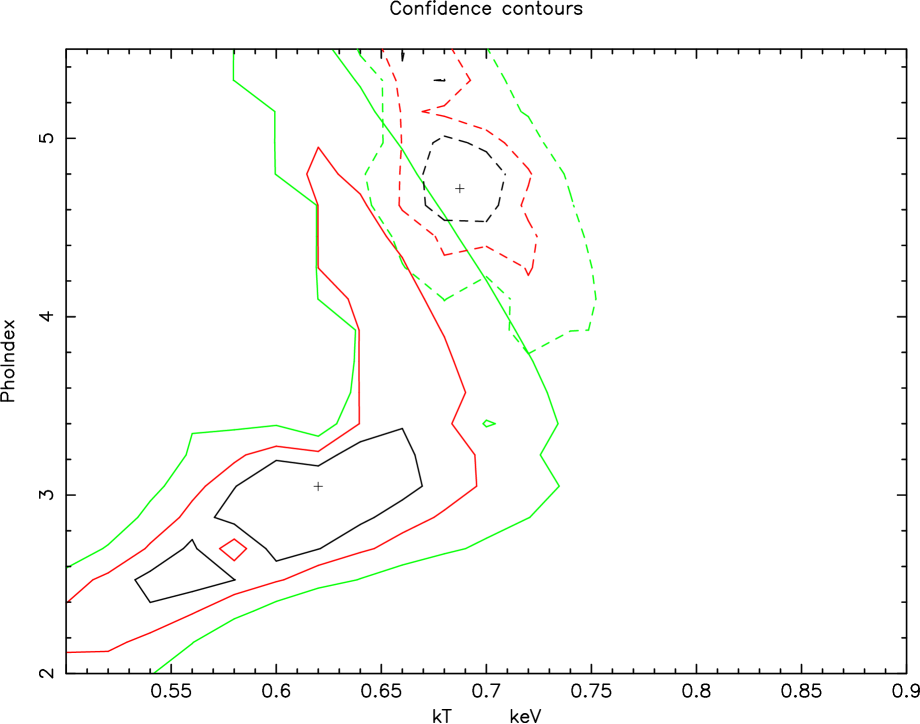
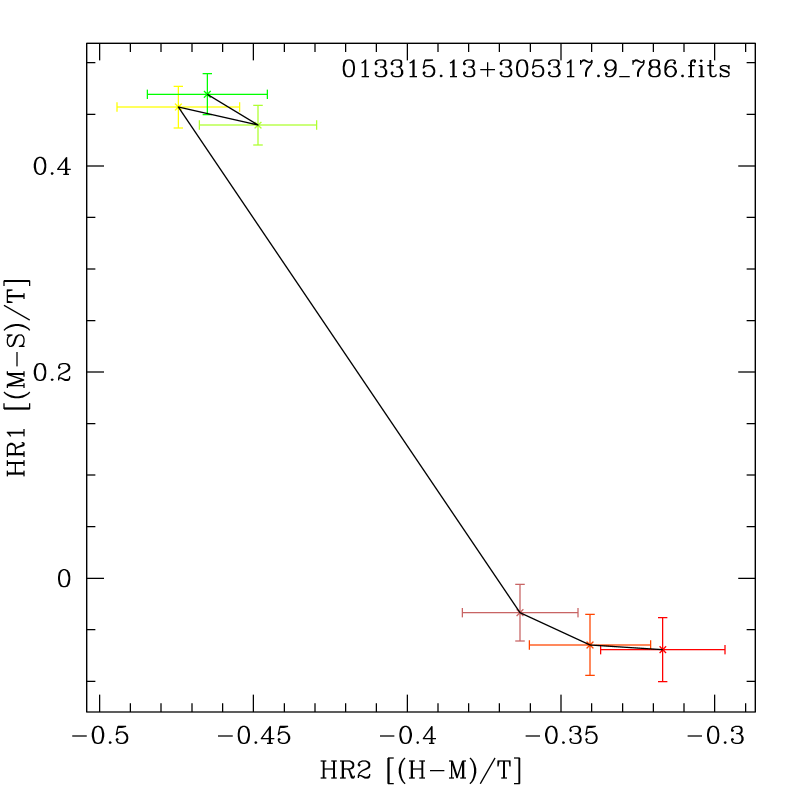
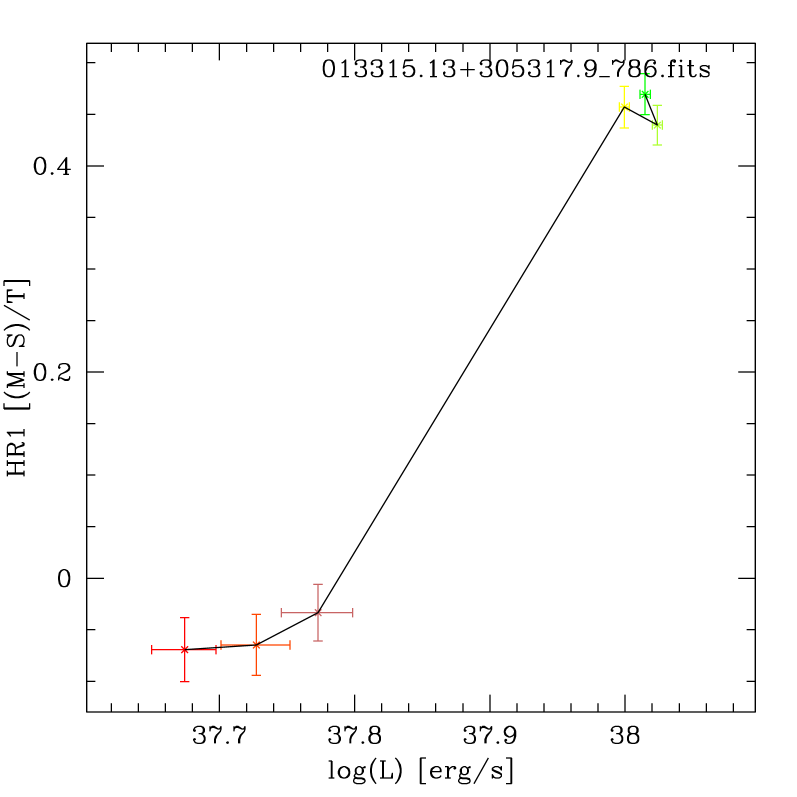
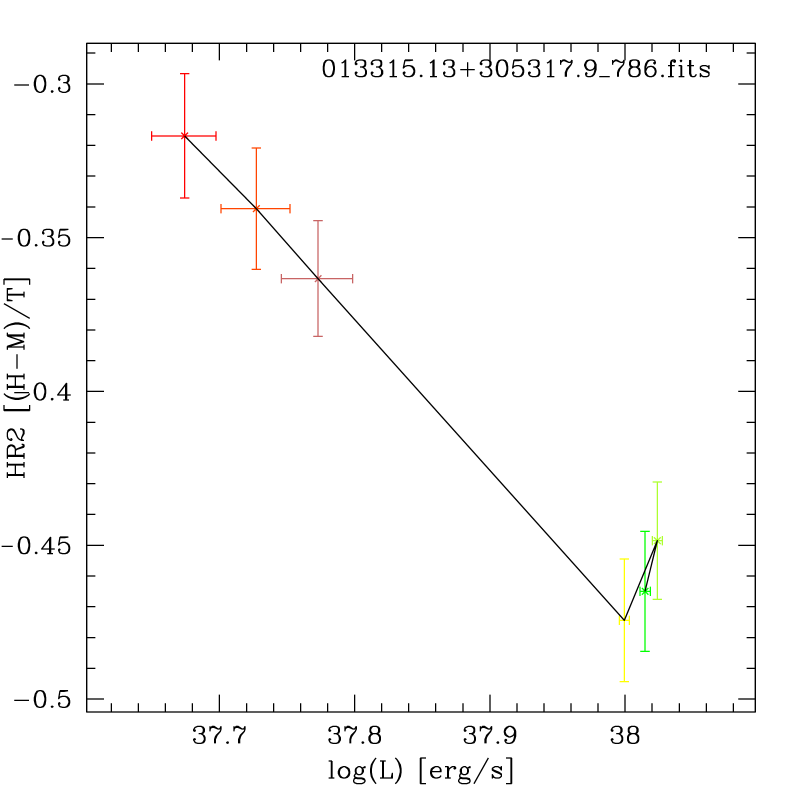
M33 X-4 (CXO J013315.1+305317 (catalog )): The X-ray spectrum of this soft source measured by BeppoSAX is well fit by either a power law model with photon index of 3 or a bremsstrahlung model with keV. This source has been observed by Chandra twice, in ObsIds 786 (catalog ADS/Sa.CXO#obs/00786) and 2023 (catalog ADS/Sa.CXO#obs/02023). Between the observations, the flux increased by a factor of two from erg s-1 to erg s-1. The variability rules out the interpretation of the source as a SNR (Okada et al., 2001). Using the overlapping energy range with the BeppoSAX observations, 2.0–8.0 keV, we obtain the same values for absorption, photon index, and bremsstrahlung temperature well within the errors and -values below 1 for observation 786 (catalog ADS/Sa.CXO#obs/00786). For observation 2023 (catalog ADS/Sa.CXO#obs/02023), although the best fit values are consistent with the BeppoSAX and ObsId 786 (catalog ADS/Sa.CXO#obs/00786) values, the -values are well above 2. Moreover, for the whole Chandra range, 0.3–8.0 keV, none of these models is a good fit. A statistically satisfactory fit for both ObsIds can be achieved with a model consisting of a black body and a power law. The black body temperatures (0.65 keV) and photon indices (3-4.7) for the two observations are consistent within the errors. However, the absorption to the source changes. Taking into account the different values for absorption there is a clear distinction at 99% confidence level in the contour plots, for versus and kT versus . The difference in versus kT is significant only at 90% confidence level. The black body temperature is relatively low, and does not change significantly, but similar values for disk black body temperatures have been observed in Galactic BHs. These temperatures occur at luminosities of 1–5% of the Eddington luminosity (Gierliński & Done, 2004). With a luminosity increasing from erg s-1 to erg s-1, this interpretation would make the compact object in X-4 a rather massive but still stellar mass BH given the luminosity. The photon index of the power law component is much softer than expected for a low-hard state black hole (Tanaka, 2001) but is in agreement with high-soft state Galactic black holes (McClintock & Remillard, 2006). The change in the photon index between the observations (from 3 to 4.7) does not indicate a state change from low-hard to high-soft. Even a photon index of 3 is too large for the low-hard state (1.7). The photon index is also in the range observed for the Galactic XRB Sco X-1 which has a neutron star primary (Bradshaw et al., 2003), but Sco X-1 does not exhibit a soft component like M33 X-4 (Kahn et al., 1984). Thus based on the X-ray data the source is likely to be a BH binary.
The hardness ratio analysis shows that the hardness of the source varies significantly between the observations. The source becomes harder in HR1 and softer in HR2, while the luminosity increases by a factor of 2. This change is due to the increase in the medium band (1.0–2.1 keV) with respect to the soft and hard band, which is reflected in the spectral fits by a higher absorption column and a lower power law photon index.
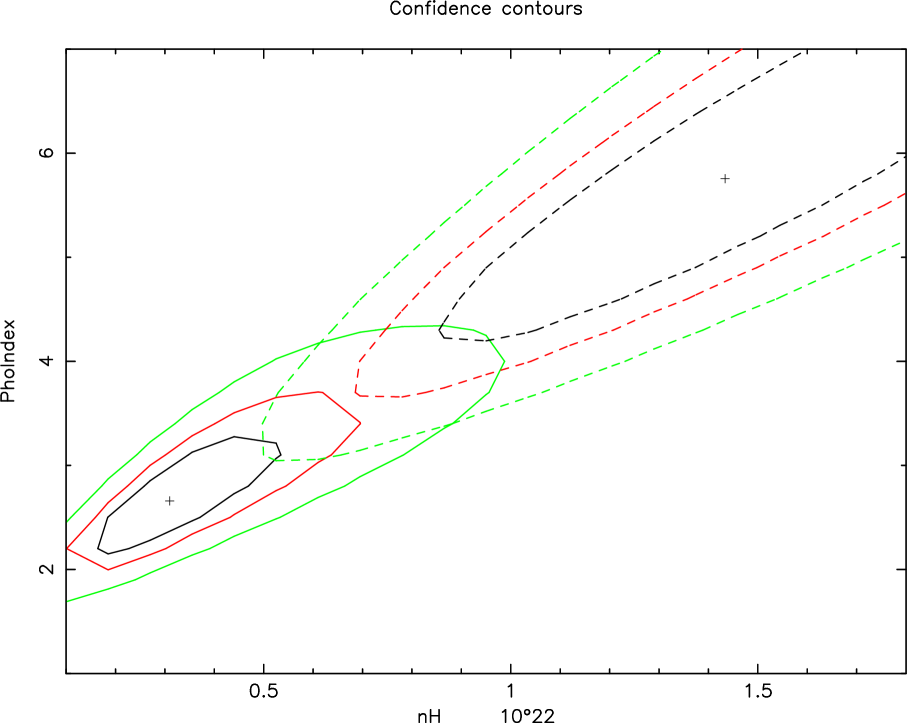
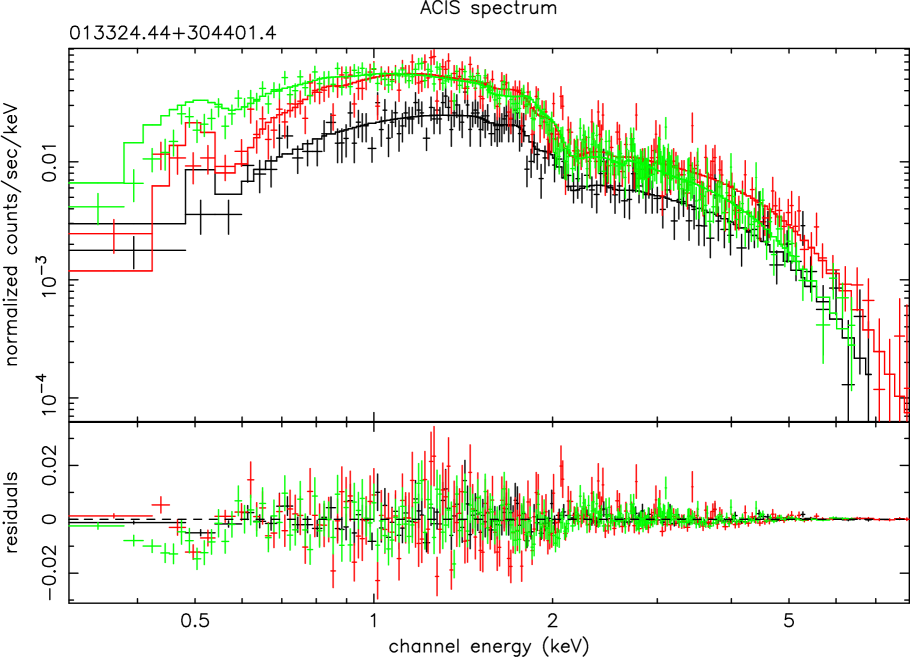
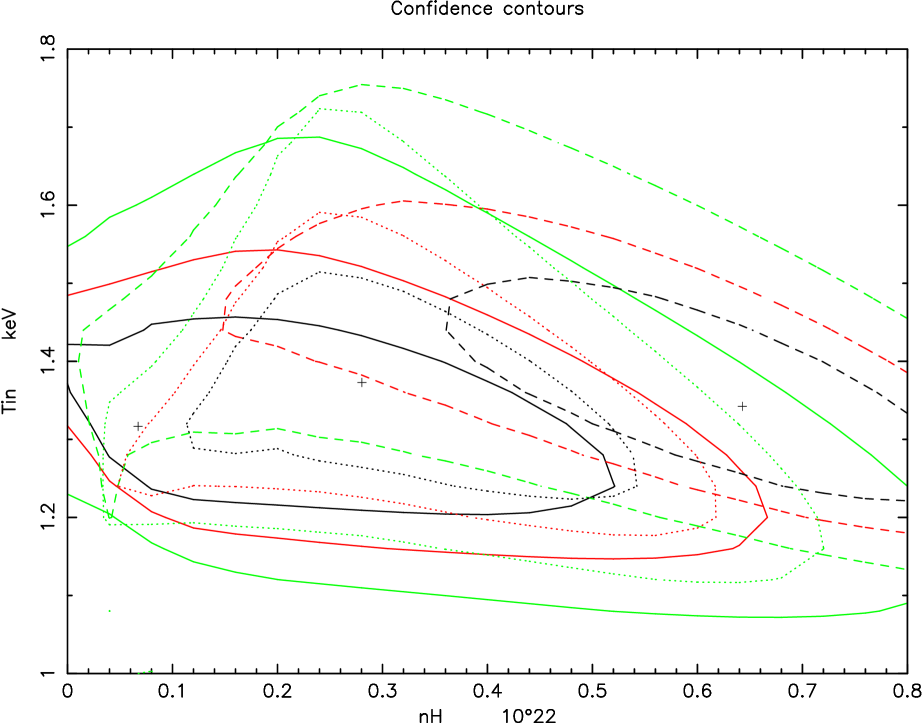
M33 X-5 (CXO J013324.4+304401 (catalog )): This source has been observed in all three Chandra observations. For M33 X-5 (CXO J013324.4+304401 (catalog )) BeppoSAX as well finds good fits with a soft power law () or bremsstrahlung model ( keV). In all Chandra observations the overlapping energy range is fit satisfactorily with these values. However, for the whole Chandra energy range neither a single power law nor a bremsstrahlung spectrum give good fits. A good fit is obtained with a disk black body (1.3 keV) and power law () combination. The contour plots in Fig. 9 (Appendix B) show no significant variation of the spectral parameters given the large uncertainties. The errors on the photon index are large enough to not make the changes between observations significant. However, a disk black body alone does not yield a good fit. The disk black body temperature is in good agreement with observations of Galactic BH binaries at moderately sub-Eddington luminosities (Gierliński & Done, 2004). The luminosity of the sources changes between erg s-1 and erg s-1; thus it is significantly below the Eddington limit for a black hole but in the range of transition luminosities from the low-hard to the high-soft state of Galactic black holes (Maccarone, 2003). Another interpretation is that the source is a neutron star and the steep power law corresponds to the harder thermal component from the neutron star surface (Tanaka, 2001). Due to the complexity of the combined model only the disk temperature is well determined.
However, the hardness ratio analysis shows significant variation between ObsIds 1730 (catalog ADS/Sa.CXO#obs/01730) and 786 (catalog ADS/Sa.CXO#obs/00786) on the one hand and ObsId 2023 (catalog ADS/Sa.CXO#obs/02023) on the other. X-5 becomes significantly softer in HR1 but does not change significantly in HR2. There seems to be no correlation with luminosity as ObsIds 786 (catalog ADS/Sa.CXO#obs/00786) and 2023 (catalog ADS/Sa.CXO#obs/02023) have the same luminosity but significantly different HR1 values.
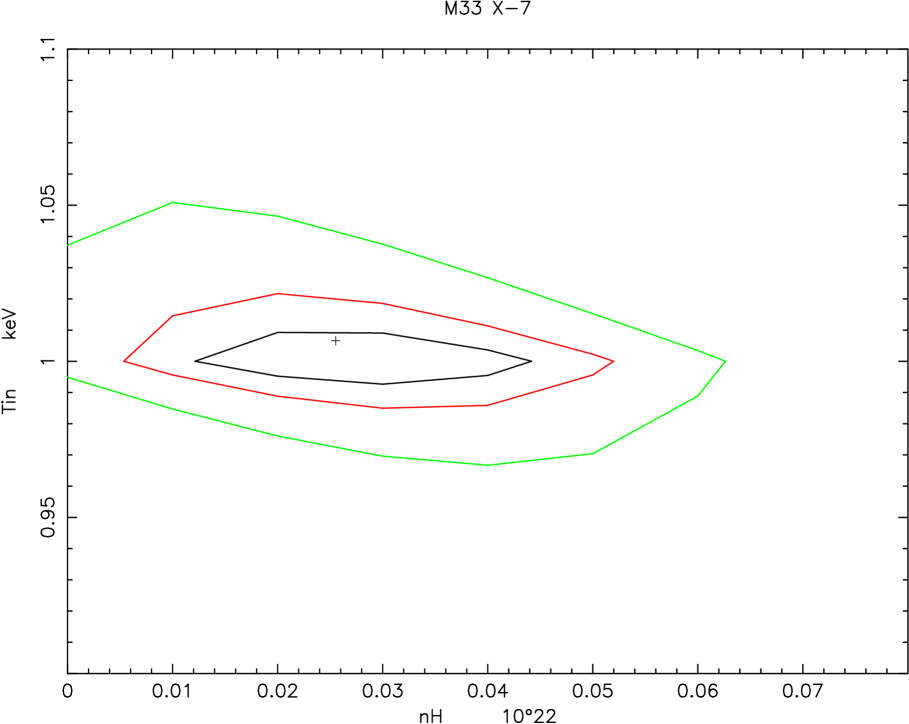
M33 X-7 (CXO J013334.1+303210 (catalog )): This source has been observed only in Chandra observation 1730 (catalog ADS/Sa.CXO#obs/01730). For M33 X-7 (CXO 013334.1+303210 (catalog )) BeppoSAX as well finds good fits with a power law () or bremsstrahlung model ( keV). In the 2.0–8.0 keV energy range both models provide satisfactory (power law) to good (bremsstrahlung) fits to the Chandra data. The photon indices for fixed and variable absorption are larger than in the BeppoSAX observations but still within the rather large errors. The bremsstrahlung temperatures for fixed and variable absorption are smaller, and in the case of fixed absorption inconsistent with the lower limit of the BeppoSAX observation. Although the errors are quite large this indicates that the source was softer in the Chandra observations. Moreover, M33 X-7 was about five times brighter in the Chandra observation ( erg s-1) compared to the time BeppoSAX observed the source ( erg s-1) (note that both luminosities are based on spectral fits). The only satisfactory fit to the whole energy range of Chandra is an absorbed disk blackbody with an inner disk temperature of keV. This value is consistent with inner disk temperatures of Galactic black holes (McClintock & Remillard, 2006). The column density is not well constrained, but below cm-2, putting the upper limit of the absorption at the Galactic value. Pietsch et al. (2004) obtain the same values within the errors for an XMM observation, and also new Chandra observations give the same spectral parameters (Pietsch et al., 2006). This might indicate the presence of an additional soft component that due to insufficient counts presents itself as a low absorption value. An additional soft component, however, does not improve the fit, and its parameters are not well determined. Fig. 7 shows the spectrum and the contour plot of absorption column density versus inner disk temperature. Given the softer spectrum in the Chandra observation, a possible additional soft component, and the five times higher luminosity, it is possible that X-7 underwent a state transition. On the other hand the photon index of the power law in the BeppoSAX spectrum is already softer than expected for a low-hard state source (Tanaka, 2001).

CXO J013343.4+304630 (catalog ) and CXO J013409.9+303219 (catalog ): These sources are the best candidates for super-soft sources (SSS) in M33. CXO J013343.4+304630 (catalog ) is well fit by a black body spectrum with a temperature of about 75 eV and moderate absorption (N cm-2). The source shows no significant spectral variability, but is variable on timescales of months. CXO J013409.9+303219 (catalog ) has been observed only once. Its spectrum is also well fit by a black body with a temperature of 37 eV and also moderate absorption (N cm-2). The temperatures are in the range for SSSs, and the sources are not significantly detected above 1 keV, see e.g. Kahabka & van den Heuvel (1997). Given their luminosities of erg s-1 (CXO J013343.4+304630 (catalog )) and erg s-1 (CXO J013409.9+30321 (catalog )) these sources are most likely nuclear burning white dwarfs.
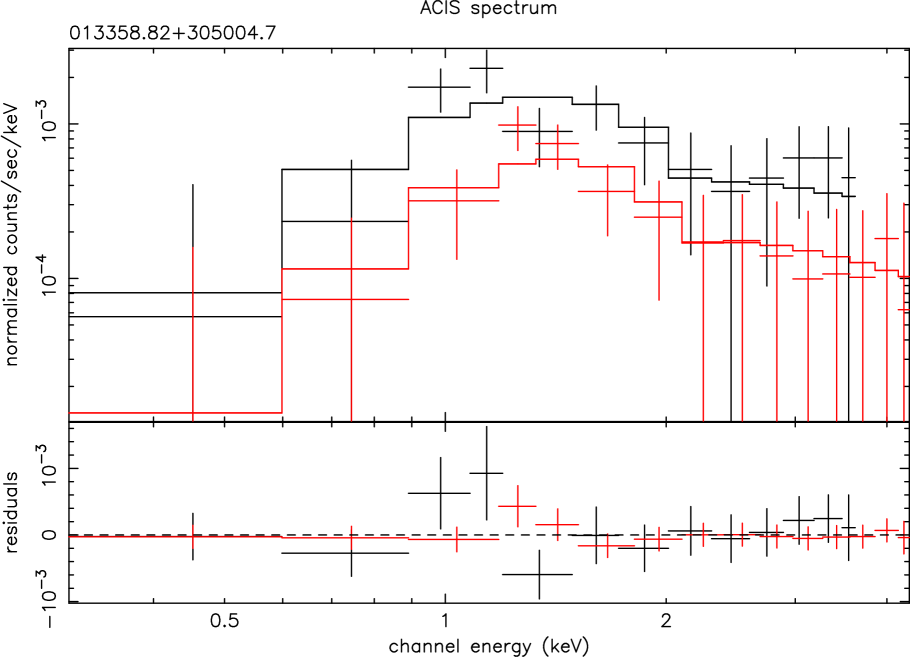
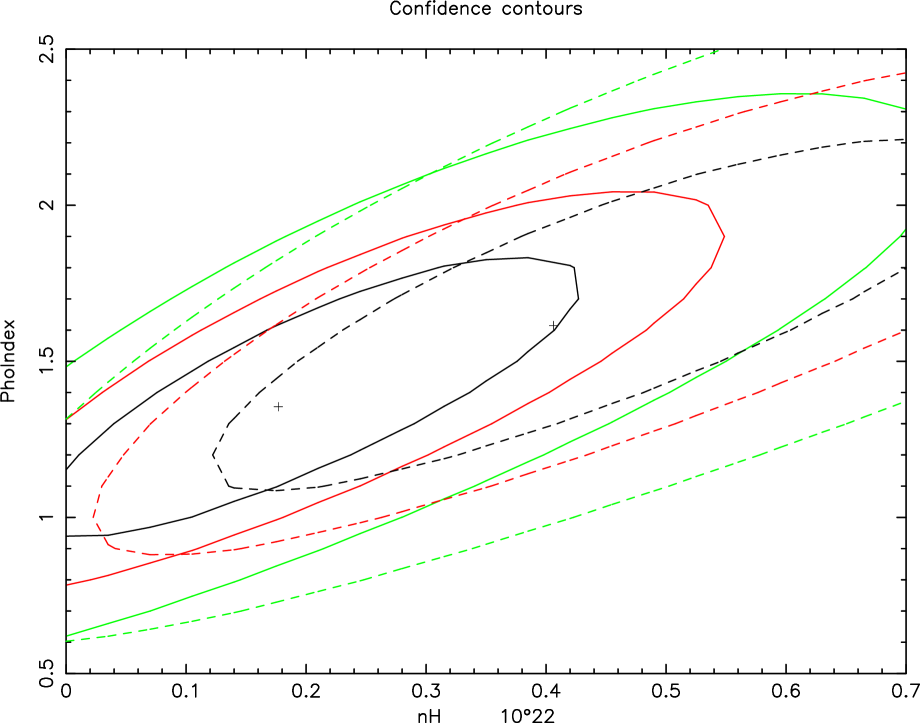
M33 X-9 (CXO J013358.8+305004 (catalog )): This source was observed in Chandra observations 786 (catalog ADS/Sa.CXO#obs/00786) and 2023 (catalog ADS/Sa.CXO#obs/02023). It is well fit by a power law with photon index of 1.2 in the BeppoSAX observation. For a bremsstrahlung model only lower limits to the temperature are provided ( keV). It is important to note that in the BeppoSAX observations X-9 is unresolved, but ROSAT observations have shown that X-9 actually consists of 3 sources, at least two of which seem to be variable and of comparable flux (Long et al., 1996). Since BeppoSAX does not resolve the sources, it is impossible to say if any of them dominate the spectrum and if yes which one. The Chandra source is associated with the source X-9a based on the ROSAT position. In the whole Chandra energy range a power law is a good fit. The absorption column is not well constrained in this fit, but the values for the photon index are , with a reduced of 0.87. Fig. 8 shows the spectrum and the contour plot of absorption column density versus photon index. Assuming for the sake of the argument that a significant fraction of the BeppoSAX flux originated from X-9a, the source was thus significantly harder during the BeppoSAX observation. Even if there is no spectral change in X-9 the source was then about a factor of ten brighter during the ROSAT observations where it reached erg s-1. Between the two Chandra observations the source luminosity decreases by a factor of 2 from erg s-1 to erg s-1 without a significant change in spectral parameters. Based on the variability, either spectral and/or timing, and the luminosity the source is thus highly likely to be an X-ray binary.
M33 X-13 (CXO J013354.8+303309 (catalog )) and CXO J013329.0+304216 (catalog ): These two sources have very soft bremsstrahlung temperatures ( 0.2 keV) but are also variable on timescales of months, thus excluding SNRs or HII regions as counterparts.
M33 X-13 (CXO J013354.8+303309 (catalog )) is well fit with a bremsstrahlung model with temperature keV and absorption of cm-2 in both observations. The source is coincident with a SNR (Gordon et al., 1999), but the flux varies by a factor of two between two observations. It also shows significant change in the hardness ratios. The source becomes softer in HR1 and harder in HR2. The flattening of the spectrum is accompanied by an increase in luminosity erg s-1 to erg s-1.
CXO J013329.0+304216 (catalog ) shows a significant softening in HR1 and hardening in HR2 from ObsId 1730 (catalog ADS/Sa.CXO#obs/01730) to ObsId 2023 (catalog ADS/Sa.CXO#obs/02023), the same behavior at similar hardness ratios like M33 X-13 (CXO J013354.8+303309 (catalog )). The spectrum of the source is well fit by a bremsstrahlung spectrum with a temperature decreasing from keV (ObsId 1730 (catalog ADS/Sa.CXO#obs/01730)) to keV (ObsId 786 (catalog ADS/Sa.CXO#obs/00786)) and to keV (ObsId 2023 (catalog ADS/Sa.CXO#obs/02023)). However, the temperature is somewhat degenerate with the column density which increases from cm-2 (ObsId 1730 (catalog ADS/Sa.CXO#obs/01730)) to cm-2 (ObsId 786 (catalog ADS/Sa.CXO#obs/00786)) and to cm-2 (ObsId 2023 (catalog ADS/Sa.CXO#obs/02023)). Although the column density changes systematically, the large errors make it impossible to choose which, if any, value is correct. Thus although the errors on the temperatures are small the significance of the temperature change from the spectral fit is not large. Between the Chandra observations the luminosity increases from erg s-1 to erg s-1.
Temperature and variability of these sources indicate that they could be quasi-soft sources, although a simple black body does not provide a good fit. However, more complicated models (e.g. black body plus power law) do not improve the fits due to the small number of observed counts. For quasi-soft sources the luminosities would be relatively low (a few erg s-1) but still in the range observed in other galaxies (Di Stefano & Kong, 2004). The sources are too bright ( erg s-1) for normal CVs ( erg s-1), and magnetic CVs that can reach such luminosities have very hard spectra with effective temperatures of several keV (Kuulkers et al., 2006). On the other hand the sources have too high temperatures for super-soft sources (Kahabka & van den Heuvel, 1997).
CXO J013329.3+304508 (catalog ) and CXO J013410.5+303946 (catalog ): The two sources show evidence for spectral variability in their hardness ratio diagrams. Source CXO J013329.3+304508 (catalog ) shows a significant softening in HR1 but no change in HR2 from ObsId 1730 (catalog ADS/Sa.CXO#obs/01730) to ObsId 2023 (catalog ADS/Sa.CXO#obs/02023). The best fit model for the spectrum is a bremsstrahlung model, however the temperature is not well determined in the fit. Moreover, the source is variable between ObsIds 786 (catalog ADS/Sa.CXO#obs/00786) and 2023 (catalog ADS/Sa.CXO#obs/02023), between which the luminosity decreases by 30% from erg s-1 to erg s-1. Source CXO J013410.5+303946 (catalog ) shows a softening in HR1 from ObsId 1730 (catalog ADS/Sa.CXO#obs/01730) to ObsId 786 (catalog ADS/Sa.CXO#obs/00786) but no significant change in HR2. From ObsId 786 (catalog ADS/Sa.CXO#obs/00786) to ObsId 2023 (catalog ADS/Sa.CXO#obs/02023) the HR1 hardens again so that the hardness ratio for ObsId 2023 (catalog ADS/Sa.CXO#obs/02023) is consistent with the hardness ratio for ObsId 1730 (catalog ADS/Sa.CXO#obs/01730). The spectrum of ObsIds 1730 (catalog ADS/Sa.CXO#obs/01730) and 2023 (catalog ADS/Sa.CXO#obs/02023) is well fit by a disk black body with an inner disk temperature 1.2 keV. The spectrum of ObsId 786 (catalog ADS/Sa.CXO#obs/00786) on the other hand is well fit by a power law with a photon index of 1.7. Both photon index and disk temperatures are consistent with Galactic X-ray binary spectra (Tanaka, 2001). It is interesting to note that the luminosity increases between the first two observations and stays high in the third, although the spectral shape in the first and third observation are basically identical. The source increased its luminosity between ObsIds 1730 (catalog ADS/Sa.CXO#obs/01730) and 786 (catalog ADS/Sa.CXO#obs/00786) from erg s-1 to erg s-1 and had the same high luminosity during ObsId 2023 (catalog ADS/Sa.CXO#obs/02023). Although the power law spectrum is relatively hard, the softening of the hardness ratio and the increasing luminosity do not indicate a state change in the system.
The spectral and timing behavior of the bright X-ray sources in M33 is varied but can be well described within the framework of Galactic X-ray sources and X-ray sources in other galaxies observed with Chandra .
5. Summary and Conclusion
In the three Chandra observations of M33, performed between the years 2000 and 2001, 261 sources have been detected in the range of X-ray luminosities from erg s-1 (0.3–8.0 keV). Of this total, 198 sources have been detected in at least two observations, and 62 sources have been observed in all three observations. We find that 49 sources show variability between observations above 3 sigma. For a total of 43 sources, 25 of which in more than one observation, the number of counts is sufficient for a more detailed spectral fitting. Given the angular extent of our survey we expect 3–4 AGN interlopers for sources with luminosities above erg s-1, and about one for sources with luminosities above erg s-1 (see Grimm et al. (2005)). All sources in M33, except for the nucleus, have luminosities below erg s-1.
Time variability: Roughly a quarter (49/198) of all Chandra sources exhibits long timescale variability (weeks–years), therefore we can exclude SNRs and HII regions in M33 as their counterparts. Except for two Galactic star interlopers none of the M33 sources show any short timescale X-ray variability (seconds–hours). Detection of such variability would separate stellar mass objects from AGNs, since in AGNs the light travel time is too large to produce variability on time scales shorter than hours. However, the amplitude of the long-term variability (larger than a factor of 2–3) makes it unlikely for the variable sources to be AGN (generally less than a factor of 2–3).
A significant number of sources showing long-term variability but little to no short-term variability is very similar to other extragalactic X-ray source populations. The comparison of the amplitude of long term variability with AGN and known X-ray binaries shows that a large majority of these sources are X-ray binaries.
X-ray spectra: The large majority of source spectra is well fit by models containing either a power law or a thermal plasma (bremsstrahlung or apec), but in the most luminous sources more complex models are required. Of the 43 sources with enough counts for detailed spectral modeling,
-
•
ten are well fit with spectral models consistent with accreting X-ray binaries, namely a disk black body or a black body plus power law. Three of the sources well described with a black body plus power law combination have black body temperatures at or below 0.1 keV. These are even lower than temperatures inferred from ULX intermediate mass black hole candidates, see e.g. Miller et al. (2004). The luminosities of these sources also do not indicate the presence of an intermediate mass black hole.
-
•
In addition, 16 sources are well fit by a single power law. With one exception all the photon indices are in the range 1–2, consistent with Galactic X-ray binaries (Tanaka, 2001). The photon indices are not inconsistent with AGN but we expect only 3 background AGN among the bright sources. Two thirds of the sources well fit by a single power law are also well fit by a disk black body model with inner disk temperatures in the range 1.0–3.0 keV, which would be consistent with Galactic BH and NS binaries (Tanaka, 2001).
-
•
There are also 4 sources with bremsstrahlung spectra and temperatures between 2–7 keV.
Moreover, 12 of 30 sources also show long term variability, confirming their nature as accreting objects. Therefore more than half (30) of the sources are consistent with being X-ray binaries based on the X-ray spectrum.
The majority (12) of the remaining 13 sources are well fit by thermal plasma models (bremsstrahlung or apec models as discussed above), 7 of which with relatively low temperatures around 0.2 keV. Five of these 12 sources are variable. Three sources with unusually low bremsstrahlung temperatures from 0.1–0.3 keV are also well fit by an apec model as well; one is variable. The apec temperatures of these sources are around 0.3 keV and abundances are consistent with the overall metallicity of M33 (Blair & Kirshner, 1985) (see Fig. 4). A black body model does not provide a good fit to the data. Five non-variable of the 12 sources are coincident with SNRs (Gordon et al., 1999). Variable sources in this category are candidates for quasi-soft sources.
Two sources are well fit by a single black body with temperatures of 75 eV and 37 eV respectively. One of the sources is a long term variable with no significant spectral variability. The other source has been observed only once. Both sources are not significantly detected above 1 keV. These sources are the best candidates for super-soft sources in M33.
Given the spectra, and variability, the majority of these sources are likely X-ray binaries, with a sizable fraction of SNRs/HII regions confirming a young X-ray source population.
Spectral variability: Six of the bright sources show evidence for spectral variability. The type of variability is varied, as has been seen in other galaxies as well (Zezas et al., 2006). The spectral variability is sometimes correlated with luminosity (M33 X-4, X-13), and sometimes not (M33 X-5). In the source X-4 and X-5 the spectral change seems to originate in the column density–photon index degeneracy. In both cases, the thermal component (black body or disk black body) remains constant, whereas the photon index and column density change their values. With the current data it is not possible to decide, if there is a change in column density within the system or a genuine change in the hard component, assuming that the model is a correct description. M33 X-13 and CXO J013329.0+304216 (catalog ) both show a continuous softening of the spectrum that is correlated in both cases with an increase in luminosity, and they could be identified with quasi-soft sources. The other two sources show significant change only in the soft band with only moderate change in luminosity.
Given the brightness, spectra, and variability (temporal and spectral) these sources are highly likely X-ray binaries.
A comparison of values measured from the X-ray spectra and HI radio observations of M33 shows that the X-ray absorption is larger for most sources than inferred from HI column density. A few sources have lower X-ray absorption than expected and may be located in front of the HI gas. However, the majority of sources is intrinsically absorbed. The absorption in X-rays can be compared with values observed in Galactic X-ray binaries, and is generally moderate at a few cm-2.
This comparison allows the localization of a few sources in M33, and indicates for most sources intrinsic absorption at the same level as observed in Galactic X-ray binaries.
The luminosity function of M33 sources and optical counterparts from Grimm et al. (2005) have shown that the X-ray source population in M33 is dominated by young objects. The long term variability, spectra, and spectral variability presented in this paper provide evidence that a large majority of sources are X-ray binaries. The properties of the X-ray binaries (variability, spectral parameters including absorption) are very similar to HMXBs in the Milky Way or the Magellanic Clouds. Thus X-ray binary populations do not show strong variations over the parameters, e.g. metallicity, covered by the Milky Way, M33, and the Magellanic Clouds. Thus the M33 X-ray source population confirms our knowledge about HMXB populations in the Milky Way and other galaxies. Therefore M33 can also be used as a comparison template for similar galaxies at larger distances, which is important as galaxies of this type are numerous.
Comparisons with previous X-ray missions show that repeated observations of a galaxy are important to study the X-ray source population in detail. This analysis also shows that especially with repeat observations it is possible to identify the major parts of an X-ray population on X-ray data alone. The ongoing deep Chandra survey of M33 will add significantly more data to such an analysis, and provide a more detailed picture of the M33 X-ray source population.
6. Acknowledgments
This work has been supported by NASA grant GO2-3135X and by grant AR6-7007X from Chandra X-ray Center operated by the SAO for NASA. This research has made use of the NASA/IPAC Extragalactic Database (NED) which is operated by the Jet Propulsion Laboratory, California Institute of Technology, under contract with the National Aeronautics and Space Administration. We thank the referee for constructive comments on the paper.
References
- Alexander et al. (2003) Alexander, D. M., Bauer, F. E., Brandt, W. N., Schneider, D. P., Hornschemeier, A. E., Vignali, C., Barger, A. J., Broos, P. S., Cowie, L. L., Garmire, G. P., Townsley, L. K.and Bautz, M. W., Chartas, G., & Sargent, W. L. W. 2003, AJ, 126, 539
- Blair & Kirshner (1985) Blair, W. P. & Kirshner, R. P. 1985, ApJ, 289, 582
- Bradshaw et al. (2003) Bradshaw, C. F., Geldzahler, B. J., & Fomalont, E. B. 2003, ApJ, 592, 486
- Cash (1979) Cash, W. 1979, ApJ, 228, 939
- Condon (1987) Condon, J. J. 1987, ApJS, 65, 485
- Di Stefano & Kong (2004) Di Stefano, R. & Kong, A. K. H. 2004, ApJ, 609, 710
- Freedman et al. (1991) Freedman, W. L., Wilson, C. D., & Madore, B. F. 1991, ApJ, 372, 455
- Gierliński & Done (2004) Gierliński, M. & Done, C. 2004, MNRAS, 347, 885
- Gordon et al. (1999) Gordon, S. M., Duric, N., Kirshner, R. P., Goss, W. M., & Viallefond, F. 1999, ApJS, 120, 247
- Grimm et al. (2005) Grimm, H.-J., McDowell, J., Zezas, A., Kim, D.-W., & Fabbiano, G. 2005, ApJS, 161, 271
- Hippelein et al. (2003) Hippelein, H., Haas, M., Tuffs, R. J., Lemke, D., Stickel, M., Klaas, U., & Völk, H. J. 2003, A&A, 407, 137
- Jenkins et al. (2005) Jenkins, L. P., Roberts, T. P., Warwick, R. S., Kilgard, R. E., & Ward, M. J. 2005, MNRAS, 357, 401
- Kahabka & van den Heuvel (1997) Kahabka, P. & van den Heuvel, E. P. J. 1997, ARA&A, 35, 69
- Kahn et al. (1984) Kahn, S. M., Seward, F. D., & Chlebowski, T. 1984, ApJ, 283, 286
- Kim et al. (2004) Kim, D.-W., Cameron, R. A., Drake, J. J., Evans, N. R., Freeman, P., Gaetz, T. J., Ghosh, H., Green, P. J., Harnden, F. R., Karovska, M., Kashyap, V., Maksym, P. W., Ratzlaff, P. W., Schlegel, E. M., Silverman, J. D., Tananbaum, H. D., Vikhlinin, A. A., Wilkes, B. J., & Grimes, J. P. 2004, ApJS, 150, 19
- Kraft et al. (1991) Kraft, R. P., Burrows, D. N., & Nousek, J. A. 1991, ApJ, 374, 344
- Kubota & Done (2004) Kubota, A. & Done, C. 2004, MNRAS, 353, 980
- Kuulkers et al. (2006) Kuulkers, E., Norton, A., Schwope, A., & Warner, B. 2006, Compact Stellar X-Ray Sources, ed. M. v. d. K. W.H.G. Lewin, Cambridge Astrophysics Series (Cambridge University Press)
- Liu et al. (2000) Liu, Q. Z., van Paradijs, J., & van den Heuvel, E. P. J. 2000, A&AS, 147, 25
- Liu et al. (2001) —. 2001, A&A, 368, 1021
- Long et al. (1996) Long, K. S., Charles, P. A., Blair, W. P., & Gordon, S. M. 1996, ApJ, 466, 750
- Maccarone (2003) Maccarone, T. J. 2003, A&A, 409, 697
- Markert & Rallis (1983) Markert, T. H. & Rallis, A. D. 1983, ApJ, 275, 571
- McClintock & Remillard (2006) McClintock, J. & Remillard, R. 2006, Compact Stellar X-Ray Sources, ed. M. v. d. K. W.H.G. Lewin, Cambridge Astrophysics Series (Cambridge University Press)
- Miller et al. (2004) Miller, J. M., Fabian, A. C., & Miller, M. C. 2004, ApJ, 614, L117
- Mushotzky et al. (1993) Mushotzky, R. F., Done, C., & Pounds, K. A. 1993, ARA&A, 31, 717
- Okada et al. (2001) Okada, Y., Takahashi, H., & Makishima, K. 2001, PASJ, 53, 663
- Paolillo et al. (2004) Paolillo, M., Schreier, E. J., Giacconi, R., Koekemoer, A. M., & Grogin, N. A. 2004, ApJ, 611, 93
- Parmar et al. (2001) Parmar, A. N., Sidoli, L., Oosterbroek, T., Charles, P. A., Dubus, G., Guainazzi, M., Hakala, P., Pietsch, W., & Trinchieri, G. 2001, A&A, 368, 420
- Pietsch et al. (2006) Pietsch, W., Haberl, F., Sasaki, M., Gaetz, T. J., Plucinsky, P. P., Ghavamian, P., Long, K. S., & Pannuti, T. G. 2006, ApJ, 646, 420
- Pietsch et al. (2004) Pietsch, W., Mochejska, B. J., Misanovic, Z., Haberl, F., Ehle, M., & Trinchieri, G. 2004, A&A, 413, 879
- Predehl & Schmitt (1995) Predehl, P. & Schmitt, J. H. M. M. 1995, A&A, 293, 889
- Prestwich et al. (2003) Prestwich, A. H., Irwin, J. A., Kilgard, R. E., Krauss, M. I., Zezas, A., Primini, F., Kaaret, P., & Boroson, B. 2003, ApJ, 595, 719
- Scargle (1998) Scargle, J. D. 1998, ApJ, 504, 405
- Schulman & Bregman (1995) Schulman, E. & Bregman, J. N. 1995, ApJ, 441, 568
- Sivakoff et al. (2005) Sivakoff, G. R., Sarazin, C. L., & Jordán, A. 2005, ApJ, 624, L17
- Stark et al. (1992) Stark, A. A., Gammie, C. F., Wilson, R. W., Bally, J., Linke, R. A., Heiles, C., & Hurwitz, M. 1992, ApJS, 79, 77
- Tanaka (2001) Tanaka, Y. 2001, in Black Holes in Binaries and Galactic Nuclei, ed. L. Kaper, E. P. J. van den Heuvel, & P. A. Woudt, 141–+
- Trinchieri et al. (1988) Trinchieri, G., Fabbiano, G., & Peres, G. 1988, ApJ, 325, 531
- van der Klis (2005) van der Klis, M. 2005, Compact stellar X-ray sources, ed. W. H. Lewin & M. van der Klis, Cambridge Astrophysics Series (Cambridge University Press)
- Vrtilek et al. (1991) Vrtilek, S. D., McClintock, J. E., Seward, F. D., Kahn, S. M., & Wargelin, B. J. 1991, ApJS, 76, 1127
- Zezas et al. (2006) Zezas, A., Fabbiano, G., Baldi, A., Schweizer, F., King, A. R., Ponman, T. J., & Rots, A. H. 2006, ApJ in press
Appendix A Time Variability
Table A1 presents the analysis results of variability between observations. We use Poissonian statistics for the background-subtracted source counts. The table shows only sources with variability above 3 between any two observation. The first column gives the name of the source, the next three columns give the fluxes, with errors in parentheses, for each observation if the source was detected, or 3 upper limits on the flux. The last three columns give the significance of variability between any two observations. Comparisons between upper limits are set to zero.
| Source | Flux [ cts/s/cm2] | Significance [] | ||||
|---|---|---|---|---|---|---|
| 1730 | 786 | 2023 | ||||
| CXO J013308.3+304802 | — | 66 (8.4) | 4.5 | — | 7.3 | — |
| CXO J013315.1+305317 | — | 3000 (46) | 5800 (62) | — | 36.3 | — |
| CXO J013315.5+304448 | 180 (18) | 170 (19) | 4.3 | 0.4 | 8.7 | 9.8 |
| CXO J013321.7+303858 | 24 (5.2) | — | 6.2 | — | — | 3.4 |
| CXO J013321.9+303921 | 22 (5.0) | — | 4.3 | — | — | 3.5 |
| CXO J013323.9+304821 | — | 46 (7.4) | 9.2 | — | 5.0 | — |
| CXO J013324.4+304401 | 1700 (39) | 2800 (45) | 2500 (31) | 18.5 | 5.5 | 16.1 |
| CXO J013327.7+304645 | 14 (4.3) | 20 (5.4) | 52 (6.6) | 0.9 | 3.8 | 4.8 |
| CXO J013328.6+304321 | 20 (4.7) | 19 (4.9) | 3.5 | 0.1 | 3.2 | 3.5 |
| CXO J013329.0+304216 | 150 (12) | 160 (11) | 200 (10) | 0.6 | 2.7 | 3.2 |
| CXO J013329.2+304537 | 34 (6.0) | 39 (6.5) | 6.2 | 0.6 | 5.0 | 4.6 |
| CXO J013329.2+304508 | 140 (11) | 170 (12) | 120 (8.2) | 1.8 | 3.4 | 1.5 |
| CXO J013333.0+304920 | — | 28 | 6.8 | — | 3.5 | — |
| CXO J013334.1+303714 | 43 (6.4) | — | 4.3 | — | — | 6.0 |
| CXO J013335.5+303728 | 12 (4.0) | 19 (3.7) | 4.3 | 1.3 | 4.0 | 1.9 |
| CXO J013336.3+303742 | 90 (9.1) | 48 (5.5) | 7.3 | 3.9 | 7.4 | 9.1 |
| CXO J013337.4+304718 | 71 (8.4) | 100 (9.7) | 29 (5.2) | 2.3 | 6.5 | 4.3 |
| CXO J013339.2+304049 | 50 (6.7) | 47 (8.4) | 6.2 | 0.3 | 4.9 | 6.5 |
| CXO J013340.0+304323 | 32 (5.6) | 23 (4.7) | 9.5 | 1.2 | 2.9 | 4.0 |
| CXO J013341.5+304136 | 26 (5.0) | 37 (5.6) | 10.7 | 1.5 | 4.7 | 3.1 |
| CXO J013341.8+303848 | 70 | 150 | 200 | 6.8 | 3.8 | 10.4 |
| CXO J013342.5+304253 | 15 (4.2) | 56 (6.8) | 11.8 | 5.1 | 6.5 | 0.8 |
| CXO J013343.4+304630 | 20 (8.8) | 61 (7.7) | 79 (7.5) | 3.5 | 1.7 | 5.1 |
| CXO J013344.2+304026 | 12 | 30.8 | 5 | 2.3 | 3.9 | 1.5 |
| CXO J013346.2+303807 | 3.5 | 4.3 | 90 (9.0) | 0.0 | 9.5 | 9.6 |
| CXO J013350.5+303821 | 27 (5.1) | 57 (5.7) | 11.8 | 3.9 | 7.9 | 3.0 |
| CXO J013353.6+303605 | 10.4 | 9.9 (2.9) | — | 0.2 | — | — |
| CXO J013354.8+303309 | 120 (10) | 230 (12) | — | 7.0 | — | — |
| CXO J013356.8+303729 | 37 (8.4) | 83 (6.7) | — | 4.3 | — | — |
| CXO J013358.8+305004 | — | 93 (9.8) | 36 (4.5) | — | 5.3 | — |
| CXO J013409.8+305044 | — | 3.8 | 33 (4.5) | — | 5.3 | — |
| CXO J013410.3+305346 | — | 5 | 23 (3.8) | — | 4.7 | — |
| CXO J013410.5+303946 | 72 (7.9) | 120 (8.0) | 120 (7.7) | 4.3 | 0.0 | 4.4 |
| CXO J013416.7+305101 | — | 7.7 | 27 (3.7) | — | 5.2 | — |
| CXO J013419.2+304942 | — | 5 | 17 (3.0) | — | 4.0 | — |
| CXO J013424.6+304428 | 5.1 | 26 (6.0) | 6.8 | 3.5 | 3.2 | 0.0 |
| CXO J013425.3+304157 | 15.2 | 33 (6.2) | 11 (2.9) | 2.9 | 3.2 | 1.4 |
| CXO J013426.7+304811 | — | 3.5 | 14 (2.8) | — | 3.8 | — |
| CXO J013429.1+304212 | 13 (4.5) | 14.7 | 7.5 (2.2) | 0.4 | 3.3 | 1.1 |
| CXO J013429.7+305026 | — | 7.7 | 34 (3.9) | — | 6.7 | — |
| CXO J013432.1+305158 | — | 5 | 93 (13) | — | 6.8 | — |
| CXO J013432.5+305035 | — | 5 | 15 (3.0) | — | 3.3 | — |
| CXO J013432.7+303436 | 51 (8.3) | 3.6 | — | 5.7 | — | — |
| CXO J013433.7+304701 | — | 430 (27) | 280 (14) | — | 4.9 | — |
| CXO J013435.0+304439 | — | 7.7 | 17 (3.0) | — | 3.1 | — |
| CXO J013436.4+304713 | — | 50.3 | 23 (3.3) | — | 3.1 | — |
| CXO J013446.7+304449 | — | 6.4 | 21 (3.3) | — | 4.4 | — |
| CXO J013449.0+304446 | — | 6.4 | 34 (4.0) | — | 6.9 | — |
| CXO J013451.1+304356 | — | 3.5 | 30 (3.8) | — | 7.0 | — |
| CXO J013451.9+304615 | — | 120 (14) | 48 (4.8) | — | 4.9 | — |
Appendix B Spectra
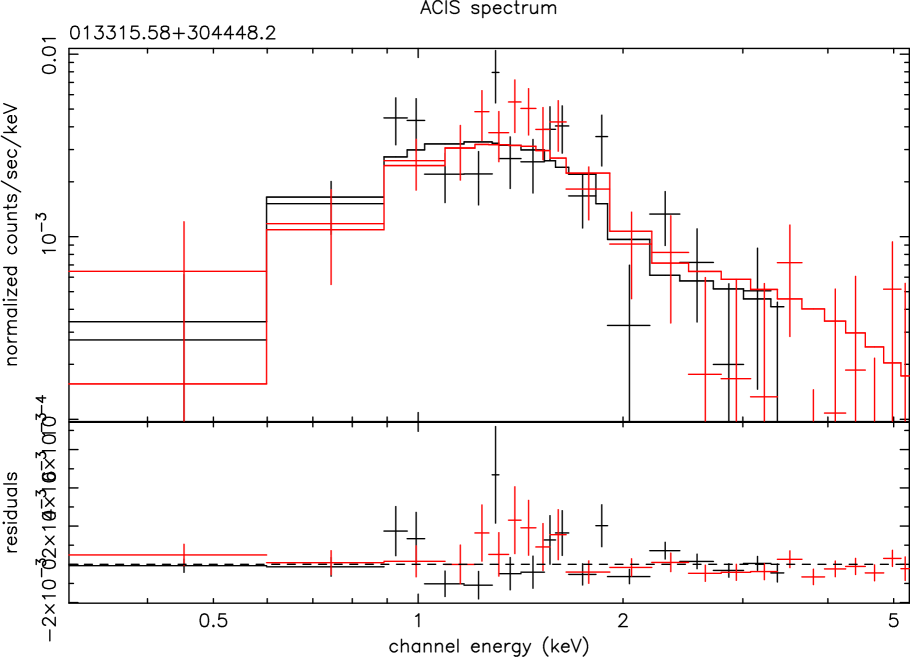
The spectra are combined in one plot. Black corresponds to the first observation, red to a second observation, and green to a third obervation. For easier comparison contour plots are also overlaid for all observations. Solid contours correspond to the first observation, dashed contours to the second observation, and dotted to the third observation. Note that not all sources are observed in all observations.
Some sources are well-fit by a bremsstrahlung model with low temperatures. We also fit these spectra with an APEC model which also provides a good fit. In case the APEC model provides a good fit as well we give the parameters and contour plots in the table and figures.
| Source | ObsId | XSPEC model | parameters | |||||
|---|---|---|---|---|---|---|---|---|
| [ cm-2] | kT, T0, Tin, E, : [keV], | |||||||
| Z: [solar abund.] | ||||||||
| kT | ||||||||
| CXO J013253.4+303817 (catalog ) | 1730 | bremss | 0.05 | 7.1 | ||||
| (M33 X-1) | ||||||||
| CXO J013253.9+303312 (catalog ) | 1730 | pow | 0.16 | 1.9 | ||||
| (M33 X-2) | ||||||||
| kT | ||||||||
| CXO J013308.3+304802 (catalog ) | 786 | bremss | 0.17 | 2.3 | ||||
| kT | ||||||||
| CXO J013315.1+305317 (catalog ) | 786 | bbody+pow | 0.34 | 0.62 | 3.0 | |||
| (M33 X-4) | 2023 | bbody+pow | 0.67 | 0.69 | 4.7 | |||
| CXO J013315.5+304448 (catalog ) | 1730 | pow | 0.31 | 2.7 | ||||
| 786 | pow | 1.43 | 5.8 | |||||
| Tin | ||||||||
| CXO J013324.4+304401 (catalog ) | 1730 | diskbb+pow | 1.3 | 9.5uuParameter unconstrained at 90% CL | ||||
| (M33 X-5) | 786 | diskbb+pow | 0.64 | 1.3 | 5.7 | |||
| 2023 | diskbb+pow | 0.28 | 1.4 | 3.5 | ||||
| kT | ||||||||
| CXO J013327.7+304645 (catalog ) | 2023 | bbody+pow | 1.2uuParameter unconstrained at 90% CL | 3.0 | ||||
| kT | ||||||||
| CXO J013329.0+304216 (catalog ) | 1730 | bremss | 0.34 | 0.23 | ||||
| 786 | bremss | 0.37 | 0.20 | |||||
| 2023 | bremss | 0.55 | 0.16 | |||||
| kT | Z | |||||||
| 1730 | apec | 0.36 | 0.11 | |||||
| 786 | apec | 0.4 | 0.22 | |||||
| 2023 | apec | 0.25 | 0.28 | 0.22 | ||||
| kT | Z | |||||||
| CXO J013329.3+304508 (catalog ) | 1730 | apec | 0.14 | 4.7 | ||||
| 786 | apec | 8.2 | ||||||
| 2023 | apec | 17.2 | 2.0uuParameter unconstrained at 90% CL | |||||
| kT | ||||||||
| CXO J013329.4+304912 (catalog ) | 786 | bremss | 0.49 | 0.15 | ||||
| 2023 | bremss | 0.37 | 0.2 | |||||
| kT | Z | |||||||
| 786 | apec | 0.31 | 0.3 | |||||
| 2023 | apec | 0.26 | 0.05 | |||||
| kT | E1/2 | |||||||
| CXO J013331.1+303333 (catalog ) | 1730 | bremss | 0.17 | 0.29 | 0.89 | |||
| (M33 X-14) | +2*gauss | 1.35 | ||||||
| Tin | ||||||||
| CXO J013334.1+303210 (catalog ) | 1730 | diskbb | 1.0 | |||||
| (M33 X-7) | ||||||||
| kT | ||||||||
| CXO J013335.9+303627 (catalog ) | 1730 | bremss | 0.22 | 0.31 | ||||
| kT | Z | |||||||
| 1730 | apec | 0.40 | 0.12 | |||||
| CXO J013336.3+303742 (catalog ) | 1730 | pow | 0.62 | 2.1 | ||||
| 786 | pow | 0.25 | 1.2 | |||||
| CXO J013337.4+304718 (catalog ) | 1730 | pow | 1.9 | |||||
| 786 | pow | 0.22 | 2.0 | |||||
| 2023 | pow | 0.8 | ||||||
| kT | Z | |||||||
| CXO J013341.8+303848 (catalog ) | 1730 | apec | 0.70 | 0.17 | ||||
| 786 | apec | 0.70 | 0.12 | |||||
| 2023 | apec | 0.72 | ||||||
| kT | ||||||||
| CXO J013343.4+304630 (catalog ) | 1730 | bbody | 0.79ffParameter fixed | 0.07ffParameter fixed | ||||
| 786 | bbody | 0.79 | 0.07 | |||||
| 2023 | bbody | 0.83 | 0.08 | |||||
| kT | kT | Z | ||||||
| CXO J013346.2+303807 (catalog ) | 2023 | bbody+apec | 0.06ffParameter fixed | 0.02 | 3.1 | 0.3ffParameter fixed | ||
| CXO J013346.5+303748 (catalog ) | 1730 | pow | 1.6 | |||||
| 786 | pow | 0.1 | 1.1 | |||||
| CXO J013350.5+303821 (catalog ) | 1730 | pow | 1.6 | |||||
| 786 | pow | 1.5 | ||||||
| kT | ||||||||
| CXO J013354.8+303309 (catalog ) | 1730 | bremss | 0.30 | 0.22 | ||||
| (M33 X-13) | 786 | bremss | 0.36 | 0.18 | ||||
| CXO J013356.8+303729 (catalog ) | 1730 | pow | 0.15ffParameter fixed | 1.5ffParameter fixed | ||||
| 786 | pow | 0.15 | 1.5 | |||||
| CXO J013358.8+305004 (catalog ) | 786 | pow | 1.7 | |||||
| (M33 X-9a) | 2023 | pow | 0.54 | 1.8 | ||||
| kT | Z | |||||||
| CXO J013401.5+303136 (catalog ) | 786 | apec+pow | 0.94 | 6.3uuParameter unconstrained at 90% CL | 0.3ffParameter fixed | 3.4 | ||
| kT | ||||||||
| CXO J013402.0+303004 (catalog ) | 786 | bbody+pow | 0.04 | 1.8 | ||||
| kT | ||||||||
| CXO J013409.9+303219 (catalog ) | 786 | bbody | 0.73 | 0.037 | ||||
| Tin | ||||||||
| CXO J013410.5+303946 (catalog ) | 1730 | diskbb | 0.06ffParameter fixed | 1.2 | ||||
| 786 | pow | 0.06ffParameter fixed | 1.7 | |||||
| Tin | ||||||||
| 2023 | diskbb | 0.06ffParameter fixed | 1.2 | |||||
| kT | ||||||||
| CXO J013410.6+304223 (catalog ) | 1730 | bremss | 0.79 | 0.11 | ||||
| 2023 | bremss | 0.3 | ||||||
| Tin | ||||||||
| CXO J013421.2+304932 (catalog ) | 2023 | diskbb | 1.17 | 1.7 | ||||
| Ebreak | ||||||||
| CXO J013425.4+302821 (catalog ) | 786 | bknpow | 2.9 | 0.16 | ||||
| CXO J013425.5+305514 (catalog ) | 786 | pow | 0.16 | 2.1 | ||||
| 2023 | pow | 0.17 | 2.0 | |||||
| CXO J013427.0+304314 (catalog ) | 786 | pow | 0.9 | |||||
| 2023 | pow | 1.7 | ||||||
| kT | ||||||||
| CXO J013432.0+303455 (catalog ) | 1730 | bremss | 2.7 | 2.7 | ||||
| kT | ||||||||
| CXO J013433.7+304701 (catalog ) | 786 | bbody+pow | 0.1 | |||||
| 2023 | bbody+pow | 0.46 | 0.09 | 4.6 | ||||
| kT | ||||||||
| CXO J013435.1+305646 (catalog ) | 2023 | bremss | 1.1 | 4.7 | ||||
| CXO J013438.8+304538 (catalog ) | 786 | pow | 1.6 | |||||
| 2023 | pow | 1.8 | ||||||
| CXO J013438.8+305504 (catalog ) | 2023 | pow | 0.06 | 1.9 | ||||
| CXO J013439.8+305143 (catalog ) | 2023 | pow | 1.5 | |||||
| Tin | ||||||||
| CXO J013444.5+304922 (catalog ) | 786 | diskbb | 2.7 | |||||
| 2023 | diskbb | 0.46 | ||||||
| kT | ||||||||
| CXO J013444.6+305535 (catalog ) | 2023 | bbody+pow | 0.15 | 0.03uuParameter unconstrained at 90% CL | 1.3 | |||
| CXO J013451.9+304615 (catalog ) | 786 | pow | 0.06ffParameter fixed | 1.1 | ||||
| 2023 | pow | 0.06ffParameter fixed | 1.7 | |||||
| CXO J013453.2+305718 (catalog ) | 2023 | pow | 0.27 | 2.1 | ||||
| CXO J013501.1+304345 (catalog ) | 786 | pow | 1.8 | |||||
| 2023 | pow | 1.9 | ||||||
![[Uncaptioned image]](/html/0706.3927/assets/x28.png)
![[Uncaptioned image]](/html/0706.3927/assets/x29.png)
![[Uncaptioned image]](/html/0706.3927/assets/x30.png)
![[Uncaptioned image]](/html/0706.3927/assets/x31.png)
![[Uncaptioned image]](/html/0706.3927/assets/x32.png)
![[Uncaptioned image]](/html/0706.3927/assets/x33.png)
![[Uncaptioned image]](/html/0706.3927/assets/x34.png)
![[Uncaptioned image]](/html/0706.3927/assets/x35.png)
![[Uncaptioned image]](/html/0706.3927/assets/x36.png)
![[Uncaptioned image]](/html/0706.3927/assets/x37.png)
![[Uncaptioned image]](/html/0706.3927/assets/x38.png)
![[Uncaptioned image]](/html/0706.3927/assets/x39.png)
![[Uncaptioned image]](/html/0706.3927/assets/x40.png)
![[Uncaptioned image]](/html/0706.3927/assets/x41.png)
![[Uncaptioned image]](/html/0706.3927/assets/x42.png)
![[Uncaptioned image]](/html/0706.3927/assets/x43.png)
![[Uncaptioned image]](/html/0706.3927/assets/x44.png)
![[Uncaptioned image]](/html/0706.3927/assets/x45.png)
![[Uncaptioned image]](/html/0706.3927/assets/x46.png)
![[Uncaptioned image]](/html/0706.3927/assets/x47.png)
![[Uncaptioned image]](/html/0706.3927/assets/x48.png)
![[Uncaptioned image]](/html/0706.3927/assets/x49.png)
![[Uncaptioned image]](/html/0706.3927/assets/x50.png)
![[Uncaptioned image]](/html/0706.3927/assets/x51.png)
![[Uncaptioned image]](/html/0706.3927/assets/x52.png)
![[Uncaptioned image]](/html/0706.3927/assets/x53.png)
![[Uncaptioned image]](/html/0706.3927/assets/x54.png)
![[Uncaptioned image]](/html/0706.3927/assets/x55.png)
![[Uncaptioned image]](/html/0706.3927/assets/x56.png)
![[Uncaptioned image]](/html/0706.3927/assets/x57.png)
![[Uncaptioned image]](/html/0706.3927/assets/x58.png)
![[Uncaptioned image]](/html/0706.3927/assets/x59.png)
![[Uncaptioned image]](/html/0706.3927/assets/x60.png)
![[Uncaptioned image]](/html/0706.3927/assets/x61.png)
![[Uncaptioned image]](/html/0706.3927/assets/x62.png)
![[Uncaptioned image]](/html/0706.3927/assets/x63.png)
![[Uncaptioned image]](/html/0706.3927/assets/x64.png)
![[Uncaptioned image]](/html/0706.3927/assets/x65.png)
![[Uncaptioned image]](/html/0706.3927/assets/x66.png)
![[Uncaptioned image]](/html/0706.3927/assets/x67.png)
![[Uncaptioned image]](/html/0706.3927/assets/x68.png)
![[Uncaptioned image]](/html/0706.3927/assets/x69.png)
![[Uncaptioned image]](/html/0706.3927/assets/x70.png)
altern. APEC model:
![[Uncaptioned image]](/html/0706.3927/assets/x71.png)
![[Uncaptioned image]](/html/0706.3927/assets/x72.png)
![[Uncaptioned image]](/html/0706.3927/assets/x73.png)
![[Uncaptioned image]](/html/0706.3927/assets/x74.png)
![[Uncaptioned image]](/html/0706.3927/assets/x75.png)
![[Uncaptioned image]](/html/0706.3927/assets/x76.png)
![[Uncaptioned image]](/html/0706.3927/assets/x77.png)
![[Uncaptioned image]](/html/0706.3927/assets/x78.png)
![[Uncaptioned image]](/html/0706.3927/assets/x79.png)
![[Uncaptioned image]](/html/0706.3927/assets/x80.png)
![[Uncaptioned image]](/html/0706.3927/assets/x81.png)
![[Uncaptioned image]](/html/0706.3927/assets/x82.png)
![[Uncaptioned image]](/html/0706.3927/assets/x83.png)
Spectra without well defined confidence contours and color variations:
![[Uncaptioned image]](/html/0706.3927/assets/x84.png)
![[Uncaptioned image]](/html/0706.3927/assets/x85.png)
![[Uncaptioned image]](/html/0706.3927/assets/x86.png)