Structure Formation Inside Triaxial Dark Matter Halos:
Galactic Disks, Bulges and Bars
Abstract
We investigate the formation and subsequent co-evolution of galactic disks immersed in assembling live dark matter (DM) halos. Disk and halo structural components have been evolved from the cosmological initial conditions and represent the collapse of an isolated density perturbation. The baryonic component includes gas (which participates in star formation [SF]) and stars. The feedback from the stellar energy release onto the ISM has been implemented, and so is the mass, momentum and energy balance between the stellar and gaseous components. We find that (1) The growing triaxial halo figure tumbling is insignificant and the angular momentum () is channeled into the internal circulation, while the baryonic collapse is stopped by the centrifugal barrier; (2) Density response of the (disk) baryonic component is out of phase with the DM, thus diluting the inner halo flatness and washing out its prolateness over the time period of the disk growth; (3) The total is neathly conserved, even in models accounting for feedback from stellar evolution; i.e., the baryons lose and the DM acquires of their original ; baryons and DM within the disk radius have the same after the first Gyr; (4) The specific for the DM is nearly constant, while that for baryons is decreasing with time; (5) Early stage of disk formation resembles the cat’s cradle — a small amorphous disk fueled via radial string patterns; followed by growing oval disk whose shape varies with its orientation to the halo major axis, and so is the strength of a pair of grand-design arms developed in the disk; (6) The initially puffed up gas component in the disk thins when the SF rate drops below ; (7) About 40%-60% of the baryons remain outside the SF region of the disk or in the halo in the form of a hot gas by the end of the simulations; (8) Obtained rotation curves appear to be flat and account for the observed disk/halo contributions (the halo virial mass is at ); (9) A range of bulge-dominated to bulgeless disks was obtained, depending on the energy thermalization parameter, , which characterizes the feedback from the stellar evolution — smaller leads to a larger and earlier bulge; Lower density threshold for SF leads to a smaller, thicker disk; gravitational softening in the gas has a substantial effect on various aspects of galaxy evolution and mimics a number of intrinsic processes within the interstellar medium; (10) The models are characterized by an extensive bar-forming activity within the central few kpc whose properties vary with the bar-halo orientation; (11) Nuclear bars, dynamically coupled and decoupled form in response to the gas inflow along the primary bars, as shown by Heller, Shlosman & Athanassoula.
Subject headings:
galaxies: evolution – galaxies: formation – galaxies: halos – galaxies: kinematics and dynamics – galaxies: structure – cosmology: dark matter1. Introduction
Hierarchical Cold Dark Matter (CDM) cosmology has been largely successful in establishing the paradigm of structure formation and evolution on spatial scales of kpc, corresponding to individual halos, and beyond (e.g., Cole et al. 2000; Steinmetz & Navarro 2002; Spergel et al. 2003). However, on smaller scales, a number of fundamental issues related to the origin of luminous galactic components and their structural parameters remain unresolved because of our limited understanding of dynamical processes, such as mass and angular momentum redistribution, star formation (SF) and the energy and momentum feedback from the stellar evolution onto the interstellar medium (ISM). Specifically, no concensus exists at present on formation of galactic disks, bulges, bars and supermassive black holes (SBHs, e.g., White & Rees 1978; Fall & Efstathiou 1980; White 1996; Ellis 2000). Because these structures are made from the baryonic matter, either gas or stars or their mixture, a certain degree of dissipation must be involved. Detection of quasars at redshifts (e.g., Fan et al. 2001; Mathur, Wilkes & Gosh 2002; Bertoldi et al. 2003), when the age of the Universe was less than a gigayear, rises intriguing questions about the origin of their host galaxies within the framework of the hierarchical clustering, and is important for the fate of the SBH — bulge correlation, i.e., , and the masses of the quasar host galaxies, at these (e.g., Trenti & Stiavelli 2007). In this work we investigate how various dissipative processes, including the SF and the feedback from stellar evolution onto the ISM, affect the galactic disk and bulge formation and evolution. For this purpose we follow a monolithic collapse of an initial perturbation in the DM and baryons within the Hubble flow.
When exactly did the disks and other structural elements of disk galaxies, like bulges, bars and central SBHs, assemble? How much evolution has occured since? Both orbital and ground-based telescopes have began to tighten the constraints on these issues, but essential details still missing and controversies are abound. First, within the hierarchical merging scenario, the so-called ‘angular momentum catastrophe’ — the angular momentum () distribution of the collapsing baryonic matter does not match that of the observed disks in nearby Universe (e.g., Sommer-Larsen, Gotz & Portinari 2002; Maller & Dekel 2002; van den Bosch 2002b; Burkert & D’Onghia 2004). This distribution is characterized by low and high tails which result both in the over-extended disks and very massive bulges. In addition, gravitational torques between the collapsing baryons and the DM halos lead to disks with radial scalelengths substantially smaller than those observed. Under the assumption of conservation during the collapse, the specific generated by the random work in the expanding Universe is too small to explain the formation of bulgeless disks in the late type galaxies (van den Bosch, Burkert & Swaters 2001; van den Bosch 2002a).
The second issue is that of the ‘core catastrophe’ (e.g., Moore et al. 1999) and relates to the DM central density distribution. The numerical simulations of DM halo formation have shown that these attain a universal density profile which can be nicely fitted by a two-parameter family (Navarro et al. 1996, hereafter NFW). However, observations of disk galaxies and galaxy clusters indicate that the DM halos have flat density cores rather than NFW cusps (e.g., Flores & Primack 1994; Moore 1994; Burkert 1995; Kravtsov et al. 1998; Salucci & Burkert 2000; Boriello & Salucci 2001; de Blok & Bosma 2002; Sand et al. 2004). The standard picture of slow adiabatic collapse of a smooth baryonic component in the centers of such halos can only lead to a larger central concentration, making matters worse. El-Zant, Shlosman & Hoffman (2001) and El-Zant et al. (2004) have shown that a flattening of the central density cusps can be a natural outcome of energy deposition by the accreted clumpy baryons via a dynamical friction both in galaxies and in clusters of galaxies. Alternatively, Weinberg & Katz (2002) and Holley-Bockelmann, Weinberg, Katz (2005) have claimed that the cusps can be leveled through the action of the stellar bars, but this was strongly disputed by Sellwood (2003) and McMillan & Dehnen (2005).
Third, Abraham et al. (1999) and van den Bergh et al. (2002) have claimed that the fraction of stellar bars sharply decreases above the redshifts of , while the analysis of GEMS survey (Rix et al. 2004) of 1600 galaxies has shown that both the fraction of bars and their size and axial ratio distributions remain largely unchanged up to at least (Jogee et al. 2004). This latter evidence is supported by Elmegreen et al. (2004) and Sheth et al. (2003) based on much smaller samples of 186 and 4 galaxies respectively.
Finally, the DM halos resulting from cosmological simulations appear to be strongly triaxial, both in their prolateness and flatness,111We define the density prolateness as , where is the intermediate-to-major axis ratio and the flatness as with — the minor-to-major axis ratio in the DM halo and (e.g., Allgood et al. 2006). On the other hand, halo shapes inferred from observations in the local Universe are axisymmetric, although individual objects may exhibit some mild degree of prolateness (e.g., Rix & Zaritsky 1995; Merrifield 2002). Theoretical arguments supplemented by numerical simulations have shown that bars are incompatible with prolate halos (El-Zant & Shlosman 2002; Berentzen, Shlosman & Jogee 2006). When taken in tandem with the plethora of stellar bars observed locally (e.g., Marinova & Jogee 2007; Menendez-Delmestre et al. 2007; Knapen, Shlosman & Peletier 2000) and at the intermediate redshifts of , corresponding to the lookback time of 8 Gyr (Jogee et al. 2004), these results indicate strongly that the halo shapes have evolved only mildly during this time period. Furthermore, Dubinski (1994) and Kazantzidis et al. (2004) have shown that the halos lose some of their triaxiality when baryons are added. In the next step, Berentzen & Shlosman (2006) have simulated the disk growth in an assembling DM halo within the Mpc comoving box. The initial conditions have been produced by means of the constrained realizations algorithm of Hoffman & Ribak (1991). The halo prolateness was found to be washed out within the disk radius, and the halo flatness to decrease substantially.
The strongly nonlinear process of galaxy formation coupled with a long list of dissipative processes provide a strong insentive for a numerical approach. A number of numerical methods to follow up the disk formation have been attempted. In the models of Immeli et al. (2004), when the gas in the proto-disk cools efficiently, the disk fragments and forms a number of massive clumps of stars and gas. These clumps spiral in to the galactic center and merge there to produce a strong starburst, as also shown by Shlosman & Noguchi (1993), leaving a central object which resembles a classical bulge. The disk growth was simulated in a fixed spherically-symmetric external potential of the DM halo by adding the gas directly to the disk. Alternatively, Samland & Gerhard (2003) have modeled a disk and the associated DM halo growth by adopting the mass inflow rate from separate cosmological simulations, while preserving the spherical symmetry of the halo, using a chemo-dynamical code. A number of issues have been investigated, among them the stellar population of the bulge. A possibility of forming bars from baryonic spheroids immersed in triaxial DM halos was considered by Gadotti & de Souza (2003; see also El-Zant et al. 2003).
Sommer-Larsen, Götz & Portinari (2003) analyzed the formation history of two galaxies with circular velocities comparable to the Milky Way (MW) and found gas accretion rates, and hence X-ray halo luminosities, at , 6–7 times larger than at for these objects. More generally, it is found that the gas infall rates onto these disks are nearly exponentially declining with time, both for the total disk and for the “solar cylinder.” This result supports the exponentially declining gas infall approximation often used in the chemical evolution models.
Okamoto et al. (2005) has investigated the effect of the SF feedback on the morphological evolution of galaxies by assuming that the SF can proceed in two modes — either in the high density or shock-triggered fashion. The former mode leads to elliptical galaxies while the latter to disk ones. The authors made a number of assumptions that require a further validation, e.g., the SPH kernel was fixed at the constant mass and not on the constant number of particles.
The simulations of Governato et al. (2004, 2007) form rotationally-supported disks with realistic exponential scalelengths and fit both the band and baryonic Tully-Fisher relations (see also Stinson et al. 2006; Kaufmann et al. 2007). An extended stellar disk forms inside the MW-sized halo immediately after the first merger. The combination of the UV background and supernova (SN) feedback drastically reduces the number of visible satellites orbiting within this halo, bringing it in a fair agreement with observations. Formation of stellar populations in the MW-type galaxy were studied by Scannapieco et al. (2006) using a combination of high-resolution -body simulations with semi-analytical methods of metal enrichment. Substantial constraints on the formation of Population III stars have been obtained. Brook et al. (2007b) have followed up with chemodynamical simulations, including the SF, concluding that surveys of low-metallicity stars in the Galactic halo can directly constrain the properties of Population III stars. Furthermore, the disk evolution was simulated by Brook et al. (2007a), examining the possibility that high elements-to-iron abundance ratios detected in the thick-disk component of the Milky Way can be explained by SF during the gas-rich mergers.
All the above studies have brought a very useful insight into the formation of disk galaxies and have contributed to a better understanding of specific aspects of the problem. Yet, as already mentioned, the problem is very complex and much more remains to be investigated, in particular regarding the dynamics of forming disks, the interaction between the various morphological components and subcomponents, as well as their origin and properties. The present paper aims to advance of some of these open questions. Our emphasis is more on the dynamical aspects and includes discussions of the formation of bars, both inner and outer, made in such ab initio simulations. Our algorithm includes the SF, the feedback from the stellar evolution, etc. We also performed a relatively large number of simulations, so as to gain insight on how the SF and energy feedback affect the structural properties of the galaxy components and subcomponents. We use cosmological initial conditions and follow the Hubble expansion and the subsequent collapse of a single perturbation in the gas and the DM in order to analyze the role of different processes in the formation of disk and bulge components. We aim at understanding the role of the external cosmological and internal dissipative factors.
Section 2 describes the details of our method of modeling the SF, our approach in determinig the shapes of spheroidal and disk components, and the initial conditions used for numerical simulations. Sections 3 and 4 present results of our simulations and model comparison. Discussion follows in the last section.
2. Numerical Methods
2.1. Modeling the Gas, Stars and DM
The numerical simulations have been performed with an updated version of the FTM-4.4 hybrid code which evolves the collisionless (-body) and gaseous (Smooth Particle Hydrodynamics, SPH) components (Heller & Shlosman 1994; Heller 1995), with and . In addition, a number of models have been evolved using the parallel version, FTM-4.5, of the code. The gravitational forces were computed using the public version of the routine falcON (Dehnen 2002), which is about ten times faster than optimally coded Barnes & Hut (1986) tree code. The tolerance parameter is fixed at 0.55.
The energy equation describing the internal state of the SPH particles have been used to evolve a multiphase ISM by calculating its heating and cooling rates and iterating for the temperature. Star formation was used to convert SPH particles into collisionless particles which exert an energy feedback onto the surrounding gas. The gravitational softening for the collisionless DM and stellar particles is pc, except for two models specified in Table 1. For the SPH particles we use two options to soften the gravity — constant softening of pc or 250 pc, and a dynamic softening (Heller & Shlosman 1994) with the minimum of pc.
A large number of tests has been performed to check the sensitivity of the results to the algorithm and its parameters. A typical run with the DM only conserved the energy to within 1% and to within 0.1%.
2.2. Star Formation
We anticipate that the SF processes and the associated feedback from stellar evolution coupled with an overall dissipative and collisionless dynamics within the forming galaxy determine its evolutionary path. Strictly speaking, because the smallest spatial scales resolved here are substantially larger than scales which are relevant for an ‘individual’ SF event, the underlying collapse should be treated witin the context of the two-fluid Jeans instability (Zel’dovich & Novikov 1975) in a sheared medium. We adopt the modified prescription for the SF from Heller & Shlosman (1994) that required the gas to be Jeans unstable and subject to the feedback from OB stellar winds and supernovae (SN), and introduced a number of statistical elements. Our main assumption is that the SF takes place in regions which are contracting, i.e.,
| (1) |
and are Jeans unstable, i.e.,
| (2) |
which assures that the collapse would continue unhindered down to the smallest resolved spatial scales. Under this condition, the pressure gradients (which are established over the sound crossing time ) will not be able to build up during the collapse time . Moreover, if the gas cooling time satisfies , this will ease the condition given by eq. (2), which, for simplicity, can be replaced by for temperatures in excess of K (e.g., Navarro & White 1993). This happens because the cooling function has a minimum at K.
For larger densities than , the short cooling time will be guaranteed if the neutral (cold) gas will be at least moderately self-gravitating in the background density ,
| (3) |
Here corresponds for the neutral gas (i.e., H I and He I), and combines the mass of the ionized (hot) gas, stars and DM, with being the fudge factor. For the standard model, (see Table 1).
Gas is converted into stars at a rate
| (4) |
where the SF (collapse) timescale is taken as , with . In reality, the collapse time for molecular clouds is extended beyond the free-fall time, e.g., because of an additional support from the MHD turbulence. We have used for the standard model.
Next, we introduce the probability that a gas particle of mass produces a stellar particle of mass during a given timestep of length of
| (5) |
where and . Here represents the stellar mass which is produced in the SF event. However, a stellar particle with a mass of only is created as of the mass is instantaneously recycled back to the parent gas particle, along with an increment in its metallicity by , where is the metals yield (Leitherer, Robert & Drissen 1992). The quantity is not allowed to be less than unity, in which case we set and , and the gas particle is removed from the simulation. Each gas particle is capable of creating four generations of stars with different metallicities and decreases accordingly after each SF event. The mass of the stellar particle represents a cluster of stars. The fraction and timing of massive stars that produce the OB line-driven winds and SN are calculated assuming the Salpeter IMF.
2.3. Feedback from Stellar Evolution
The thermal balance in the interstellar gas is calculated using the energy equation. Sources of heating and cooling include adiabatic, viscous and radiative processes. The balance of the specific internal energy along with the gas ionization fractions (H, H+, He, He+, He++, e) and the mean molecular weight are computed as a function of density and temperature for an assumed optically thin primordial composition gas (Katz et al. 1996). This allows for the computation of the neutral gas density required for the SF criteria of eqs. (1–3).
To model the energy feedback from the stellar evolution onto the gas, the newly formed stellar particles inject energy from SN and OB stellar winds into the surrounding gas particles. The total rate of energy deposition by stars, , is given by,
| (6) |
for , and
| (7) |
for . Here is an energy thermalization parameter, is the age of a stellar particle and are the energy deposition rates per solar mass by massive stars and SN, respectively. The metallicity of a stellar particle is given by in units of the solar metallicity (Maeder 1992, 1993). The timestep of such ‘active’ stellar particles (and of all the gas particles) is restricted to being smaller than yrs in order to properly resolve the feedback timescale of yrs.
The gas particles in the vicinity of the ‘active’ stellar particles are treated in the following way. Their radiative cooling is temporarily disabled when receiving the energy from a stellar particle and when the condition in eq. (2) is still fullfilled. The energy is thermalized and deposited in the gas in the form of a thermal energy, then converted to kinetic energy through the equations of motion. This method is preferable over injecting a fraction of the stellar energy directly in the form of a kinetic energy — this approach is ambiguous and the results are sensitive to the value of a timestep and to the particle number on the receiving end.
For a comparison, we have also run some models with an isothermal equation of state (EOS), implementing the feedback by directly over-pressuring the gas through an increase of the local sound speed over the isothermal value. Specifically the sound speed, , is increased by,
| (8) |
2.4. Halo Shape Determination
To determine the intrinsic shape of the DM and stellar particle distributions, we remove any residual net velocity from the system, reject any unbound particles and iterate this procedure to locate the density center (e.g., Aguilar & Merritt 1990),
| (9) |
where is the local mass density at the position of each particle.
In the reference frame defined by the so determined velocity centroid and density center, we compute the eigenvalues of the moment of inertia tensor for the mass within a specified radius. From these we may determine the axes of a uniform spheroid with the same eigenvalues. The ratios of these axes may then be used to characterize the shape of the system, as defined by
| (10) |
| (11) |
where for the eigenvalues .
2.5. Initial Conditions
The initial conditions are those of a spherically-symmetric density enhancement in the Einstein-de Sitter Universe. We use an open CDM (OCDM) model with , , where is the current cosmological density parameter and is the Hubble constant normalized by 100 . Models with and in CDM Universe have been run as well, but will be discussed elsewhere. Because the collapse time of our DM halos happens at (Table 1), the differences between the OCDM and CDM models are insignificant. We have also rerun our standard model N3 with the WMAP3 baryon fraction of 17% (model N41) and (separately) with 5 times larger number of the SPH and collisionless particles (model N42) — the differences with the original model appear to be only quantitative.
| Model | EOS | Notes | ||||||
|---|---|---|---|---|---|---|---|---|
| N 3 | 2 | 0.3 | 10 | 0.5 | 0.015 | 0.015 | standard model: DM halobaryons | |
| QN 3 | 2 | – | – | – | 0.015 | – | as N3 but DM only | |
| N 4 | 2 | 0.3 | 10 | 0.5 | 0.015 | 0.015 | enforced axisymmetric halo | |
| N 5 | 2 | 0.3 | 10 | 0.5 | 0.015 | 0.015 | isothermal | |
| N 6 | 2 | 0.05 | 10 | 0.25 | 0.015 | 0.015 | ||
| N 8 | 2 | 0.1 | 10 | 0.25 | 0.015 | 0.015 | ||
| N 14 | 2 | 0.3 | 1 | 0.5 | 0.015 | 0.015 | ||
| N 15 | 2 | 0.1 | 1 | 0.5 | 0.015 | 0.015 | ||
| N 16 | 2 | 0.1 | 1 | 0.25 | 0.015 | 0.015 | ||
| N 17 | 2 | 0.1 | 10 | 0.5 | 0.015 | 0.015 | ||
| N 18 | 2 | 0.3 | 10 | 0.5 | 0.025 | 0.025 | ||
| N 19 | 2 | 0.1 | 1 | 0.5 | 0.025 | 0.025 | ||
| N 20 | 2 | 0.1 | 1 | 0.5 | 0.015 | 0.025 | as N19, with | |
| N 21 | 2 | 0.1 | 1 | 0.5 | 0.015 | 0.025 | as N19, with dynamic softening | |
| in the gas | ||||||||
| N 22 | 2 | 0.1 | 1 | 0.5 | 0.015 | 0.025 | isothermal | as N21 |
| N 23 | 2 | 0.01 | 1 | 0.5 | 0.015 | 0.025 | as N21, with | |
| N 24 | 2 | 0.01 | 1 | 0.5 | 0.015 | 0.025 | isothermal | as N22, with |
| N 25 | 2 | 0.05 | 1 | 0.5 | 0.015 | 0.025 | as N21, with | |
| N 26 | 2 | 0.05 | 1 | 0.5 | 0.015 | 0.025 | isothermal | as N25 |
| N 27 | 2 | 0.3 | 1 | 0.05 | 0.015 | 0.015 | as N14, with | |
| N 28 | 2 | 0.3 | 10 | 0.5 | 0.015 | 0.050 | as N3 | |
| N 41 | 2 | 0.3 | 10 | 0.5 | 0.015 | 0.015 | as N3, with WMAP3 baryon | |
| fraction | ||||||||
| N 42 | 2 | 0.3 | 10 | 0.5 | 0.015 | 0.015 | as N3, with 5 times more | |
| baryon and DM particles |
Note. — Columns: (1) model (see text); (2) estimated collapse redhift for the DM halo; (3) the fraction of thermalized energy from the stellar feedback; (4) the collapse time for SF clouds in units of the free-fall time; (5) fudge factor for the critical density when triggering the SF; (6) stellar gravitational softening; (7) limiting value of dynamic gravitational softening in the gas; (8) notes
The initial density profile corresponds to the average density around a peak in a Gaussian random density field with power spectrum . The simulations start at to ensure they begin in the linear regime. The particles are initially moving outward with the Hubble flow, with consecutive shells of mass stopping, turning around and falling back inward. The model is parameterized by the filter mass , which defines the mass contained within a sphere of radius (e.g., Thoul & Weinberg 1995).
The parameters and are determined by choosing the collapse redshift at which the shell reaches the center in a non-dissipative collapse and a circular velocity associated with the shell surrounding the characteristic filter mass if virialized at half its turn-around radius. In addition, the model is characterized by the virial coefficient , where is the kinetic energy in random motions and is the potential energy, and a spin parameter , where , , and are respectively the total angular momentum, energy, and mass of the system.
The initial angular velocity is taken as , where is the cylindrical radius and the central kpc has been softened. The angular velocity has been normalized by the requirement that the initial for all models. This distribution of the specific angular momentum complies with the universal profile of angular momentum in DM halos, based on the statistical sample of halos drawn from high-resolution numerical simulations (Bullock et al. 2001; see also Fall & Efstathiou 1980).
For all the models we adopt the values of , and . In addition, we have run models with and 6, but those are not shown here. The initial models consists of collisionless DM particles with the total mass of and of the gas, given by the SPH particles, which have the same radial profiles as the DM. The initial gas comprises 10% of the total mass.
3. Results: Model Evolution
Our results are presented in this and next sections. We describe the evolution starting with QN3, the pure DM model, and continue with models which include all components, as well as the SF and the feedback from stellar evolution — the standard model N3 is followed by models from Table 1. Each subsection emphasizes a different aspect of evolution. We provide a more specific comparison between models, based on parameter variation, in Section 4. Note that the specific times characterizing the model evolution are given for comparison only.
3.1. Pure DM Model
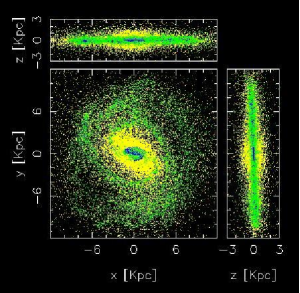
Evolution of pure DM halos within the framework of a monolithic collapse is limited to a virialization and incomplete violent relaxation in the varying background gravitational field. We find that the angular momentum incorporated in the initial conditions is essentially channeled into the internal circulation. In all models, including those with baryons, the halo forms a prolate triaxial figure and its minor axis is directed along the -axis. The halo figure tumbles with a pattern speed of during the collapse period of Gyr and thereafter. This is more than two orders of magnitude lower than the pattern speeds of other prolate figures, i.e., stellar or gaseous bars, forming within the growing disk, even after the bar secular slowdown. Overall the halo figure makes , or less than one full rotation, in a Hubble time. Hence, for all practical reasons, we can consider that the halo figure is static with respect to any developing bars in the system. The initial parameter remains constant for QN3 and shows an increase by for models with gas, over the Hubble time. The DM density profile in QN3 quickly achieves the NFW shape and the characteristic radius is kpc by the end of the run.
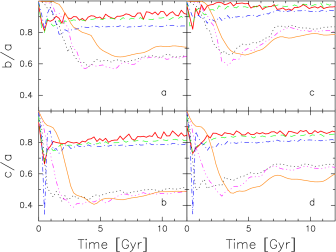
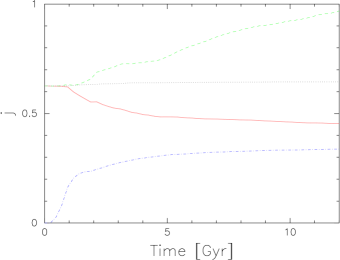
Next, we determine the evolution of the DM halo shape in QN3. The inner 30 kpc halo turns around first and develops a triaxial structure between Gyr. Figs. 1 show the evolution of axial ratios, and , in QN3. Beyond kpc, the DM collapses over Gyr and forms a strongly triaxial figure as well. The initial triaxiality develops in response to a short-lived radial orbit instability (e.g., MacMillan et al. 2006). The DM halo in QN3 exhibits a clear increase in its triaxiality with radius, from the inner, kpc, to the outer, kpc, halo, both in its prolateness and flatness. The former range is , while the latter lies within . Both parameters show a substantial increase into the outer halo.
Roughly speaking, the inner halo is assembled during the first Gyr while the outer one during Gyr. Fig. 2 shows the growth of the halo virial mass, which is computed by requiring that the mean halo density is equal to the critical density of the universe times , where is obtained from the top-hat model (e.g., Romano-Diaz et al. 2006, 2007). The halo virial mass reaches by . The halo growth rate agrees well with the fully cosmological simulations in OCDM universe (e.g., Romano-Diaz et al. 2007). Unlike Samland & Gerhard (2003), we do not assume the law of halo growth and do not limit the shape of the halo to be spherically-symmetric.

3.2. Evolution of the Standard Model and Beyond
Next, we present models that include baryons and their associated processes. The standard model, N3, is treated as a representative one, and is compared to other models. The parameter is growing from 0.05 by in all of these models. We note that the very slow tumbling of the halo figure is not affected by the presence of the baryonic matter — the angular momentum is channeled mainly into the internal circulation.
The overall trend in the evolution of a DM halo remains the same in the presence of baryons (Fig. 1-). but its prolateness and flatness are lessened by compared to that in QN3. This means that the outer halo stays substantially more prolate and flattened than the inner one, as in QN3. The maximal prolateness and flatness of the outer halo are reached earlier in N3 and its subsequent reduction is stronger there over the next 2–3 Gyr. The inner 10 kpc also become more axisymmetric than in QN3. Asymptotically, N3 is substantially less prolate than QN3. The washing out of the prolateness in the inner 20 kpc is clearly connected with the buildup of the disk over the first 2–3 Gyr (as shown already by Berentzen & Shlosman 2006).
Two factors play the major role in removing the prolatenes of the inner halo. First, the baryonic (density) response to the halo (equatorial) prolateness is perpendicular to the halo’s nearly non-rotating major axis. In this case the inner inner Lindblad resonance (inner ILR), if it exists, moves to the center, while the outer ILR to the very large radii, outside the halo, securing this response everywhere within the halo. This baryonic response dilutes the prolate potential of the DM (more about this response in section 3.6). Second, the disk sitting deep inside the DM potential, as well as numerous baryonic clumps forming prior to the disk assembly, scatter the DM particle orbits, further reducing its triaxiality. The gravitational quadrupole of the disk, during its assembly, interacts with that of the prolate halo — this induces a chaotic behavior in the halo and in the disk. The result is a reduced prolateness and flatness in the halo and a more axisymmetric disk.
For the stellar component, the inner kpc of N3 show a mild prolateness asymptotically, with the axial ratio of at kpc due to a mild bar. The ability of the DM to maintain the non-negligible prolateness affects both the dynamical evolution of the galactic disk and facilitates the angular momentum redistribution in the disk-halo system, as we discuss in section 3.8.
Because dissipative processes dominate the formation of a stellar disk, it is dramatically flatter than the DM. For N3 and other models with baryons discussed here, the disk formation and evolution can be divided roughly into two stages: gas-dominated and star-dominated. The former stage lasts over the first 2–3 Gyr — we observe that the gas dominates over the stars even in the central regions of the disk. The latter stage lasts over the rest of the simulation time, during which the ratio of baryonic-to-DM matter within the central 10 kpc reaches and subsequently rises to . The inner few kpc, however, are baryon dominated. The gas rotation curve flattens at about 290 . The vertical thickness of the gas layer is large over the first 5 Gyrs and then is gradually reduced.
The initially gas-dominated disks are not axisymmetric, and exhibit a range of morphologies: the and modes dominate them at various times, and occasionally they are affected by the off-center, mode. With time, the disks become more axisymmetric, but some stay oval for a long period of time.
Even towards the end of the simulation in N3, only a fraction of baryons resides within the central 10 kpc (where most of the disk lies): in stars and in gas. The total mass of baryons within this radius is , or 49% of the baryons in the simulation. A similar baryon fraction, , is characteristic for all models. Between a third and a half of all baryons reside outside the SF region in the disk plane (beyond 15 kpc) and in the DM halo, i.e., in the form of partially rotationally-supported and/or hot gas. The rest of the gas is shock-heated to virial temperatures of K, and ionized.
The DM density profile for N3 can be fitted by the NFW law although the quality of the fit is lower than that of QN3, and the final value of is kpc. The inner few kpc and the DM cusp are dominated by the baryons at the end of all the runs with the gas.
3.3. Early Baryon Inflow and the Disk Formation:
the Cat’s Cradle
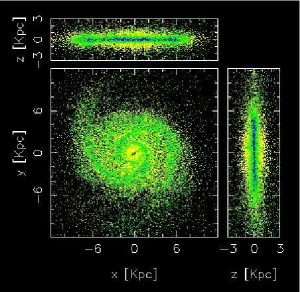
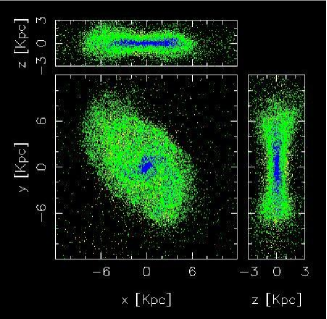
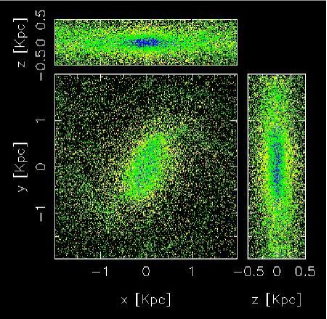
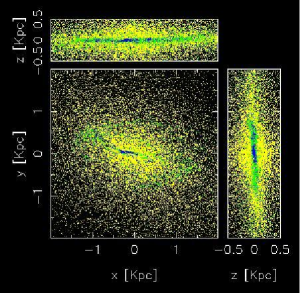
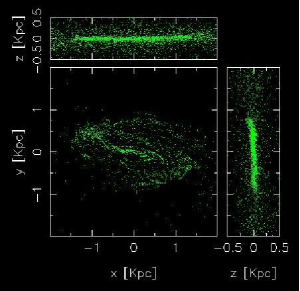
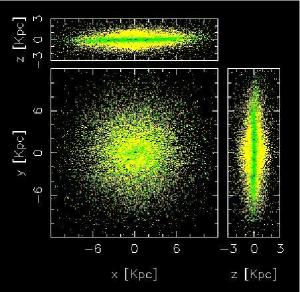
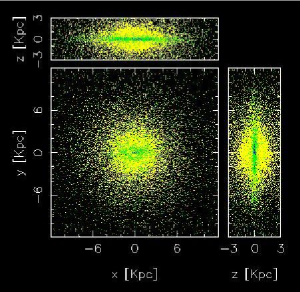
Early baryon inflow towards the center leads to the formation of a specific configuration near or at the DM density peak that resembles the “cat’s cradle” pulled by a number of nearly radial ‘strings’ (filaments). This is observed in all the models, except in N4 which has an enforced axisymmetric halo. The source of this morphology is the background DM distribution within the inner kpc halo during the initial Gyr (Fig. 3, left). The baryonic strings have one-to-one correspondence with the DM strings. Furthermore, the face-on disks show such strings attached to their edge, where the main baryonic inflow joins the disk. The strings are not perfectly radial, and at the disk edge are tangent to it — the cold gas inflow, therefore, joins the disk without being shocked, thus supplying a cold, unvirialized gas to the disk. The typical symmetry resembles the irregular polygons, and ranges from triangles to octagons (e.g., Fig. 3, right). The central object — an amorphous clumpy protodisk, has a typical size of 2–4 kpc and the radial strings attached. The protodisk has an elongated shape and its figure initially nearly stagnates. The baryonic blobs tend to form on these strings in the equatorial plane and fall along them onto the disk, visibly speeding up its figure rotation. The feeding of the disk along the strings continues for some time during the first Gyr. Models N23–N26 with a small SF feedback, , exhibit larger clumps. The early disk appears as a fat configuration with an equatorial SF and with flaring edges. By about Gyr, the disk grows substantially, its shape changes rapidly between a less and a more prolate one, and with more or less prominent spiral structure. Dynamical friction appears to play a major role following the clump joining the disk — similar to the behavior of the gas-rich disks analyzed by Shlosman & Noguchi (1993).
3.4. Later Stage: Baryon Mass Inflow History and the Disk Growth
With the beginning of the collapse, the rate of baryonic inflow into the inner 20 kpc reaches its maximal rate within the first 1.5 Gyr and then steadily falls off. The SF rate shows a similar behavior (except in N27), with a peak at 1.5–1.8 Gyr of for the N3 disk (Fig. 4). Overall, the range of the SF rates is , and the peak SF rate can be delayed by 1–2 Gyr compared to the standard model. N27 differs and shows a flat SF rate for the first 6—7 Gyr.
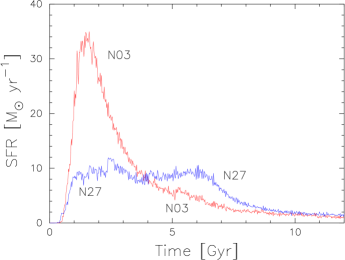


The SF rates decay exponentially, in nearly all models (except N27), to , at Gyr, and after Gyr. The latter rate is typically observed in the normal disk galaxies of the nearby Universe.
In all models, the proto-disk plane has been established and visible already at Gyr, across the inner 12 kpc, while the stars exist only at the very center by that time. Thereafter, a small kpc gas disk becomes prominent and doubles in size to 5 kpc in another 0.5 Gyr, with the SF at its midplane. After Gyr, a gaseous bar of kpc forms, supplemented by an ongoing SF, but collapses to the center and is damped shortly (more about these bars in sections 3.5–3.7). By Gyr the disks grow almost to 10 kpc with an intense SF — the gas component remains puffed up significantly.
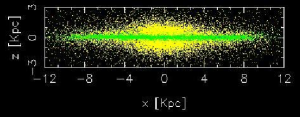
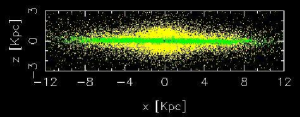
By Gyr, the gas layer starts to cool down. The transient spiral structure becomes visible and is delineated by the SF regions. By Gyr, the vertical structure of the stellar disks in most of the models, but not in all, looks alike. We observe that the disk cools down and thins substantially when the SF rate drops below — this is true for all the models, and typically happens after about 5 Gyr.
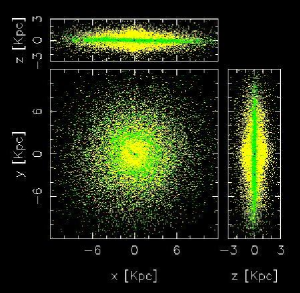
All the disks, except that of N27, appear to form from inside out, and are gas-dominated initially. The typical time for the disk buildup, i.e., when it reached about 50% of its final mass at , is Gyr. The stellar rotation curve gradually extends to larger radii and steadily rises with time, while remaining flat in . Its peak moves in to smaller radii, then recedes somewhat (Fig. 5). (See also the comment on the bar pattern speeds evolution, reflecting the growing mass concentration in the disk, in section 3.6.). The gaseous component, in the inner few kpc, forms a high surface density ‘thin’ disk embedded in the thicker ‘corona.’ This corona extends to larger radii. The extent of the stellar disk is limited to the narrow gas disk only. While the relative details of this disk-corona morphology differ from model to model, the overall structure is robust. Models N19 to N26, all show larger disks, some with a strikingly visible bulge accompanied by SF activity in the nuclear rings.
The central kpc of an assembling galaxy in N3 is dominated by the DM during the first Gyr, and subsequently by the gas (for a short period of time) — then by the newly formed stars. The baryon/DM ratio tends to 0.8 within the disk radius at the end of the simulation. This value, however, is hardly a standard. It is affected by the feedback from the stellar evolution, by the critical density for SF and by the collapse time of unstable SF clouds.
3.5. Early Nuclear Bars


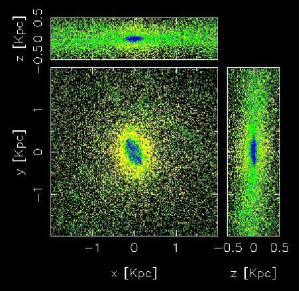
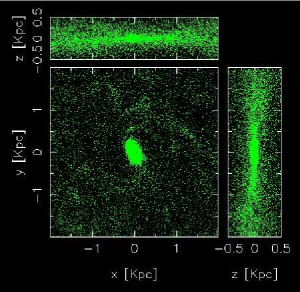
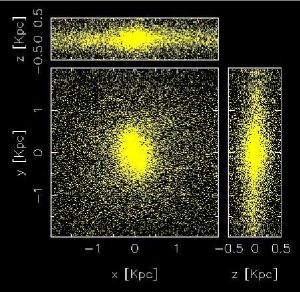
Early gas-dominated (or gas-rich) nuclear bars appear as a common feature after about 1 Gyr in all of the models, albeit their longevity differs from model to model (typically 4–5 Gyr), e.g., N3 in Figs. 6–7. Their strength, measured by their axial ratio or by the amplitude of their mode, changes with time, and they become more star-dominated as the gas is channeled inward and progressively concentrates in the central pc. The (radial) sizes of these nuclear bars change with time as well, from few 100 pc to about 2 kpc. The central SF is clearly concentrated in these bars. The stellar bulges are observed to dominate these bars after 2.5–3 Gyr in some models. The vertical extent of the gas layers within the bulges appears to be similar to elsewhere in the disk. We note that nuclear gas bars, devoid of the stellar component, are observed in the central kpc of our models as well. These frequent gaseous nuclear bars survive for a limited time, depending on the gravitational coupling from the background potential, and collapse to the center.
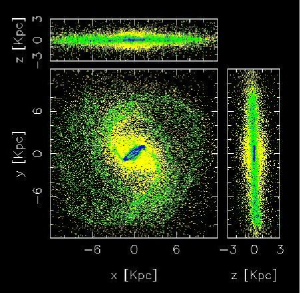
Nuclear rings appear prominently around the nuclear bars from time to time. They seem to be connected to the large-scale disk by pair of gas spiral arms which are also visible in the SF (the outer disks are visibly oval), e.g., N19 in Fig. 8. These rings become more prominent when the gas in the oval disk is channeled to the central kpc. The gas nuclear bars, seen to develop inside the ring, shrink catastrophically and speed up, until the gas is dumped at the very center — leaving a profound central hole in the cold gas distribution.
3.6. Large-Scale Stellar Bars
Large-scale bars, kpc, have always developed very early, by Gyr, e.g., in N5 — in all cases they have decayed in a few Gyr. In addition, bars have formed late in the evolution, after 5 Gyr, e.g., in N16 (Fig. 9), in about 2/3 of the models. The early bars appear in response to the prolateness in the DM halo (and of the stellar disk consequently) — they do not develop as a result of a classical bar instability. These bars are moderately strong, with , and seem to involve a large fraction of the stellar disk mass. Their shapes as well as the shapes of the outer disks depend on the mutual orientation between the DM halo, disk and bar major axes. We use the mode amplitude, , to quantify the strength of this mode in the disk and the bar, as a function of their P.A. with the halo. Applying this procedure to N3, during the first Gyr, shows that the disk integrated between 8 kpc – 12 kpc displays its minima/maxima when the disk is oriented at to the halo, i.e., when it leads/trails the DM halo major axis. During the second Gyr, the has maxima when the disk is oriented at to the halo in about 1/3 of the rotations. In other cases, the appear to ‘librate’ around P.A.. As the disk becomes less oval due to its interaction with the halo and the bar, the residual always librates around P.A..
The same analysis repeated for the bar in N3 shows that early in the evolution, the bar ‘stagnates’ at P.A. to the halo. At later times, the bar sometimes appears stronger at this angle. But in most cases, , appears irregular as a function of P.A. Hence the bar, as the least massive object in comparison with the disk and the halo, shows a much less regular behavior of its .
We also find that stellar bars forming late in the simulation are shorter, than the early bars, e.g., in N16, where the bar starts to grow anew after Gyr and continues its slow growth until the end of the simulations. In addition, early bars, large-scale and nuclear, are visibly dominated by the SF and are gas-rich. While their late large-scale counterparts appear to be gas-poor.
Fig. 6 exhibits the evolution of the bar pattern speed in N3. Due to the disk growth from inside-out, it shows rather an unusual behavior — it appears at a fixed, , angle to the halo and remains in this position for a large fraction of a Gyr. Then the bar speeds up sharply, till Gyr. By that time the central bar-hosting regions in the disk are mostly built and further addition of the mass to the disk happens well outside.
3.7. Nested Bars and Spirals
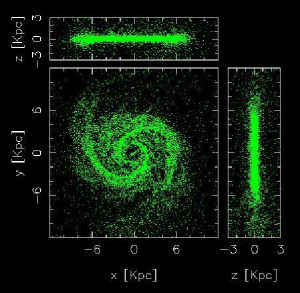
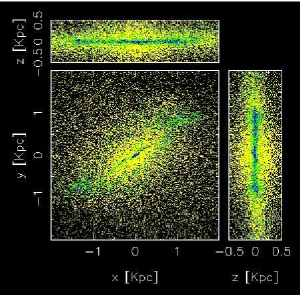
In the models presented here, the growing stellar disks preserve their strong ellipticity (prolateness) over the first 1–2 Gyr. Strong nuclear gaseous bars form and experience a distributed SF over their surface. In some models, these bars appear tumbling much faster than the (oval) disk figure. A pair of grand-design spiral arms extend from the surrounding nuclear rings outward, across much of the stellar disks. After few rotations, the nuclear gas bar collapses to the center (e.g., N18 and N26 models in Figs. 10, 11).
These phenomena become progressively more pronounced along the sequence N16N22, excluding N17 and N20. N23–N25 are more clumpy initially (corresponding to Shlosman & Noguchi [1993] scenario with clumps spiraling in because of a dynamical friction) and with no pronounced nuclear morphology later. The appearance of these clumps can be clearly correlated with a sharp decrease in the thermalization of stellar feedback energy, down to .
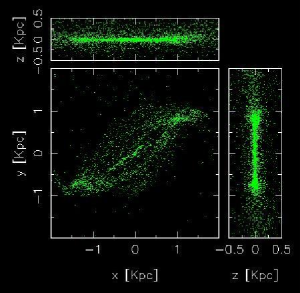
Model N26 represents one of the clearest cases of nested bars having different pattern speeds (Fig. 11). The nuclear bar appears first within the central kpc at around 1 Gyr as a result of the gas inflow from larger scales, where and are clearly visible and constantly evolve. This nuclear bar can be observed both in gas (and the associated SF) and in stars. At Gyr, the nuclear gaseous ring appears with an associated SF and is connected to the outer disk by a pair of grand-design spiral arms. At this time, the nuclear bar seems to have a different pattern speed from these arms and tumbles faster. After Gyr, a large-scale stellar bar becomes visible within the central 5 kpc. The shape and the existence of the nuclear ring depends on the mutual alignment of the nested bars (Shlosman & Heller 2002). The ring is also visible in the edge-on disk as being dense and much thinner than the gas layer within the central kpc. we also confirm that the strength of the small bar depends on the mutual orientation of the bars — it is stronger when the bars are aligned and weaker when they are normal to each other (Heller, Shlosman & Englmaier 2001; Shlosman & Heller 2002; Englmaier & Shlosman 2004; Debattista & Shen 2006).
We note that the nuclear bars are gas-rich in the beginning of this process and form stars vigorously. Gradually the gas in the bar is dumped on the center, and the bar dissolves after Gyr. The pattern speeds of the nuclear bars in all models increase over the first Gyr and decline thereafter. The stellar bar dissolves by Gyr. Nuclear ring survives and becomes amorphous. A specific case of evolution of nested bars has been analyzed by Heller et al. (2007).
3.8. Angular Momentum Redistribution
The pure DM models conserve the total angular momentum with the precision of 0.1%. In models with baryons, is not conserved apriori because of the processes associated with the SF and feedback. Energy input from stars leads to pressure gradients, i.e., hydrodynamical torques, etc. We find that of all particles in models with SF is nevertheless a well preserved quantity — across the models it increases by a small . These processes, therefore, appear much less important than the gravitational torques for the balance.
For baryons, decreases by about over the Hubble time, while for the DM matter increases by about . Most of this decrease happens during the first 3–5 Gyr. For stars, saturates after Gyr, while in the gas continues to decrease — by the end of the simulations about of baryonic is in the gas, depending on the model. Note that this involves the gas at large radii as well, in the regions devoid of stars. This explains the large contribution to by the gas compared to its overall low mass fraction at the end.
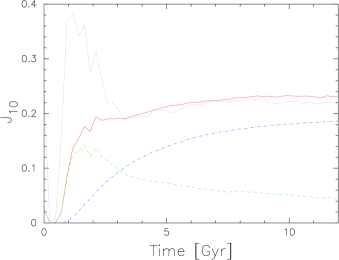
Of a special interest is the balance of within the central 10 kpc, , where most of the baryonic disk resides. This angular momentum behaves in the following way (e.g., Fig. 12 for N3). The peak of in the DM is achieved at Gyr with the follow up sharp decrease by a factor of 2–2.5. The central 10 kpc remains dominated by contributed by the DM for the first Gyr. The rise in the baryonic is much slower (than for the DM) within this region and it reaches the maximum only at Gyr, in some models declining about 25% thereafter. The peak of for the DM has a similar value, within a factor , to that of the baryons within 10 kpc (e.g., Fig. 12). Even more interesting is the close similarity between the values of for the baryons and DM after the first ‘splash’ over most of the evolution time — this ‘equipartition’ of tells that the angular momentum transfer from the disk to the halo is very efficient and saturates when both components have equal . This behavior is observed for all models.
Stellar mimics that of the baryons in total, being about 25% lower at all times. For the gaseous component, reaches its maximum between 1.5–3 Gyr, within a subsequent sharp decline (by a factor of 2) and a slow decline thereafter. The gas is always much smaller than in the DM (by a factor of 2). The evolution of gas mimics (somewhat) that of the DM overall.
The specific angular momentum of the gas is defined as , and similarly for stars and the DM. In models with baryons we find that increases by about over the Hubble time, most of this increase is dated by . The baryons lose about of , mainly during the epoch . However, of the gas and stellar particles separately increases (nearly) always monotonically. Initially, stars form at the very center with the minimal , then the SF propagates outward consuming the gas with higher . Again, the specific angular momentum of the gas increases with time in all models because the SF first consumes particles with lowest . Typically, the stellar saturates its growth after few Gyr, while the gas continues to increase its . Note, that the number of gas particles is not decreasing initially, but their mass is — the algorithm is using the option of producing generations of stars from the same gas particles before removing the gas from the balance sheet (e.g., Fig. 13).
4. Results: Comparison of Model Evolution
Here we describe the model evolution based on the variation of specific parameters related to the SF processes and to the feedback from stellar evolution.
4.1. Varying the Equation of State: Isothermal Models
The isothermal EOS has been used in N5 and in N22, N24 and N26. Compared to N3, all the isothermal models develop stronger large-scale ( kpc size) bars and stronger nuclear bars. The large bars drive much more pronounced outer spiral arms, both in stars and in gas, and accumulate increasingly clumpy gas, especially during the first Gyr. (This is also true when comparing models with and without isothermal EOS: N22 with N21, and N24 with N23.) These large bars shrink radially (arms persist in the gas) to within the central kpc and largely dissolve due to the quadrupole interaction with the halos, and to a lesser degree due to the heating by a dynamical friction from the numerous clumps, just to develop sometime later on. Compared to N3, N21 and N23, the bars in the isothermal models show a higher rate of SF. The nuclear bars persist for a few Gyrs, leaving an oval distortion thereafter. Similarly to the large-scale bars, nuclear bars are ‘resurrected’ from time to time.
In all of the above models a central opening of about 1 kpc in the gas appears, surrounded by a ring, by Gyr. Gaseous bars driving two gaseous spirals develop within this hole, from time to time, and exhibit a faster pattern speed than the surrounding flocculent spiral structure. By Gyr, the hole grows to about 2–3 kpc in radius and more prominent in the models with the isothermal EOS. The comparison of pattern speeds shows a diverging evolution for the gas inside 1 kpc and 5 kpc, e.g., late (after 9 Gyr) speedup of the gaseous component in N26, or a late gaseous bar in N22.
Overall, the isothermal models show morphological features that are sharper, including nuclear rings and bars, and their SF rates exceed that of the non-isothermal. The spiral arms outside the nuclear rings have a grand-design appearance. During the maxima of the SF, the gas disk is more puffed up. The edge-on gas disks exhibit a characteristic concave shape during the first 3 Gyrs, and the SF is more pronounced in the mid-plane. In comparison, the N3 gas disk is more convex. The outer massive spirals in the isothermal models appear to be responsible for these differences, which disappers by Gyr. The bulges in the isothermal models extends vertically beyond the disk after Gyr, and, by the end of the simulations, are somewhat more pronounced. The disks in non-isothermal models are smaller, e.g., in N3 by about 20%, both in stars and gas. Typically, much more gas remains outside the N3 disk, both in the mid-plane and above the disk. The disk shapes differ dramatically during the evolution between non-isothermal and isothermal models and the morphology of spiral arms looks different as well.
4.2. Varying Feedback From Stellar Evolution,
In order to investigate the effect of a stellar feedback onto the gas, we have varied from 0.3 in N3, to 0.1 in N17. Additional relevant sequences in Table 1 are the ‘doublets’ N8 () N6 (0.05), N14 (0.3) N15 (0.1), and the isothermal N22 (0.1) N24 (0.01), and the ‘triplet’ N21 (0.1) N25 (0.05) N23 (0.01). This parameter has a major impact on the evolving morphology in our models. The SF starts earlier and tends to be more patchy, underlining the clumpy character of the gas, when is smaller. The clumps spiral in toward the center because of the dynamical friction, especially around Gyr. Models with a smaller feedback also show a more prominent morphological features, like bars, nuclear rings and spiral arms.
In the first doublet sequence, the N17 evolution is similar to that in N3, except the SF extends to larger radii. The N3 disk is the smallest among the models listed above and the N23 disk is the largest. In the early stages, the central gas concentration and its central surface density are observed to increase with decreasing . The gas layer thins along the same sequence.

The stellar bulges form somewhat earlier in models with lower , in N23 by Gyr, in N25 by Gyr, and in N21 by Gyr. Bulges in N17 and N3 form by Gyr. By the end of the simulations, the largest bulge is found in models with the smallest , among the triplet and doublet parameter sequences given above, i.e., in N23 (Fig. 14) and N24. The smallest bulges are found in N3, N22. Such a bulge is also expected in N21. However, as can be seen in Fig. 14, the bulge of N25 is smaller than that of N21. The reason for this behavior lies in that N21 develops a strong late bar, while N25 exhibits only an oval distortion after the first 5 Gyr. N23 lacks a late bar totally. Stellar bars are known to heat up the central disk regions and inflate them vertically by increasing their velocity dispersions, both dynamically and secularly (e.g., Athanassoula & Misiriotis 2002; Berentzen et al. 2007). Additional heating exerted by the bar in N21 contributes to the appearance of a more prominent bulge there.
We infer that two processes, at least, emerge as being responsible for the bulge and stellar bar evolution in our simulations — both of these processes are ‘guided’ by , the stellar evolution feedback onto the gas. We observe that a decrease in alleviates the clumpiness in the gas, which in turn heats up the stellar component in the disk, therefore, delaying or damping the bar instability there. This explains why N21 bulge does not ‘fit’ in the sequence shown in Fig. 14. We conclude, therefore, that by the end of the simulations there is a clear anti-correlation between the bulge prominence and .
4.3. Varying Critical Density for Star Formation,
We look for the effect of the critical gas density for the SF by comparing N14 () with N27 (0.05), and N15 (0.5) with N16 (0.25). The main difference observed along this sequence is the delayed evolution in N27, where kpc bar develops much later compared to N3 and N14, after Gyr only. It can be also seen in the SF colors. The dominant SF in the central kpc of this model also appears very late, after Gyr, and spreads out in and in (low surface and volume densities in the gas). It picks up, however, after Gyr, and remains much higher than in other models. The stellar disk is clearly much hotter and puffy in N27. The bulge develops late but becomes more pronounced than in N14.
On the other hand, using a low value in N27 produces the smallest kpc disk with a very high surface density, enveloped in a low density stellar and gas material (Fig. 15). The SF is concentrated in the disk mid-plane. A bar-like stellar and gas response to the halo prolateness is evident initially within the central kpc, but decays after 3 Gyr. This response forms at a fixed, nearly normal angle with the DM major axis.
Hence, using a low density threshold for SF, in the presence of a substantial feedback, heats up the stellar and gas components in the growing disk. N27 is probably the only model where the SF is distributed and is triggered at all radii kpc in the disk — this disk does not appear to grow from inside out. It produces a substantial bulge but the smallest stellar disk.
4.4. Varying Timescale for Star Formation,
A number of models have a much shorter timescale for SF, instead of 10 (see Table 1) — we compare N3 () with N14 , N8 (10) with N16 (1), and N17 (10) with N15 (1).
Early enough, by Gyr, the SF in N14 is less concentrated toward the midplane and the stellar and gas disks are visibly thicker than in N3. The SF is also more profound in the N14 bars. The gas surrounding the disk in N14 is more noticeable, to the extent that the gas disk flares beyond 5 kpc. By Gyr, a 3 kpc disk of higher surface density emerges in N14 — while the vertical thickness of the disk is now comparable to N3, the radial size of N14 disk is smaller. By Gyr the bulge of N3 seems more pronounced, while toward the end the N14 bar is more gas-rich than in N3.
N15 shows earlier and higher rate of SF and has an initial stellar, gas (and SF) bar. This bar weakens and strengthens occasionally but after Gyr grows monotonically. For a comparison, N16 develops such a large-scale bar by 7 Gyr. The disk in N15 is more puffed up than in N17 and the grand-design spiral arms are much less visible. Grand-design spiral structure is strong between Gyr — apparently when the bar/disk are aligned at certain angles to the DM halo major axis. The SF, which delineates the arms, follows them, while it is more diffuse in N17. The disk is thick and concave at this time, much more than in N17. Compact gas clumps are present thereafter. By 3.5 Gyr, the SF in N15 has subsided more than in N17, the disk seems to be somewhat smaller and the bulge is more compact as well. It also has less gas in the central kpc. The gas layer starts to thin first in this model compared to N17. Towards the end of the simulations it is clear that the disk in N15 is overall thicker, and the bulge is standing out with respect to the face-on disk more than in N17. This bulge has an oval/barlike shape.
Overall, models with smaller form somewhat smaller in size but more puffed up stellar disks.
4.5. Standard Model with an Imposed Axisymmetric Halo
To enforce the halo axial symmetry during a continuous infall of material, we have randomized the azimuths of 5% DM particles, every timestep. Therefore, no initial bars are either triggered or driven by the halo prolateness. Furthermore, this should lower the ability of the halo particles to be in resonance with the nonaxisymmetric features in the disk. This, in turn, should decrease the efficiency of angular momentum flow from the disk to the halo and change the stellar bar evolution.
Indeed, in model N4, the initial collapse proceeds without the ‘Cat’s Cradle’ phase and no DM filaments are present. Consequently, the gas does not form the massive clumps. The disk remains nearly axisymmetric at all times and no substantial spiral structure is visible in the outer part, unlike in in all other models. Some stronger oval distortion develops inside 1–2 kpc after Gyr for some time and decays thereafter. The gas bars are visible from time to time in this region. This evolution is in a sharp contrast with N3 which displays an early and late bar activity on various spatial scales. The SF and spiral morphology in N4 also differ substantialy.
4.6. Varying Gravitational Softening,

Models N18 and N19 have larger gravitational softening in gas and in stars — pc instead of 150 pc in other models. We first compare N18 with N3. The general evolution of N3 and N18 is similar but it differs in some details. First, the former model shows sharper features (shocks, spiral arms, SF regions). Second, the gas there is somewhat more clumpy and is able to concentrate more towards the center and the disk mid-plane. Already during the first Gyr, N3 gas shows a larger surface density in the central kpc. Third, the bars that form in this model are less strong than in N18 (Figs. 6, 16). While the N3 nuclear bar is gas poor (efficiently channeling it to the center), the N18 bar remains gas-rich for a few Gyrs. Two factors may reduce the bar strength here: larger gas and stellar concentration to the center and more clumpy gas that scatters bar stars. This latter feature can also prevent the bar orbits to lock in the resonance with the DM halo orbits, thus resulting in a weaker bar. Finally, the stellar bulge in N3 is less prominent than in N18 but is more centrally concentrated.
Next, we compare N21 with N19. The stellar softening is the same but the gas softening is 150 pc in N21 instead of 250 pc in N19. As in the previous pair, the morphological features are more detailed in N21. This is noticeable in the distribution of SF and gas in the strong spiral arms — both are more clumpy, but not in stars. As before, N21 develops a more massive gas concentration in the center, but the difference between the models is not as obvious, apparently because the stellar components have identical softening. The nuclear rings appear (vertically) thinner in N21 and are much more long-lived. Occasionally, they collapse to the center. In the long run, the difference emerges also in the stellar distribution as well — the bulge is visibly larger in N19 and less centrally concentrated. The bars in N19 are also more gas rich, but periodically this property is inverted between the models. On the other hand, the bars in N19 appear stronger. Hence, the gravitational softening emerges as an important parameter which drives the evolution in our models. Especially in gas, this parameter reflects the overall smoothness of the gas and can be related to a number of intrinsic processes in the ISM, heating/cooling and the topology of the magnetic fields — those affect the gas clumpiness.
5. Discussion and Conclusions
We have simulated the formation of a two-component galactic disk within an assembling DM halo, including the accompanying SF and the stellar feedback onto the ISM. For this purpose, we have followed the collapse of an isolated cosmological density perturbation with the spin parameter , from its linear regime at and up to . Our approach has several advantages. We have improved the SF criterion, accounting not only for the contraction and the critical density of the SF region, but also for the background density. Each gaseous particle can make up to four generations of stars, with different metallicities, while an additional parameter allows to consider a delayed collapse of the molecular clouds due to MHD turbulence. We consider the energy feedback both from stellar winds and from SN, and we are particularly careful in the way this energy is deposited in the gas.
We have employed a reasonably high number of particles, allowing us to resolve a number of important features. In particular, our simulations are fully self-consistent, in order to avoid artifacts that could be introduced, e.g., by a rigid halo (e.g., Athanassoula 2002). This enabled us to study interesting dynamics linked to the halo shape. We have voluntarily refrained from using a yet higher number of particles, in order to be able to run a large number of simulations, much more than is usual in similar studies. With our models, we tried to gain insight on how the various parameters, and particularly the SF and the energy feedback, affect the structural properties of the bulge, the disk and its components, like bars and spirals. Of course, the available parameter space is very large and much further work and many more simulations are necessary before any thorough understanding is reached. Yet, even with the number of simulations we have at our disposal, several clear trends emerge.
In all models the disk forms over a period of time of Gyr, i.e., it reaches 50% of its final mass over this time, although its equatorial plane is established very early. The DM halo develops a characteristic triaxial shape, i.e., prolate in the plane perpendicular to the original angular momentum, and flattened along the rotation axis. For pure DM models, the axial ratios of the inner ( kpc) halos lie between and , and of the outer ( kpc) halos between and . At the same time, we find that the halo figure tumbles very slowly, over the Hubble time. The DM collapse pumps most of the angular momentum into the internal circulation within the halo, while the baryonic collapse is stopped by the centrifugal barrier in a flat disk. Thus the baryons, due to dissipation, collapse much more profoundly.
The halo triaxiality decreases with time during the disk growth. Two processes contribute to this — (1) the increasing central mass concentration in the model and the appearance of of numerous scattering centers (blobs) in the halo, and (2) the out-of phase response of the baryons in the disk to the halo shape. The first effect reduces somewhat both the flatness and prolateness of the halo, even in the absence of a baryonic component, much more so in the presence of baryons. The second effect results from the negligible tumbling of the halo figure — under these circumstances the inner ILR (if it exists) and the outer ILR are pushed to the center and to large radii, respectively, and the disk acquires an elongation perpendicular to the major axis of the halo, thus diluting its potential in the equatorial plane. This effect is model independent and is unrelated to dissipation.
The angular momentum () flow within the evolving models has been always directed outwards — the inner disk is losing to the outer disk and to the surrounding DM halo. Overall, the baryons lose their while the DM increases it in the process of evolution. On the average, the DM halo acquires about 2.5%–3% of while the baryons lose about 25%–30% of their original momentum. The total is conserved to less than 0.5% even in the models with SF. The specific angular momentum () behaves in a more complicated manner — for the DM it is almost constant over the Hubble time. For baryons, decreases with time but each of the components separately, the gas and stars, increase their substantially over the time. This happens because the first stars form in the center with a minimal , and the first gas consumed by the SF has small as well.
The disk evolution can be roughly divided into two stages: in the early stage, the baryons flow towards the forming small and amorphous disk along a number of radial string patterns — this characteristic configuration forms in all models and resembles the Cat’s Cradle. It survives for about 1 Gyr. In the second stage, the disk periodically changes its shape from less to more oval and frequently develops a pair of grand-design spiral arms. The disk shape and the strength of these arms depends on their relative angle with the major axis of the DM halo. In nearly all models, the disk grows from inside out and is gas-dominated initially. About 1/3 to 1/2 of the original baryons remains outside the SF region of the disk or in the halo in form of hot gas at the end of the simulation (see also Sommer-Larsen 2006).
The star formation (SF) is typically strongly concentrated toward the disk midplane. The gaseous component in the disk is puffed up by the feedback from the stellar evolution. We find that the gas layer narrows substantially when the SF rate there drops below — which typically happens after the first 5 Gyr. The SF delineates various morphological features — like early bars, spiral arms and nuclear rings. Late bars appear gas-poor and do not show much SF.
We find that parameters which characterize the disk morphology fit the observations of galactic disks in the nearby universe, e.g., their radial and vertical scalelengths, shape parameters, bulge-to-disk ratios, etc. The typical radial scalelength in the disk increases by a factor of 2 over the Hubble time, ending within the range of kpc. During this time the disk grows by more than a factor of 10 in mass.
A caution should be taken when tackling the evolution of a collisionless component (stars) within the central few 100 pc, specifically the formation of bulges in disk galaxies. Insufficient timestep resolution can lead to being unable to resolve the orbits of individual stars — this leads to energy non-conservation and overall heating in the region. Such heating has been detected in the central few 100 pc of our models. It did not affect the large-scale evolution but could, in principle, modify the nuclear bar strength as well as increase the dispersion velocities in the disky component of the bulge. We, therefore, postpone the discussion of the bulge formation, the bulge-disk decomposition and the evolution of characteristic scalelengths in our models to a separate publication where high-resolution timestep models are presented.
Essentially, the disks obtained in our simulations range from being bulge-dominated to nearly bulgeless. Models with larger feedback from the stellar evolution form smaller bulges and vice versa. Models with shorter timescale for SF formed ‘fatter’ disks but not necessary more massive bulges. Moreover, reducing the critical density for SF has led to a distributed SF activity over the inner 15 kpc, as opposed to the inside out disk growth in other models, and to ‘fat’ short (small radial scalelength) disks.
All models are characterized by an extensive bar-forming activity within the central few kpc. This is especially true for the initial few Gyr of the disk formation. The early bar axial ratios vary in tandem with the mutual bar-halo orientation. These bars appear to be gas-rich, channel their gas contents towards the central kpc and weaken substantially over this time. In some cases their strength was observed to revive, even after a prolonged period of time. In other cases, small nuclear bars developed in addition to the primary bars. Dynamically, we find that these nuclear bars either corotate or tumble differently than the large bars. In all the latter cases, we find that this was preceded by a gas inflow to the region and that nuclear bars tumble substantially faster than their large-scale counterparts. Some of the nuclear bars appear not to have visible stellar components — they quickly collapse to the center. Nuclear rings and spirals appear frequently over the Hubble time and the former ones are robust features in the disk.
Some models show large inflow rates of the gas into the central few kpc leading to the Jeans instability in the gas and the formation of massive clumps. These clumps experience dynamical friction within the disk and spiral in before being consumed by the SF process. Such a regime has been investigated by Shlosman & Noguchi (1993) who found that the bar growth is suppressed due to the disk being heated by the clumps (see also Immeli et al. 2004). Here we confirm that indeed the bars have been substantially weakened by these clumps, or did not form in the extreme cases.
Our main results indicate that it is possible to form disks which are in agreement with those in the local universe, e.g., with observed sizes, scalelengths, shapes, mass distributions, etc. Furthermore, we obtain rotation curves that are flat and with the disk/halo contributions as observed (e.g., Bosma, 2004). The so-called angular momentum ‘catastrophe’ discussed in section 1 is naturally avoided in this approach. The baryons lose only about 25% of their angular momentum because both the original present and the feedback from the stellar evolution reduce their accretion rate onto the disk where most of the is lost. We find that in all models the total angular momentum of baryons (starsgas) within the disk region closely follows that of the DM there. After the initial Gyr, the baryons rapidly lose their that flows to the DM until ‘equipartition.’
Moreover, a full range of bulge-dominated to nearly bulgeless disks have been obtained as a result of the evolution over the Hubble time. The disks formed in our numerical simulations do not appear to suffer from being too compact and having small radial or large vertical scalelengths. The growth of the disk cannot be modeled realiably without resolving its radial scalelength — an issue which is difficult to address at present in cosmological simulations and which is resolved in our approach. The problem of over-cooling — when the gas radiates away the energy deposited by feedback from the stellar evolution (OB stellar radiation-driven winds and SN), is also addressed here (see section 2).
Bars provide the strongest impetus for an internal evolution in disk galaxies by imposing gravitational torques which trigger the mass and angular momentum redistributions within the central kpc. While prolate DM halos appear to be incompatible with large-scale stellar bars (El-Zant & Shlosman 2002; Berentzen et al. 2006), the growth of disks acts to wash out the equatorial prolateness within, at least, the inner halos (Berentzen & Shlosman 2006). The present work confirms this trend — we observe a decrease in the halo flatness even well outside the disk, and elimination of its prolateness within the inner ( kpc) halo and reduction in the outer halo. The disk shape and morphology are affected by the halo shape during the first few Gyr — the disks appear oval in contradiction of those observed in the local universe (e.g., Rix & Zaritsky 1995). The interaction between the ovally-shaped disks and prolate halos provide for the spiral driving which clearly depends on the mutual disk-halo orientations.
In summary, we have explored different aspects of disk galaxy formation in the framework of the collapse of an isolated density pertubation embedded in the Hubble flow. This allows us to focus on specific processes normally unresolved in the cosmological simulations. On the other hand, we lose the effect of the substructure on the model. Specifically, we have aimed at understanding the imprint of various feedback parameters describing the star formation on the basic charateristics of the disk-halo system. One should consider this effort as an exploratory one, which requires a full implementation of realitic initial conditions in tandem with a higher numerical resolution.
References
- (1) Abraham, R.G., Merrifield, M.R., Ellis, R.S., Tanvir, N.R., Brinchmann, J. 1999, MNRAS, 308, 569
- Aguilar & Merritt (1990) Aguilar, L.A., Merritt, D. 1990, ApJ, 354, 33
- (3) Allgood, B., Flores, R.A., Primack, J.R., Kravtsov, A.V., Wechsler, R.H., Faltenbacher, A., Bullock, J.S. 2006, MNRAS, 367, 1781
- (4) Athanassoula, E. 2002, ApJ, 569, L83
- (5) Athanassoula, E., Misiriotis, A. 2002, MNRAS, 330, 35
- (6) Barnes, J., Hut, P. 1986, Nature, 324, 446
- (7) Berentzen, I. Shlosman, I., Jogee, S. 2006, ApJ, 637, 582
- (8) Berentzen, I. Shlosman, I. 2006, ApJ, 648, 807
- (9) Berentzen, I., Shlosman, I., Martinez-Valpuesta, I., Heller, C.H. 2007, ApJ, 667, September 20, in press (astro-ph/0703028)
- (10) Bertoldi, F., et al. 2003, ApJ, 409, L47
- (11) Borriello, A., Salucci, P. 2001, MNRAS, 323, 285
- (12) Bosma, A. 2004, IAU Symp. 220, (Eds.) S.D. Ryder, D.J. Pisano, M. A. Walker & K.C. Freeman (San Francisco: ASP), 39
- (13) Brook, C.B., Richard, S., Kawata, D., Martel, H., Gibson, B.K. 2007a, ApJ, 658, 60
- (14) Brook, C.B., Kawata, D., Scannapieco, E., Martel, H., Gibson, B.K. 2007b, ApJ, 661, 10
- (15) Bullock, J.S., Dekel, A., Kolatt, T.S., Kravtsov, A.V., Klypin, A.A., Porciani, C., Primack, J.R. 2001, ApJ, 555, 240
- (16) Burkert, A. 1995, ApJ, 447, L25
- (17) Burkert, A.M., D’Onghia, E. 2004, astro-ph/0409540
- (18) Cole, S., Lacey, C.G., Baugh, C.M., Frenk, C.S. 2000, MNRAS, 319, 168
- (19) Debattista, V.P., Shen, J. 2007, ApJ, 654, L127
- (20) de Blok, W.J.G., Bosma, A. 2002, A&A, 385, 816
- Dehnen (2002) Dehnen, W. 2002, J. Comp. Phys., 179, 27
- (22) Dubinski, J. 1994, ApJ, 431, 617
- (23) Ellis, R. 2000, Imaging the Universe in Three Dimensions, ASP Vol. 195, (Eds.) W. van Breugel & J. Bland-Hawthorn, 13
- (24) Elmegreen, B.G., Elmegreen, D.M., Hirst, A.C. 2004, ApJ, 612, 191
- (25) El-Zant, A., Shlosman, I., Hoffman, Y. 2001, ApJ, 560, 636
- (26) El-Zant, A., Shlosman, I. 2002, ApJ, 577, 626
- (27) El-Zant, A., Shlosman, I., Begelman, M.C., Frank, J. 2003, ApJ, 590, 641
- (28) El-Zant, A., Hoffman, Y., Primack, J., Combes, F., Shlosman, I. 2004, ApJ, 607, L75
- (29) Fall, S.M., Efstathiou, G, 1980, MNRAS, 193, 189
- (30) Fan, X., et al. 2001, AJ, 122, 2833
- (31) Flores, R.A., Primack, J.R. 1994, ApJ, 427, L1
- (32) Gadotti, D.A., de Souza, R.E. 2003, ApJ, 583, L75
- (33) Governato, F., Mayer, L., Wadsley, J., Gardner, J.P., Willman, B., Hayashi, E., Quinn, T., Stadel, J., Lake, G. 2004, ApJ, 607, 688
- (34) Governato, F., Willman, B., Mayer, L., Brooks, A., Stinson, G., Valenzuela, O., Wadsley, J., Quinn, T. 2007, MNRAS, 374, 1479
- Heller & Shlosman (1994) Heller, C.H., Shlosman, I. 1994, ApJ, 424, 84
- Heller (1995) Heller, C.H. 1995, ApJ, 455, 252
- (37) Heller, C.H., Shlosman, I., Englmaier, P. 2001, ApJ, 553, 661
- (38) Heller, C.H., Shlosman, I., Athanassoula, E. 2007, ApJ, 657, L65
- (39) Hoffman, Y., Ribak, E. 1991, ApJ, 380, L5
- (40) Holley-Bockelmann, K., Weinberg, M., Katz, N. 2005, MNRAS, 363, 991
- (41) Immeli, A., Samland, M., O. Gerhard, O., Westera, P. 2004, A&A, 413, 547
- (42) Jogee, S., Barazza, F.D., Rix, H.-W., Shlosman, I., et al. 2004, ApJ, 615, L105
- Katz et. al. (1996) Katz, N., Weinberg, D.H., Hernquist, L. 1996, ApJS, 105, 19
- (44) Kaufmann, T., Mayer, L., Wadsley, J., Stadel, J., Moore, B. 2007, MNRAS, 375, 53
- (45) Kazantzidis, S., Kravtsov, A.V., Zentner, A.R., Allgood, B., Nagai, D., Moore, B. 2004, ApJ, 611, L73
- (46) Knapen, J.H., Shlosman, I., Peletier, R.F. 2000, ApJ, 529, 93
- (47) Kravtsov, A.V., Klypin, A.A., Bullock, J.S., Primack, J.R. 1998, ApJ, 502, 48
- (48) Leitherer, C., Robert, C., Drissen, L. 1992, ApJ, 401, 596
- (49) MacMillan, J.D., Widrow, L.M., Henriksen, R.N. 2006, ApJ, 653, 43
- (50) Maeder, A. 1992, A&A, 264, 105
- (51) Maeder, A. 1993, A&A, 268, 833
- (52) Maller, A. H., Dekel, A. 2002, MNRAS, 335, 487
- (53) Marinova, I., Jogee, S. 2007, ApJ, 659, 1176
- (54) Mathur, S., Wilkes, B.L., Ghosh. H. 2002, ApJ, 570, L5
- (55) McMillan, P.J. Dehnen, W. 2005, MNRAS, 363, 1205
- (56) Menendez-Delmestre, K., Sheth, K., Schinnerer, E., Jarrett, T.H., Scoville, N.Z. 2007, ApJ, 657, 790
- (57) Merrifield, M. R. 2002, The Shapes of Galaxies and Their Dark Matter Halos, ed. P. Natarajan (World Scientific), 170
- (58) Moore, B. 1994, Nature, 370, 629
- (59) Moore, B., Quinn, T., Governato, F., Stadel, J., Lake, G. 1999, MNRAS, 310, 1147
- Navarro & White (1993) Navarro, J.F., White, S. 1993, MNRAS, 265, 271
- (61) Navarro, J.F., Frenk, C.S., White, S.D.M. 1996, ApJ, 462, 563 (NFW)
- (62) Okamoto, T., Eke, V.R., Frenk, C.S., Jenkins, A. 2005, MNRAS, 363, 1299
- (63) Rix, H.-W., Zaritsky, D. 1995, ApJ, 447, 82
- (64) Rix, H.-W. et al. 2004, ApJ Suppl., 152, 163
- (65) Romano-Diaz, E., Hoffman, Y., Faltenbacher, A., Jones, D., Heller, C.H., Shlosman, I. 2006, ApJ, 637, L93
- (66) Romano-Diaz, E., Hoffman, Y., Heller, C.H., Faltenbacher, A., Jones, D., Shlosman, I. 2007, ApJ, 657, 56
- (67) Salucci, P., Burkert, A. 2000, ApJ, 537, L9
- (68) Samland, M., Gerhard, O. 2003, A&A, 399, 961
- (69) Sand, D.J., Treu, T., Smith, G.P., Ellis, R.S. 2004, ApJ, 604, 88
- (70) Scannapieco, E., Kawata, D., Brook, C.B., Schneider, R., Ferrara, A., Gibson, B.K. 2006, ApJ, 653, 285
- (71) Sellwood, J.A. 2003, ApJ, 587, 638
- (72) Sheth, K., Regan, M.W., Scoville, N.Z., Strubbe, L.E. 2003, ApJ, 592, L13
- (73) Shlosman, I., Noguchi, M. 1993, ApJ, 414, 473
- (74) Shlosman, I., Heller, C.H. 2002, ApJ, 565, 591
- (75) Sommer-Larsen, J., Gotz, M., Portinari, L. 2002, Ap & SS, 281, 519
- (76) Sommer-Larsen, J., Götz, M., Portinari, L. 2003, ApJ, 596, 47
- (77) Sommer-Larsen, J. 2006, ApJ, 644, L1
- (78) Spergel, D.N. et al. 2003, ApJ Suppl., 148, 175
- (79) Steinmetz, M., Navarro, J.F. 2002, New Astron., 7, 155
- (80) Stinson, G., Seth, A., Katz, N., Wadsley, J., Governato, F., Quinn, T. 2006, MNRAS, 373, 1074
- Thoul & Weinberg (1995) Thoul, A.A., Weinberg, D.H. 1995, ApJ, 442, 480
- (82) Trenti, M., Stiavelli, M. 2007, astro-ph/07053843
- (83) van den Bergh, S., Abraham, R.G., Whyte, L.F. et al. 2002, AJ, 123, 2913
- (84) van den Bosch, F.C., Burkert, A., Swaters, R.A. 2001, MNRAS, 326, 1205
- (85) van den Bosch, F.C. 2002a, MNRAS, 331, 98
- (86) van den Bosch, F.C. 2002b, MNRAS, 332, 565
- (87) Weinberg, M.D., Katz, N. 2002, ApJ, 580, 627
- (88) White, S.D.M., Rees, M.J. 1978, MNRAS, 183, 341
- (89) White, S.D.M. 1996, Cosmology & Large Scale Structure, 349, astroph/9410043
- (90) Zel’dovich, Ya.B., Novikov, I.D. 1975, Structure and Evolution of the Universe, Nauka: Moscow