33email: Matthias.Schreiber@uv.cl; lasota@iap.fr
The dwarf nova SS Cygni: what is wrong?
?abstractname?
Context. Since the Fine Guiding Sensor (FGS) on the Hubble Space Telescope (HST) was used to measure the distance to SS Cyg to be pc, it became apparent that at this distance the disc instability model fails to explain the absolute magnitude during outburst. It remained, however, an open question whether the model or the distance have to be revised. Recent observations led to a revision of the system parameters of SS Cyg and seem to be consistent with a distance of pc
Aims. We re-discuss the problem taking into account the new binary and stellar parameters measured for SS Cyg. We confront not only the observations with the predictions of the disc instability model but also compare SS Cyg with other dwarf novae and nova-like systems.
Methods. We assume the disc during outburst to be in a quasi stationary state and use the black-body approximation to estimate the accretion rate during outburst as a function of distance. Using published analysis of the long term light curve we determine the mean mass transfer rate of SS Cyg as a function of distance and compare the result with mass transfer rates derived for other dwarf novae and nova-like systems.
Results. At a distance of pc, both the accretion rate during outburst as well as the mean mass transfer rate of SS Cyg contradict the disc instability model. More important, at such distances we find the mean mass transfer rate of SS Cyg to be higher or comparable to those derived for nova-like systems.
Conclusions. Our findings show that a distance to SS Cyg pc contradicts the main concepts developed for accretion discs in cataclysmic variables during the last 30 years. Either our current picture of disc accretion in these systems must be revised or the distance to SS Cyg is pc.
Key Words.:
accretion, accretion discs – instabilities – stars: individual: SS Cyg – stars: novae, cataclysmic variables – stars: binaries: close1 Introduction
Dwarf novae are weakly magnetized cataclysmic variables (CVs) showing quasi-regular outbursts, i.e., increased visual brightness of 2-5 mag for several days, which typically reappear on timescales of weeks to months (e.g. Warner 1995, for a review).
The standard disc instability model (DIM) assumes a constant mass-transfer rate through the whole outburst cycle and is successful in explaining the basic properties of dwarf nova outbursts. In general the rise to maximum and the decay of normal outbursts is well described by the standard version of the model. There are problems with quiescence. Superoutbursts, Z Cam-type outbursts, and the reproduction of the outburst cycle in general require DIM modifications (see Lasota 2001, for a review).
On the other hand the DIM is too simple to be a faithful representation of dwarf nova outbursts. It uses a 1+1D scheme and is based on the –parameter description of viscosity. Although the news of the death of such an approach (Pessah et al. 2006) are exaggerated, its serious limitation have been well known for a long time.
It is therefore not surprising that the brightest and best observed dwarf nova SS Cyg has been a source problems for the DIM. Its various types of outbursts seem to require modulations of the mass-transfer rate and the anomalous outbursts remain unexplained (e.g. Schreiber et al. 2003). However, the main challenge comes from the distance to this system obtained from the HST/FGS parallax (Harrison et al. 1999). According to the DIM, at such a distance ( pc) the accretion disc of SS Cyg would be hot and stable and the system would not be a dwarf nova. Therefore such a distance, if correct, would seriously put in doubt the validity of the DIM. Indeed, Schreiber & Gänsicke (2002) concluded that either the DIM has to be modified and strongly enhanced mass transfer during outbursts plays an important role, or the distance of pc is wrong. Comparing detailed DIM simulations with the observations of SS Cyg, Schreiber et al. (2003) assumed pc doubting the correctness of higher values.
Recently (Bitner et al. 2007) observationally re-determined the parameters of SS Cyg and obtained values for the masses of the stellar components and the orbital inclination that differ significantly from those derived earlier. The new results are more reliable than earlier measurements because they do not rely on error-prone methods such as those based on the wings of emission lines to determine the mass ratio or those using a main sequence mass/radius relation to derive the orbital inclination (see Bitner et al. 2007, for a detailed discussion). Very important in the context of the DIM is the conclusion of Bitner et al. (2007) that their results are consistent with a distance of 140 – 170 pc in line with the parallax measurement. This forced us to re-examine the problem.
The structure of the paper is as follows. In Sect. 2 applying the method of Schreiber & Gänsicke (2002) but using the revised system parameters of Bitner et al. (2007) we compare the predicted absolute magnitude and the accretion rate during normal outbursts with the value derived from observations. Thereafter we determine the mean mass-transfer rate from the observed outburst properties (Sect.3) and again compare it with the predictions of the DIM. The conclusion of these two investigations is that a distance of pc is incompatible with the DIM. In Sect. 4 we compare the mean mass-transfer rates of SS Cyg and other dwarf novae with HST/FGS-parallax measurements with those of several nova-like binaries. We show that at the HST/FGS parallax distance SS Cyg is brighter than some nova-like systems and conclude that being an outbursting system at such high luminosity SS Cyg must be a very special CV indeed. In the following (Sect. 5) we re-consider the possibility that in SS Cyg the mass-transfer rate increases during outbursts as this would lower the mean mass-transfer rate.
2 Accretion rate during outburst
One of the key-predictions of the DIM is that at the onset of the decline, i.e. when the cooling front forms at the outer edge of the disc, the disc is in a quasi-stationary outburst state and the mass accretion rate is close to the critical mass transfer rate given by
| (1) |
where is the white-dwarf’s mass is solar units and the disc radius in units of cm (e.g. Hameury et al. 1998). The light curves of normal outbursts of SS Cyg show a plateau phase with nearly constant brightness before the onset of the decline. Therefore, according to the DIM, the accretion rate during outburst should be similar to the critical accretion rate. Assuming the outer radius of the disc to be close to the tidal truncation radius with being the primary’s Roche-lobe radius, we derive for the new parameters of SS Cyg (see Table 1)
| (2) |
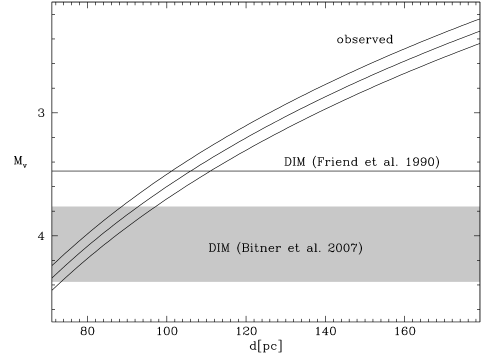
Clearly, we can derive the predicted absolute visual magnitude of a disc with this accretion rate. We follow Schreiber & Gänsicke (2002), i.e. we use the same equation to account for the inclination, assume the effective temperature to follow the radial dependence of stationary accretion discs and the annuli of the disc to radiate like black bodies. For the mass accretion rate given in Eq. (2) we than obtain as the predicted absolute magnitude during outburst. On the other hand, using the observed visual magnitude, i.e. , we can determine the absolute magnitude as a function of distance. Figure 1 compares both values. The shaded region represents the absolute magnitude predicted by the DIM for the range of system parameters for SS Cyg recently derived by Bitner et al. (2007) summarized in Table 1. Also shown in Fig. 1 (solid horizontal line) is the predicted absolute magnitude when using the same system parameter as Schreiber & Gänsicke (2002), i.e. those given by Ritter & Kolb (1998) which are based on Friend et al. (1990). Apparently, the range of predicted absolute magnitudes significantly decreased due to the change of the system parameters. As a consequence of the revised inclination and mass of the white dwarf (see Table 1), agreement with the DIM now requires distances as short as pc.
| Ritter & Kolb (1998) | Bitner et al. (2007) | |
|---|---|---|
| /hr | 6.6 | 6.6 |
| 0.70 | ||
| 37 | 45-56 | |
To see how the discrepancy in the absolute magnitudes for a distance of pc correlates with accretion rates, we also compare the value of the critical accretion rate (Eq. (2)) with the accretion rate required to reproduce the absolute magnitude assuming SS Cyg is at pc. We find that an accretion rate of
| (3) |
is required. This is an order of magnitude above the value predicted by the DIM (Eq. (2)). The value given above is also essentially higher (by a factor of ) than the one derived by Schreiber & Gänsicke (2002). The higher mass accretion rate is required because Bitner et al. (2007) found a higher value for the inclination and a lower value for the mass of the white dwarf.
3 The mean mass transfer rate
SS Cyg is among the visually brightest dwarf nova and a detailed long-term light curve exists. The mean outburst properties have been derived by Cannizzo & Mattei (1992, 1998) who analysed the AAVSO long term light curve. They find a mean outburst duration of days, a mean cycle duration of d giving a mean quiescence time of d. The mean duration of rise to outburst and decline from outburst are d and d respectively. Using these values we can now derive a value for the mean mass transfer rate from the observed visual magnitude during outburst. As in Sect. 2 we will compare the value derived from the observations with the prediction of the DIM.
According to the DIM, the mean mass-transfer rate can be obtained from the relation
| (4) |
where the fraction of the disc’s mass lost during outburst is and is the accretion rate at the disc’s inner edge. Usually and . Taking
| (5) |
(see Lasota 2001), , and the system parameters derived by Bitner et al. (2007) we obtain
| (6) |
The above value should be compared with the mean mass transfer rate derived from the observed visual brightness during outburst. Following again Schreiber & Gänsicke (2002, their Eq. (5)) but using the system parameters obtained by Bitner et al. (2007), we derive a mean mass transfer rate as function of distance. For pc we obtain
| (7) |
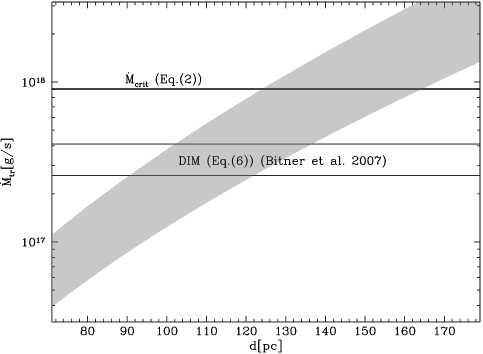
The two values for the mean transfer rate, i.e. the one predicted by the DIM and the one derived from the observations are compared in Fig. 2. The grey shaded region represents the values required by as a function of distance. The range of mean mass transfer rates predicted by the DIM (Eq. (6)) and the critical mass transfer rate (Eq. (2)) are shown as horizontal lines. Again, the discrepancy between DIM and HST/FGS parallax is obvious: According to the DIM, at pc SS Cyg should be nova-like system and not a dwarf nova. Even for pc, the derived mean mass transfer rates are close to the critical value and one would at least expect Z Cam-like behaviour. Again, agreement with the DIM requires a distance of pc.
Although the recently determined parameters significantly increase the discrepancy between HST/FGS parallax and DIM prediction, the problem has been mentioned and discussed earlier. Schreiber & Gänsicke (2002) proposed as one possible solution a revision of the DIM by assuming an increased value of the critical mass transfer rate which would be equivalent to allowing for dwarf nova outbursts for higher mass transfer rates. However, as we will see in the next section the problem is not with the DIM. At pc the mean mass-transfer rate of SS Cyg is comparable or higher than that of nova-like binaries with similar orbital parameters but unlike SS Cyg these systems never show outbursts. If anything they show a so-called “anti-dwarf-nova” behaviour.
4 Comparing SS Cyg with nova-like CVs
| name | d | i | ref. | |||||
|---|---|---|---|---|---|---|---|---|
| RW Tri | 0.4-0.7 | 0.3-0.4 | 5.565 | 310-370 | 67-80 | 13.2 | 0.3-0.7 | 1, 2, 3, 4, 5 |
| UU Aqr | 0.6-0.9 | 0.2-0.4 | 3.92 | 250-350 | 76-80 | 13.6 | 0-0.2 | 5, 6 |
| LX Ser | 0.37-0.43 | 0.3-0.4 | 3.80 | 300-400 | 77-83 | 14.4 | 0-0.2 | 4, 5 |
| RW Sex | 0.8-1.3 | 0.55-0.65 | 5.88 | 150-250 | 30-40 | 10.8 | 0-0.2 | 5, 7 |
| UX UMa | 0.4-0.5 | 0.4-0.5 | 4.72 | 200-300 | 69-73 | 12.8 | 0-0.2 | 4, 5 |
| V363 Aur | 0.8-1.0 | 0.8-1.0 | 7.71 | 600-1000 | 68-72 | 14.2 | 0.3-0.5 | 4, 8 |
For some systems the values given in the literature differ significantly. To keep our results as independent as possible of uncertainties related to the system parameters of nova-likes, we always used a broad range of parameters. The values of have been taken from Bruch & Engel (1994) and compared with Warner (1987) who quotes Bruch (1984). References: (1) McArthur et al. (1999), (2) Poole et al. (2003), (3) Groot et al. (2004), (4) Rutten et al. (1992, and references therein), (5) Vande Putte et al. (2003) (6) Baptista et al. (1994), (7) Beuermann et al. (1992), (8) Thoroughgood et al. (2004)
| name | d | i | ref. | ||||||
|---|---|---|---|---|---|---|---|---|---|
| SS Cyg | 0.6-1.0 | 0.4-0.7 | 6.6 | 45-56 | 8.5 | 0-0.2 | 5.8/49.5 | 1, 2, 3, 4 | |
| U Gem | 1.0-1.3 | 0.45-0.5 | 4.25 | 90-100 | 67-71 | 9.3-9.6 | 0-0.1 | 5/118 | 4, 5, 6 |
| SS Aur | 0.6-1.4 | 0.38-0.42 | 4.39 | 175-225 | 32-47 | 10.7-10.9 | 0.1-0.3 | 5/53 | 4, 5 |
| RU Peg | 1.1-1.4 | 0.9-1.0 | 8.99 | 261-303 | 34-48 | 9.0-9.1 | 0-0.1 | 6/75 | 4, 7 |
Again, we used a rather broad range of parameters in order to avoid our conclusions depending on uncertain parameters. For completeness we added again the parameters ranges for SS Cyg according to Bitner et al. (2007). Please note that for SS Cyg and are constrained by . References: (1) Bitner et al. (2007), (2) Harrison et al. (1999), (3) Cannizzo & Mattei (1992), (4) Harrison et al. (2004), (5) Szkody & Mattei (1984) (6) Naylor et al. (2005) (7) Ak et al. (2002)
There is an overwhelming evidence that the accretion disc is the site of dwarf-nova outbursts. The general picture of disc accretion in CVs is that below a certain mass transfer rate the disc is unstable and dwarf nova outbursts occur. For higher mass transfer rates, the disc is stable and the corresponding class of CVs are nova-like systems. In agreement with this picture, the mean absolute magnitudes of dwarf novae have been found to be lower than those of nova like systems (see Warner 1995, Fig. 9.8). To check whether this agreement remains for a distance to SS Cyg of pc, we compare the mean mass transfer rate derived for SS Cyg with those obtained for a set of well observed nova-like systems and three additional dwarf nova with measured HST/FGS parallax (see Table 2 and 3).
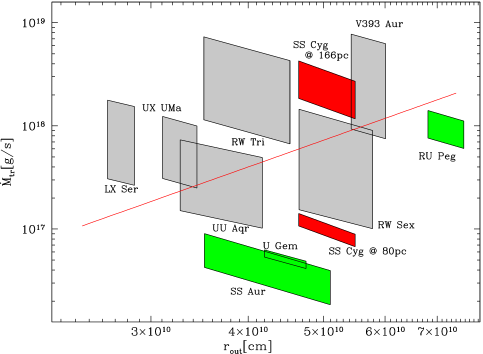
Figure 3 (inspired by Fig 1 in Smak 1983) shows the derived mean mass transfer rates as a function of the outer radius of the disc during outburst. To avoid our results depending on uncertainties in the system parameters derived from observation we used rather broad ranges of parameters. The straight line represents the critical mass transfer rate for . Obviously, at a distance of pc the mean mass transfer rate of SS Cyg is claerly above this limit as discussed earlier (Fig. 2). The other three dwarf novae are below the dividing line and the nova-likes have mass transfer rates higher than (or similar to) the critical rate. The striking point of Fig. 3 is the fact that the mean mass transfer rate of SS Cyg is larger (or as large) as those derived for nova-like systems with similar system parameters. In other words, if SS Cyg is indeed pc away, the difference between nova-like systems and the dwarf nova SS Cyg cannot be in the mean mass transfer rate. This conclusions represents a very important finding because it contradicts the generally accepted picture for accretion discs in CVs.
Clearly, one could argue that the distances to the nova-like systems might be systematically too small. However, the distance to RW Tri is based on a HST/FGS parallax and for the other systems we used very large upper limits for the distance. Hence, there is no easy way out of the problem. In the next section we will discuss a substantial revision of the DIM that might provide a solution.
5 Enhanced mass-transfer rate
Smak (2000), Lasota (2001), and Smak (2005) showed that enhanced mass transfer during outburst is required to explain the light curve of U Gem, especially the extremely long superoutburst in 1985. Moreover, modulations of the mass-transfer rate are necessary to explain outburst properties of SS Cyg itself (Schreiber et al. 2003) and it seems that there is growing evidence for enhanced mass transfer playing an important role in short orbital period dwarf novae of the SU UMa type (Schreiber et al. 2004; Smak 2004a, 2005; Sterken et al. 2007).
The mean mass-transfer rate is not an observed quantity but is calculated assuming constant mass-transfer rate over the cycle, hence, in case the mass transfer rate is significantly enhanced during outburst, our values are only upper limits. In addition, in the framework of the enhanced mass transfer scenario, the accretion rate during outburst and at the onset of the decline does not need to be the critical mass-accretion rate. Therefore, if evidence for a distance above pc further grows, the enhanced mass transfer scenario might be considered a possible solution. The enhancement needed to put SS Cyg in the observed dwarf nova band is quite substantial. Assuming a mean mass transfer rate of g/s during quiescence, Schreiber & Gänsicke (2002) estimated the required mass transfer enhancement to be by about a factor of .
Taking into account the revisions of the system parameters according to Bitner et al. (2007), the required mass transfer enhancement reaches a factor of for pc. Even at a distance of pc a factor of is required. Compared to mass transfer enhancements predicted for U Gem (factor 20-50, Smak (2005)) or SU UMa superoutbursts (15-60, Smak (2004a)) this seems to be plausible but one should keep in mind the model calculations by Smak (2004b) which seem to exclude irradiation induced enhancement for h. However, if a distance to SS Cyg of pc will be further confirmed in the future, considering enhanced mass transfer even in (some) long orbital period dwarf novae appears to be the most plausible mechanism to explain the observations.
6 Conclusions
The long term light curve of SS Cyg has been frequently used to constrain the disc instability model, in particular the viscosity parameter . Now, it seems that we can learn something very different but equally essential about accretion discs in CVs from analysing this particular system. SS Cyg is a dwarf nova and not a nova-like. It seems that the distance to SS Cyg is above pc. If this will be further confirmed, then there is something we do not understand in this binary. The standard interpretation of mean mass transfer rates that are constant over the outburst cycle cannot be true and a difference in the mean mass transfer rate cannot be the only difference between nova-likes and (at least one) dwarf nova. This might mean that the standard DIM is in fact not adequate and has to be modified by including mass-transfer modulations. This is not a surprise to these authors (e.g. Schreiber et al. 2000; Lasota 2001; Buat-Ménard et al. 2001; Schreiber et al. 2004).
Acknowledgements.
JPL is grateful to Rob Robinson for helpful comments on observations of SS Cyg. MRS acknowledges support from FONDECYT (grant 1061199), DIPUV (project 35), and the Center of Astrophysics in Valparaiso. This research was supported in part by the National Science Foundation under Grant No. PHY05-51164, report number: NSF-KITP-07-151.?refname?
- Ak et al. (2002) Ak, T., Ozkan, M. T., & Mattei, J. A. 2002, A&A, 389, 478
- Baptista et al. (1994) Baptista, R., Steiner, J. E., & Cieslinski, D. 1994, ApJ, 433, 332
- Beuermann et al. (1992) Beuermann, K., Thorstensen, J. R., Schwope, A. D., Ringwald, F. A., & Sahin, H. 1992, A&A, 256, 442
- Bitner et al. (2007) Bitner, M. A., Robinson, E. L., & Behr, B. B. 2007, ApJ, 662, 564
- Bruch (1984) Bruch, A. 1984, A&AS, 56, 441
- Bruch & Engel (1994) Bruch, A. & Engel, A. 1994, A&AS, 104, 79
- Buat-Ménard et al. (2001) Buat-Ménard, V., Hameury, J.-M., & Lasota, J.-P. 2001, A&A, 369, 925
- Cannizzo & Mattei (1992) Cannizzo, J. K. & Mattei, J. A. 1992, ApJ, 401, 642
- Cannizzo & Mattei (1998) —. 1998, ApJ, 505, 344
- Friend et al. (1990) Friend, M. T., Martin, J. S., Connon-Smith, R., & Jones, D. H. P. 1990, MNRAS, 246, 637
- Groot et al. (2004) Groot, P. J., Rutten, R. G. M., & van Paradijs, J. 2004, A&A, 417, 283
- Hameury et al. (1998) Hameury, J., Menou, K., Dubus, G., Lasota, J., & Hure, J. 1998, MNRAS, 298, 1048
- Harrison et al. (2004) Harrison, T. E., Johnson, J. J., McArthur, B. E., Benedict, G. F., Szkody, P., Howell, S. B., & Gelino, D. M. 2004, AJ, 127, 460
- Harrison et al. (1999) Harrison, T. E., McNamara, B. J., Szkody, P., MCArthur, B. E., Benedict, G. F., Klemola, A. R., & Gilliland, R. L. 1999, ApJ Lett., 515, L93
- Lasota (2001) Lasota, J.-P. 2001, New Astronomy Review, 45, 449
- McArthur et al. (1999) McArthur, B. E., Benedict, G. F., Lee, J., Lu, C. L., van Altena, W. F., Deliyannis, C. P., Girard, T., Fredrick, L. W., Nelan, E., Duncombe, R. L., Hemenway, P. D., Jefferys, W. H., Shelus, P. J., Franz, O. G., & Wasserman, L. H. 1999, ApJ Lett., 520, L59
- Naylor et al. (2005) Naylor, T., Allan, A., & Long, K. S. 2005, MNRAS, 361, 1091
- Pessah et al. (2006) Pessah, M. E., Chan, C.-k., & Psaltis, D. 2006, ArXiv Astrophysics e-prints
- Poole et al. (2003) Poole, T., Mason, K. O., Ramsay, G., Drew, J. E., & Smith, R. C. 2003, MNRAS, 340, 499
- Ritter & Kolb (1998) Ritter, H. & Kolb, U. 1998, A&AS, 129, 83
- Rutten et al. (1992) Rutten, R. G. M., Van Paradijs, J., & Tinbergen, J. 1992, A&A, 260, 213
- Schreiber & Gänsicke (2002) Schreiber, M. R. & Gänsicke, B. T. 2002, A&A, 382, 124
- Schreiber et al. (2000) Schreiber, M. R., Gänsicke, B. T., & Hessman, F. V. 2000, A&A, 358, 221
- Schreiber et al. (2003) Schreiber, M. R., Hameury, J.-M., & Lasota, J.-P. 2003, A&A, 410, 239
- Schreiber et al. (2004) —. 2004, A&A, 427, 621
- Smak (1983) Smak, J. 1983, ApJ, 272, 234
- Smak (2000) —. 2000, New Astronomy Review, 44, 171
- Smak (2004a) —. 2004a, Acta Astronomica, 54, 221
- Smak (2004b) —. 2004b, Acta Astronomica, 54, 181
- Smak (2005) —. 2005, Acta Astronomica, 55, 315
- Sterken et al. (2007) Sterken, C., Vogt, N., Schreiber, M. R., Uemura, M., & Tuvikene, T. 2007, A&A, 463, 1053
- Szkody & Mattei (1984) Szkody, P. & Mattei, J. A. 1984, PASP, 96, 988
- Thoroughgood et al. (2004) Thoroughgood, T. D., Dhillon, V. S., Watson, C. A., Buckley, D. A. H., Steeghs, D., & Stevenson, M. J. 2004, MNRAS, 353, 1135
- Vande Putte et al. (2003) Vande Putte, D., Smith, R. C., Hawkins, N. A., & Martin, J. S. 2003, MNRAS, 342, 151
- Warner (1987) Warner, B. 1987, MNRAS, 227, 23
- Warner (1995) —. 1995, Cataclysmic Variable Stars (Cambridge: Cambridge University Press)