Evidence for a parsec scale X-ray jet from the accreting neutron star Circinus X-1
Abstract
We analyzed the zero-order image of a 50 ks Chandra gratings observation of Circinus X-1, taken in 2005 during the source’s low-flux state. Circinus X-1 is an accreting neutron star that exhibits ultra-relativistic arcsecond-scale radio jets and diffuse arcminute-scale radio jets and lobes. The image shows a clear excess along the general direction of the north-western counter-jet, coincident with the radio emission, suggesting that it originates either in the jet itself or in the shock the jet is driving into its environment. This makes Circinus X-1 the first neutron star for which an extended X-ray jet has been detected. The kinetic jet power we infer is significantly larger than the minimum power required for the jet to inflate the large scale radio nebula.
Subject headings:
stars: neutron — ISM: jets and outflows — X-rays: binaries1. Introduction
Circinus X-1 is an unusual, highly variable X-ray binary. Beyond variability at the 16.5 day orbital period, which includes deep dips near orbital phase 0, its long-term light curve can reach peak fluxes between 1 – 2 Crab, but also shows several long incursions into a very deep low-flux state. The compact object in this system is believed to be a neutron star, based on observed type I X-ray bursts (Tennant et al., 1986), putting the source at a likely distance of (Jonker & Nelemans, 2004; Jonker et al., 2007), roughly consistent with the estimated hydrogen absorption column of (e.g. Schulz & Brandt, 2002). We will adopt a distance of throughout this letter.
One of the remarkable characteristics of the source is its radio structure: on arcmin scales, Circinus X-1 shows two radio jets (running south-east to north-west), embedded in a large scale, diffuse radio nebula (e.g. Stewart et al., 1993; Tudose et al., 2006). This nebula is most likely the radio lobe inflated by the jets over several hundred thousand years (Heinz, 2002). The arcmin-scale jets are clearly curved, a possible sign of interaction with the interstellar medium or jet precession. On arcsec scales, radio monitoring revealed a one-sided, highly variable jet (Fender et al., 2004), with a lower limit on the jet Lorentz factor of 16, making Circinus X-1 the only neutron-star X-ray binary with a large-scale radio jet and, at the same time, the fastest known microquasar.
Because relativistic jets are launched in the inner regions of accretion flows, they are important probes of strong gravity and the physics of compact objects. One fundamental question in the study of microquasars is if and how neutron star jets are different from black-hole jets. As the only neutron star with a known ultra-relativistic, powerful jet, Circinus X-1 is a very important object: in the radio, the jets exhibit all the hallmarks one would otherwise expect from a black hole. Does this equivalence carry over to other wave bands? The discovery of resolved X-ray jets from a number of black-hole X-ray binaries Corbel et al. 2002, 2005 suggests that Chandra might be able to detect extended jet emission from Circinus X-1 as well.
Circinus X-1 is overwhelmingly X-ray bright during its high state, rendering any extended jet emission unobservable. Only in its low-flux state could we hope to detect this emission. In §2, we analyze the zero-order image of a Chandra observation during this state and argue that the extended excess emission we detect originates in the counter-jet, §3 discusses the implications.
2. Observations and Analysis
Circinus X-1 was observed with the high energy transmission gratings (HETGS; Canizares et al. 2005) onboard the Chandra X-ray Observatory on June 2nd 2005 (04:13:01 UT, OBSID 5478) as part of a campaign to obtain high-resolution X-ray spectra of the source during its extremely low long-term X-ray flux state. The observation lasted 50 ks and occurred at orbital phases 0.06 – 0.10. As a byproduct of this observation we obtained a zero-order image of the source. The source flux was exceptionally low and the point spread function (PSF) is almost completely pileup free due to the application of a 1/2 subarray mode which held the CCD frametime to 1.7 s.
The upper panels of Fig. 1 show the zero-order image. The colors represent increasing count levels from black (low) to white (high). With the HETG in place the zero-order image is affected by various artifacts. Visible are the four dispersion arms of the positive and negative orders of the medium and high energy gratings. These lie at position angles of , and the same at 180∘ rotation (position angles throughout this letter are measured counter-clockwise from due West from the point source and abbreviated as PA), outward of about 1.3 arcmin. Furthermore the spectrometer shields some of the soft X-ray photons below 0.7 keV and reduces the overall throughput in an azimuthally uniform fashion. The zero-order PSF is otherwise not affected by the spectrometer. For brighter sources the CCD read out streak (a charge trace along the PSF centroid column) becomes prominent. In order to enhance contrast in the PSF wing areas the core of the PSF in Fig. 1 is over-exposed.
2.1. The X-ray jet
Figure 1 shows a distinctive surface brightness excess in the north-western quadrant that does not line up with any of the known PSF artifacts (see white arrow). The morphology
![[Uncaptioned image]](/html/0706.3881/assets/x1.png)
Fig. 1: (a) top left: 0.3-10 keV counts image of Circinus X-1. The white arrow denotes the position of the X-ray jet, the green box is the region displayed in the other three panels; (b) top right: enlarged image of the analysis box; (c) bottom left: adaptively smoothed, cleaned difference image with 5 significance per smoothing length. Jet emission is visible in red; (d) bottom right: smoothed color image (red: 2-4 keV, green: 4-7 keV, blue: 7-10 keV), showing that the jet is soft (red). Hatched area shows regions affected by the read out streak.
of the feature resembles two filaments pointing away from the point source at PAs and . The bottom panel of Fig. 2 shows a combined radial surface-brightness profile along two 15∘ wide sectors centered on those two PAs (see insert for extraction region), clearly showing the excess emission in the region from about 0.45 to 0.9 arcmin. The formal statistical significance of the excess over the azimuthally smoothed background emission is 7.1 sigma. A Gaussian fit yields a centroid distance of arcmin from the point source and .
In order to illustrate the excess more clearly, we adaptively
smoothed the central region of the zero-order image after removing all the gratings and CCD artifacts, subtracted the azimuthally averaged profile , and divided the difference image by to create a normalized difference image (panel c, Fig. 1). The adaptive smoothing length was chosen to vary only with radial distance from the point source to provide an average significance of 5 per smoothing length.
Figure 2 also shows an azimuthal surface brightness profile across an annular sector covering the excess emission. The filaments show clear lateral extent: For comparison, Fig. 2 also shows an azimuthal profile across the readout streak, which is representative of the image resolution, and is much narrower. Fitting two Gaussians to the excess yields centroid angles of and and widths of and , respectively, spanning an angle of from peak to peak. Since the inclination angle of the feature (angle to the line of sight) is unknown, this is an upper limit on the opening angle.
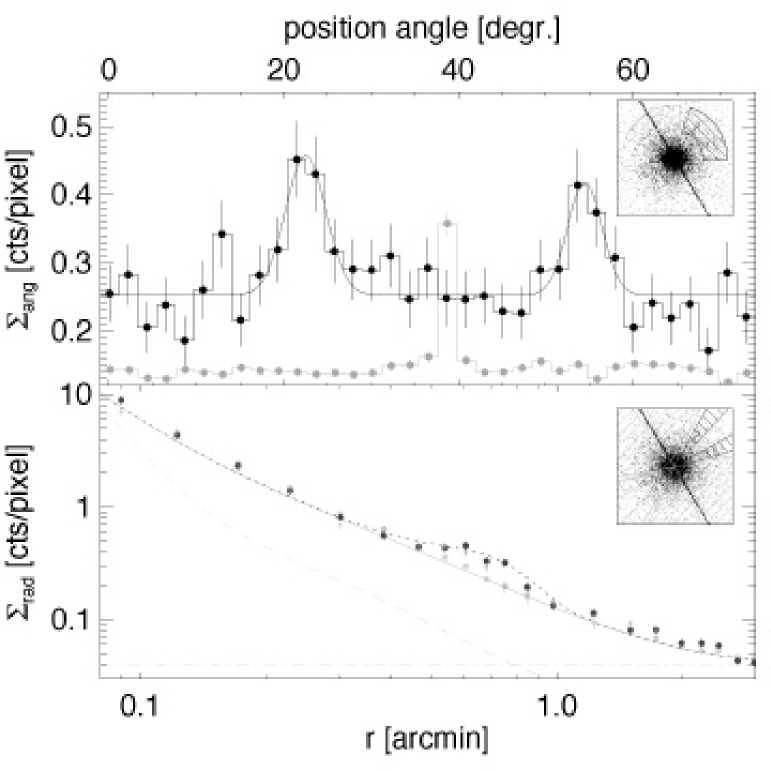
It is noteworthy that even the azimuthally symmetric emission is well in excess of the PSF estimate derived from Marx ray-tracing. However, calibration observations show that the ray-traced PSF underestimates the true PSF by a factor of order 2-3, especially at high energies, making this excess emission marginal at best. It is possible that such excess emission stems from the large scale synchrotron nebula around the source. However, given the questionable significance, detailed discussion of this spherical excess is beyond the scope of this letter.
2.2. Comparison with the radio jet
The excess emission is generally aligned with the north-western arcmin-scale radio jet. Multiple epochs of radio observations with varying resolution exist of the Circinus X-1 jet. Stewart et al. (1993) presented 1991 ATCA observations (12 arcsec resolution) which show diffuse extended emission on arcmin scales and a jet-like enhancement in the south–east to north–west direction. On the scale of the observed X-ray feature, we estimate the jet PA to be roughly , with significant bending towards larger PAs on larger scales. Tudose et al. (2006) presented recent ATCA observations on the same scales as Stewart et al. (1993). In the highest resolution image (2004 epoch), we estimate a PA of . Finally, Fender et al. (2004) presented a series of well-resolved jet images (10/2000-12/2002) on scales of about 10 arcsec, with a PA of . While relativistic Doppler boosting hides the receding north-western jet from view, it is reasonable to expect that it travels in the opposite direction from the approaching jet, implying a PA of . All of these angles fall between the two X-ray filaments.
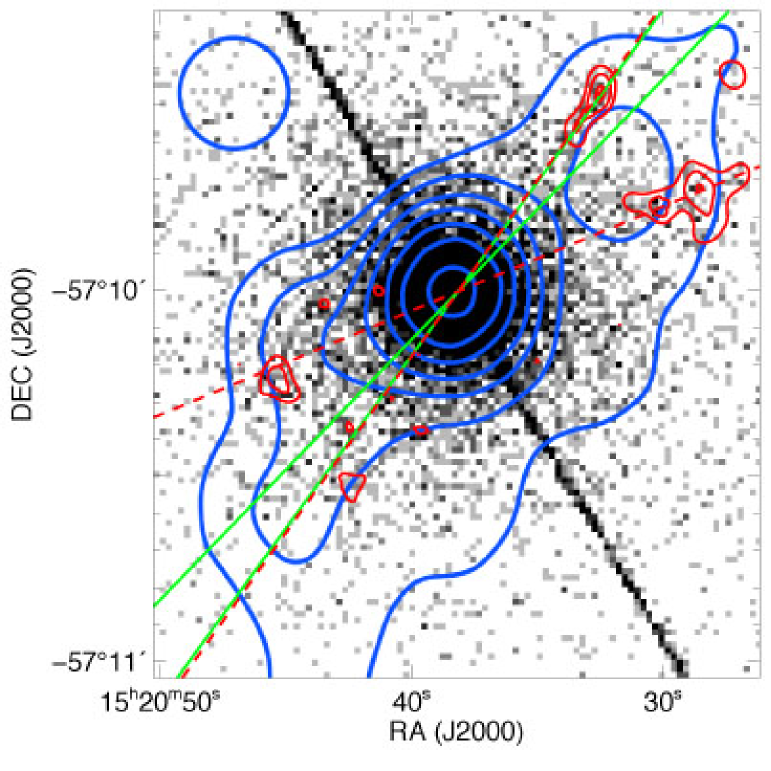
Figure 3 shows an overlay of the radio contours from Tudose et al. (2006, blue contours), the X-ray image (grey scale) and the smoothed jet contours from Fig. 1c (red contours). Also shown are the limits on the PA for the approaching arcsec-scale jet (Fender et al., 2004, green lines). It is clear from the figure that the two north-western X-ray arms are closely “hugging” the radio jet on either side. We thus interpret the features as the X-ray counterpart to the receding north-western radio jet from Circinus X-1.
The light travel time from the point source to the location of the X-ray jet is (where the inclination is the angle between the jet and the line of sight). Since is not known, we cannot directly associate the X-ray jet with a specific radio episode or X-ray state change of the binary. Since we observed Circinus X-1 in 2005, any associated central flare must have happened before 2000. This is also the time scale on which one would expect changes to the X-ray jet to occur (e.g., proper motion), which should be detectable by future Chandra observations.
2.3. The X-ray spectrum
The spectrum of the point source Circinus X-1 has been analyzed by Schulz et al. (2007). The spectrum appears extremely hard in this very low-flux state, with virtually no counts below 1 keV. This hard spectrum is reflected in the diffuse emission from the wings of the PSF. Figure 1d shows a smoothed color image of the inner region, indicating that the jet emission has a significantly softer X-ray color than the background (red: 1-4 keV, green: 4-7 keV, blue: 7-10 keV). Note that the other region with visibly softer spectrum is the south-eastern quadrant, close to where we would expect to find the approaching jet (see §3.2 for a brief discussion of the south-eastern emission).
The background-subtracted count rate from the jet is , giving roughly 175 counts from the jet over 480 background counts. Given the limited number of counts, we restricted fitting to the simplest possible models. The first model we fitted was an absorbed power-law, giving and . As it stands, the best-fit photon index is broadly consistent with the emission being of synchrotron origin (for which we would expect ). An absorbed thermal model can fit the data equally well, giving and keV.
Taking the best-fit spectral parameters at face value, we can estimate the un-absorbed 2-10 keV source flux to be roughly , corresponding to an X-ray luminosity of .
3. Discussion
3.1. Interpretation and physical parameters
The V-shaped morphology of the X-ray jet suggests limb-brightened emission from the surface of a conical volume. The length of the X-ray jet is roughly . Given the half-opening angle of roughly , the volume of the emitting cone is . Since we can observe the radio and X-ray counter-jet on arcmin scales, it is safe to assume that its motion is no longer ultra-relativistic and we can neglect Doppler corrections. We propose two possible alternative explanations for the origin of the excess emission:
Synchrotron emission from the jet: The X-ray emission could be limb-brightened emission from the conical walls of the jet itself. Assuming a synchrotron slope of and a volume filling fraction of order unity, the equipartition particle pressure is . We can then estimate the minimum jet power in the counter-jet to be roughly which is larger than, and thus consistent with, the lower limit on the time-averaged kinetic power from the large scale radio nebula (Heinz, 2002; Tudose et al., 2006).
Thermal emission: The X-rays could also be due to thermal emission from the shock driven into the ISM by the propagation of the jet alongside the expanding cocoon. In this case, the required electron density would be , with a total emitting gas mass of and a very high pressure of . Since the shock velocity is fixed by the temperature, we can estimate the jet power required to explain the X-rays to be , which is similar to the power estimated for the synchrotron case, making a relatively robust estimate.
Inverse Compton emission: In order for inverse Compton emission to explain the X-ray jet, potential seed photons would have to come from the diffuse radio lobe, from the radio jet (as synchrotron-self Compton), or from the binary. In all three cases, the pressure required to produce the observed X-ray flux falls into the range to , which can be ruled out on energetic grounds. Thus, inverse Compton scattering is not a viable radiation mechanism.
3.2. The south-eastern X-ray jet
The radial surface brightness profile along the direction of the approaching jet in Fig. 2 shows a small excess over the average profile is visible from the plot, significant at the 4 level. Given that the approaching jet is observed in the radio, the low intensity of the approaching X-ray jet is noteworthy and could have one or both of the following causes:
a) The dimness of the approaching jet could reflect differences in the environment on the near and far side of the source. Given the clear non-spherical appearance of the radio nebula, such an asymmetry in ISM density and/or pressure is likely present.
b) The difference between approaching and receding jet must reflect the light travel time difference between both sides if the jet is propagating close to the speed of light. is significantly longer than the variability time scale for state transitions. Thus, it is plausible that the absence of the approaching X-ray jet reflects different activity levels of the source over roughly a 10 yr period.
3.3. Broader implications
Chandra found extended X-ray jets for a number of either identified or likely black hole X-ray binaries (XTE J1550-564, Corbel et al. 2002; SS433, Migliari et al. 2002; H1743-322, Corbel et al. 2005; and Cygnus X-3, Heindl et al. 2003). Circinus X-1 is thus the first bona fide neutron star with an extended X-ray jet.
The minimum power of is roughly 4% of the Eddington luminosity for a neutron star. At peak flux, Circinus X-1 is only slightly super-Eddington, and because, unlike in black holes, mass cannot disappear into an event horizon, we can turn this into a lower limit on the jet production efficiency of , that is: upward of 0.5% of the accreted rest mass energy must have gone into powering the X-ray jet. This makes Circinus X-1 as efficient as a black hole in making jets, despite its shallower potential. It also ties Circinus X-1 directly to the radio nebula, showing that the jets have more than enough power to inflate the large scale lobes.
Acknowledgments: We would like to thank Mike Nowak and John Davis for their insight and support. NSS and WNB acknowledge support through NASA grant G05-6040X.
References
- Canizares et al. (2005) Canizares, C. R. et al. 2005, PASP, 117, 1144
- Corbel et al. (2002) Corbel, S., Fender, R. F., Tzioumis, A. K., Tomsick, J. A., Orosz, J. A., Miller, J. M., Wijnands, R., & Kaaret, P. 2002, Science, 298, 196
- Corbel et al. (2005) Corbel, S., Kaaret, P., Fender, R. P., Tzioumis, A. K., Tomsick, J. A., & Orosz, J. A. 2005, ApJ, 632, 504
- Fender et al. (2004) Fender, R., Wu, K., Johnston, H., Tzioumis, T., Jonker, P., Spencer, R., & van der Klis, M. 2004, Nature, 427, 222
- Heindl et al. (2003) Heindl, W. A., Tomsick, J. A., Wijnands, R., & Smith, D. M. 2003, ApJ, 588, L97
- Heinz (2002) Heinz, S., 2002, A&A, 388, L40
- Jonker & Nelemans (2004) Jonker, P. G. & Nelemans, G. 2004, MNRAS, 354, 355
- Jonker et al. (2007) Jonker, P. G., Nelemans, G., & Bassa, C. G. 2007, MNRAS, 374, 999
- Migliari et al. (2002) Migliari, S., Fender, R., & Méndez, M. 2002, Science, 297, 1673
- Schulz et al. (2007) Schulz, N. S., Kallman, T., Galloway, D., & Brandt. 2007, ApJ, in preparation
- Schulz & Brandt (2002) Schulz, N. S. & Brandt, W. N. 2002, ApJ, 572, 971
- Stewart et al. (1993) Stewart, R. T., Caswell, J. L., Haynes, R. F., & Nelson, G. J. 1993, MNRAS, 261, 593
- Tennant et al. (1986) Tennant, A. F., Fabian, A. C., & Shafer, R. A. 1986, MNRAS, 221, 27P
- Tudose et al. (2006) Tudose, V., Fender, R. P., Kaiser, C. R., Tzioumis, A. K., van der Klis, M., & Spencer, R. E. 2006, MNRAS, 372, 417