The effect of dwarf galaxies disruption in semi-analytic models
Abstract
We present results for a galaxy formation model that includes a simple treatment for the disruption of dwarf galaxies by gravitational forces and galaxy encounters within galaxy clusters. This is implemented a posteriori in a semi–analytic model by considering the stability of cluster dark matter sub-haloes at . We assume that a galaxy whose dark matter substructure has been disrupted will itself disperse, while its stars become part of the population of intracluster stars responsible for the observed intracluster light. Despite the simplicity of this assumption, our results show a substantial improvement over previous models and indicate that the inclusion of galaxy disruption is indeed a necessary ingredient of galaxy formation models. We find that galaxy disruption suppresses the number density of dwarf galaxies by about a factor of two. This makes the slope of the faint end of the galaxy luminosity function shallower, in agreement with observations. In particular, the abundance of faint, red galaxies is strongly suppressed. As a result, the luminosity function of red galaxies and the distinction between the red and the blue galaxy populations in colour–magnitude relationships are correctly predicted. Finally, we estimate a fraction of intracluster light comparable to that found in clusters of galaxies.
keywords:
methods: numerical – galaxies: formation – galaxies: evolution – galaxies: interaction1 Introduction
The existence of a diffuse population of intracluster stars was first proposed by Zwicky (1951) and has since been detected unambiguously. Individual intracluster AGB stars (Durrell et al., 2002), planetary nebulae (Arnaboldi et al. 1996, Feldmeier et al. 2003, Arnaboldi et al. 2004, Feldmeier et al. 2004), novae and supernovae (Gal-Yam et al. 2003, Neill et al. 2005) have been resolved in nearby clusters and trace an unbound population of red, old stars orbiting freely in the cluster potential (Krick et al., 2006).
The light associated with intracluster stars, or diffuse intracluster light (ICL), can contribute between 10 and 40 per cent of the optical emission of rich galaxy groups and clusters (Bernstein et al. 1995; Gonzalez et al. 2000; Feldmeier et al. 2002; Feldmeier et al. 2004; Gonzalez et al. 2005; Zibetti et al. 2005). In the core of massive clusters like Coma, ICL emission not associated with the central giant elliptical galaxy can account for up to 50 per cent of the total optical light (Bernstein et al., 1995).
Rather than having formed in the intracluster medium, intracluster stars are believed to be the remnants of disrupted galaxies. Gas-dynamical simulations generally agree that the bulk of the ICL is emitted by stars that have been continually stripped from member galaxies throughout the lifetime of a cluster, or have been ejected into intergalactic space by merging galaxy groups (Moore et al. 1996; Napolitano et al. 2003; Murante et al. 2004; Willman et al. 2004; Sommer-Larsen et al. 2005; Monaco et al. 2006; Murante et al. 2007). Several mechanisms can contribute to disrupting galaxies, the most efficient ones being tidal stripping by the gravitational forces of the cluster halo (Merritt, 1984) and high-speed galaxy encounters (Richstone, 1976). Smoothed particle hydrodynamic simulations by Murante et al. (2007) show that 60 to 90 per cent of the population of intracluster stars has been generated at by relaxation processes during galaxy mergers, with a minor fraction arising from tidal stripping. In groups, low speed galaxy encounters and dynamical heating by galaxy scattering with halo substructures may enhance the removal of stars by tidal stripping once a group merges with a larger cluster (Gnedin 2003; Mihos 2004; Rudick et al. 2006).
Low surface brightness features have been identified in the Coma and Centaurus clusters (Gregg & West 1998; Trentham & Mobasher 1998; Feldmeier et al. 2002), indicating the presence of dynamically-young tidal structures produced by the disruption of infalling galaxies. These features carry information about the orbit of the parent galaxy and can be used to trace the cluster accretion history and its past dynamical interactions (Calcáneo-Roldán et al., 2000). Another indication comes from the number density of satellites in groups. Faltenbacher & Mathews (2005) show that the projected number density profile of dwarf galaxies in NGC 5044 can only be explained by assuming that a significant amount of mass in satellite galaxies is tidally disrupted.
Further compelling evidence for galaxy disruption comes from the population of ultra compact dwarf galaxies in clusters (UCDs, Hilker et al. 1999; Drinkwater et al. 2000; Hilker et al. 2007), which is believed to form when the low surface density disk component of a dwarf galaxy is tidally-stripped away. Indeed, UCDs might share a common origin with intracluster stars (Zibetti & White 2004).
High-resolution numerical simulations suggest that galaxies may disperse a non-negligible fraction of their stellar component into the intracluster medium during mergers (Monaco et al. 2006; Murante et al. 2007; Conroy et al. 2007). Monaco et al. (2006) find that the small degree of evolution seen at for the high-mass end of the stellar mass function can be accounted for if merging galaxies eject at least 20 per cent of their stars. The joint analysis of simulation-based models and observations of ICL by Conroy et al. (2007) favours models in which as much as 80 per cent of stars are stripped into the intracluster medium from satellite galaxies whose dark matter substructure has been disrupted.
If, as simulations suggest, intracluster stars have been stripped from galaxies with all ranges of masses (Bullock et al. 2001; Taylor & Babul 2001; Benson et al. 2002; Monaco et al. 2006; Murante et al. 2007), it is likely that the faint end of the luminosity and stellar mass functions are affected as strongly as the bright end. However, while several works have investigated the effect of galaxy disruption on the evolution of massive galaxies, there are only a couple of suggestions in the literature that pinpoint the effect of disruption on the abundance of dwarfs (Zibetti & White 2004, Zibetti et al. 2005).
In this work, we use simulated galaxy catalogues, produced by
semi-analytic models of galaxy formation111The catalogues are
publicly available at:
http://www.mpa-garching.mpg.de/millennium/
and
http://www.virgo.sussex.ac.uk/Millennium/millennium.html
(De Lucia &
Blaizot 2007, hereafter DLB07; Bertone
et al. 2007,
hereafter BDT07) to investigate how
galaxy disruption affects the abundance of dwarf galaxies by
considering its effects on the faint end of the stellar mass and
luminosity functions. In particular, we focus on the abundance of
dwarf red galaxies, which is considerably overpredicted by current
galaxy formation models (Croton
et al., 2006).
2 The model
In this Section we briefly describe the Millennium galaxy catalogue we use for this work and our method for identifying disrupted galaxies in groups and clusters.
The Millennium Simulation traces the evolution of dark matter haloes in a cubic box of 500Mpc on a side (Springel et al., 2005). It assumes a CDM cosmology with parameters , , , , , and , where the Hubble parameter is km s-1 Mpc-1. The simulation follows dark matter particles of mass M☉. Since dark matter haloes are required to contain at least 20 particles, the minimum halo mass is M☉, with a corresponding baryonic mass of about M☉.
Currently, three different galaxy catalogues based on the Millennium simulation have been publicly released (DLB07; Bower et al. 2006; BDT07). The catalogue of Bower et al. (2006) is not suitable for this study, because it does not distinguish between cluster galaxies associated with dark matter substructures and those whose substructure has completely merged with the parent halo. The catalogues of DLB07 and BDT07 do make this distinction and are therefore best suited to our purposes. These last two models differ only in the adopted scheme for galactic feedback. The model of DLB07 uses the empirical feedback scheme of Croton et al. (2006), while BDT07 implement a dynamical feedback scheme that directly solves the equation of motion for the evolution of galactic winds (Bertone et al., 2005). Both models over-predict the abundance of dwarf galaxies, and in particular that of dwarf red galaxies, by a factor of two (BDT07) to five (DLB07). The model of BDT07, thanks to the more efficient feedback, produces stellar and gas metallicities in better agreement with observations and correctly predicts the slope of the red sequence in colour-magnitude diagrams. The model of DLB07 predicts a rather flat distribution of red galaxies, which might be due to the high metallicities predicted for dwarf galaxies. However, globally the model of DLB07 predicts galaxy colours that reproduce the bimodality seen in observations (Baldry et al. 2004; Baldry et al. 2006) somewhat better. For this reason, in this work we will present results for the model of DLB07. However, we note that all results described in the following Sections are qualitatively unchanged for the model of BDT07.
The Munich semi-analytic models of galaxy formation (DLB07 and BDT07) are an ideal instrument for investigating the origin of interstellar stars. The substructures of dark matter haloes can be identified by the algorithm SUBFIND (Springel et al., 2001). As a consequence, galaxies in clusters can be of three different types: central galaxies, satellites of “type 1” and satellites of “type 2”. Satellites of type 1 are associated with dark matter substructures, which usually are recently-merged haloes. Satellites of type 2 are instead galaxies whose dark matter halo has completely merged with a bigger halo and are not associated with a substructure. In the models, only type 2 galaxies merge with the halo central galaxy, after a dynamical timescale. In this work, we include galaxy disruption in the DLB07 model a posteriori and investigate its effects at . To do this, we assume that type 2 galaxies have been completely stripped of their stars and that these stars represent the population of intracluster stars that produces the ICL. Type 2 galaxies therefore do not contribute to galaxy counts. These assumptions are motivated by the fact that type 2 galaxies in the simulation usually fall into a larger structure at and are not associated with a dark matter substructure. This implies that they have had enough time to experience a number of low and high speed encounters with other galaxies during their lifetime, and that most of their stars might have been stripped away when their associated dark matter substructure was disrupted.
The definition of galaxy type that we adopt is dependent on the resolution of the dark matter simulation. An increase in resolution would in principle mean that type 1 haloes survive longer before being disrupted. In addition, disruption is a gradual process and one might expect most type 1 galaxies to be partially stripped, while some type 2 galaxies retain a compact core. We considered implementing partial disruption, but decided against it mainly because it would introduce extra parameters into the model without significantly improving the quality of the results. Our model should be regarded as a qualitative indicator of the importance of disruption rather than a detailed physical model of these processes.
Although this simple model allows us to investigate the effect of galaxy disruption on the abundance of dwarfs, it does not implement the disruption self-consistently within the semi-analytic model. Since we apply our assumption a posteriori, we do not modify the evolution of type 2 galaxies at . Instead, we consider as disrupted only type 2 galaxies that have have not yet merged at . Our assumption of complete galaxy disruption, if consistently implemented, would eliminate merging from the model, because in the Munich semi-analytic model only type 2 galaxies can merge with central galaxies. A self-consistent treatment of disruption could for example include partial disruption of the merging galaxies, as assumed by Monaco et al. (2006), or follow the forces acting on satellites, to define a disruption radius, outside which the galaxy mass will be lost (Bullock et al. 2001; Taylor & Babul 2001; Benson et al. 2002). We leave this study for future work.
Throughout the rest of this paper, we refer to the original model of DLB07 as the “canonical” model, and the equivalent model including destruction of type 2 galaxies as the “disruption” model.
3 Results
In this Section we present our results for the colour-magnitude diagram (Subsection 3.1) and for the galaxy luminosity function in -band (Subsection 3.2). Finally, Subsection 3.3 shows our predictions for the fraction of interstellar light produced by disrupted galaxies.
3.1 The colour-magnitude diagram
Colour-magnitude diagrams indicate the existence of two distinct populations of galaxies, namely a population of blue, star-forming galaxies and a population of red galaxies with no significant star formation activity.
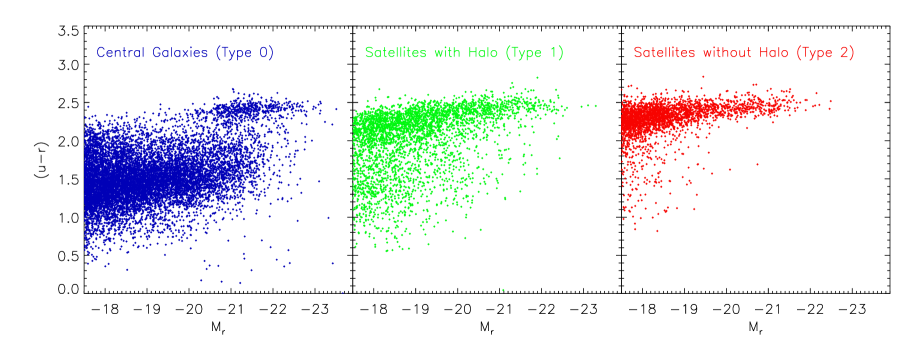
Fig. 1 shows the colour distribution of galaxies of different types in the canonical model, as a function of . The faint reddest galaxies (in red, top panel) are predominantly type 2 galaxies. Their colour and the amount of light produced by their stars agree well with the observed properties of the ICL. Type 1 galaxies have somewhat bluer colours than type 2 galaxies, because they might not have yet exhausted their reservoir of gas and may still be forming stars. However, as can be seen in the bottom panel of Fig. 1, a large fraction of type 1 galaxies accumulates along the red sequence, once their reservoir of gas is extinguished. Most central galaxies are blue (in blue, bottom panel), because they can continually accrete gas and form stars. The exceptions are very massive galaxies, in which star formation is suppressed by AGN feedback (Croton et al. 2006; Bower et al. 2006) and a significant fraction of dwarf galaxies. These last ones mostly form in haloes with less than about 100 dark matter particles, for which the resolution of the Millennium simulation is insufficient to properly account for gas accretion and merging.
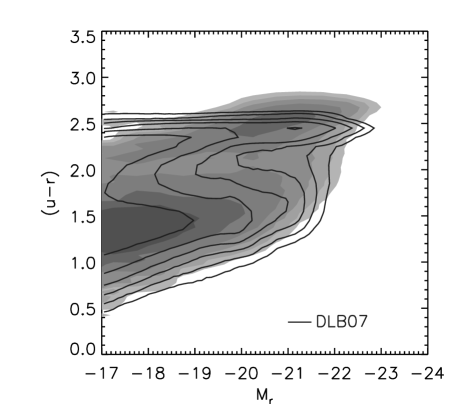

In Fig. 2 we directly compare the colour-magnitude distribution for the canonical model (top panel) and for the disruption model (bottom panel) with the observed distribution in of Baldry et al. (2006). The blue population is modelled with a sufficient degree of accuracy. On the other hand, the red population considerably differs from the observed one. Firstly, the colour of bright, red galaxies is underestimated by about 0.2 magnitudes. This is likely due to the underestimate of the metallicity of massive galaxies in the DLB07 model, as shown by BDT07. In fact, both the BDT07 model and that of Bower et al. (2006) do predict higher metallicities and redder colours for the brightest galaxies. This may also explain the flat distribution for the population of red galaxies in the top panel of Fig. 2, in contrast with the sloping behaviour seen in observations (Baldry et al. 2004; Baldry et al. 2006) and predicted by other models (Bower et al. 2006; BDT07).
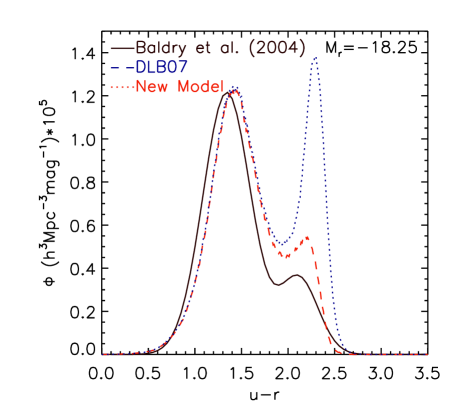
A more serious problem, however, is that the canonical model vastly over-predicts the abundance of faint red galaxies. The disruption model, whilst obviously not completely solving the problem, does produce a distribution of red galaxies with a distinct red peak at and a decreasing rather than flat distribution towards fainter magnitudes. This can be seen in Fig. 3, where the colour distribution of galaxies with absolute magnitudes in the range , for the canonical and the disruption models, are compared to the observational data of Baldry et al. (2004). In this magnitude bin, the disruption model predicts a considerably smaller number of red galaxies, in better agreement with the observations. This is because the reddest dwarf galaxies are type 2 galaxies, which we assume become disrupted once their dark matter substructure has been lost. This clearly indicates that galaxy disruption might play a role in shaping the faint side of colour-magnitude distributions.
The DLB07 model that we are using here predicts too small a fraction of red galaxies in low-density environments (see e.g. Baldry et al., 2006, figure 15). Our model preferentially disrupts red galaxies in clusters and so does not help to correct this deficiency: in fact, the predicted red fractions are reduced slightly from those shown in Baldry et al. (2006). On the other hand, the Bower et al. (2006) model has a higher red fraction that provides a better fit to the data.
3.2 Luminosity functions
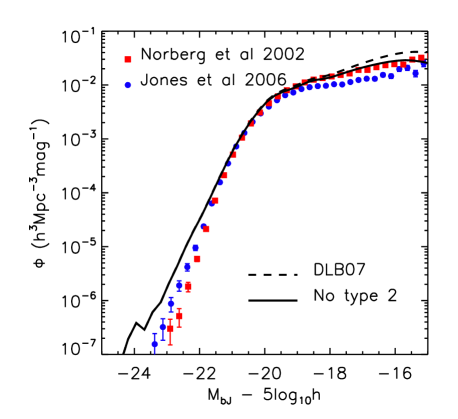
In this Subsection we investigate the effect of disruption on the abundance of galaxies, and in particular on the luminosity function in the photometric band at . Fig. 4 shows the luminosity functions for the canonical and disruption models (dashed and solid lines respectively). The data points reproduce the observational results of the 2 degree Field Galaxy Redshift Survey (2dFGRS, Norberg et al. 2002) and of the 6 degree Field Galaxy Survey (6dFGS, Jones et al. 2006). The disruption of satellite galaxies strongly affects the faint end of the luminosity function, changing the slope from positive to negative, and giving better agreement with the observations than does the canonical model.
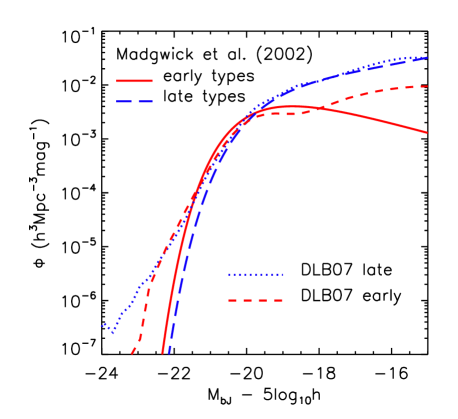
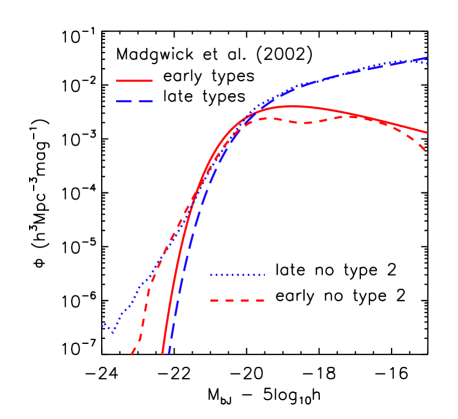
The disagreement between the model predictions for the number density of faint galaxies and observations has been identified in the past. Croton et al. (2006) showed that this is mainly due to an excess of early-type, red galaxies. The top panel of Fig. 5 illustrates this discordance. The long-dashed and the solid lines in both panels of Fig. 5 show the luminosity functions of late- and early-type galaxies respectively for the 2dFGRS data (Madgwick et al., 2002). The dotted and dashed lines show the predictions for late- and early-type galaxies respectively for the DLB07 model. The populations of late (blue) and early (red) galaxies are defined as a function of colour, late galaxies having and early galaxies , respectively. The lower panel of Fig. 5 shows the effect of disrupting type 2 galaxies. Whilst the luminosity function of late type galaxies is hardly affected, the reduction in the number density of faint early type galaxies is dramatic (more than an order of magnitude) and brings the model into much closer agreement with the observations. The luminosity function of early type galaxies shows a dip at . However, this dip can also be seen in the luminosity function for the canonical model and is not caused by galaxy disruption.
3.3 Contribution to the ICL
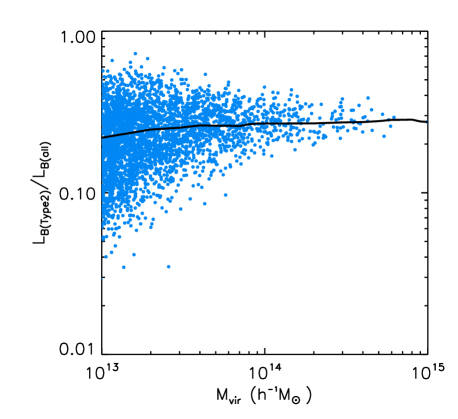
Despite of the uncertainty related to the difficulty in detecting very faint sources, observations suggest that diffuse intracluster stars contribute a substantial fraction of the optical light emitted by clusters and rich groups. In massive clusters, between 10 and 50 per cent of the optical luminosity is estimated to be diffuse ICL. In Fig. 6 we show our results for the fraction of band luminosity contributed by type 2 galaxies, compared to the total luminosity of a cluster, which is the sum of the luminosities of all the galaxies in the cluster, including type 2 galaxies. Results are presented for groups and clusters with . Although there is considerable scatter in the distribution, our estimated fractions fall well within the observed range (Bernstein et al. 1995; Gonzalez et al. 2000; Feldmeier et al. 2002; Feldmeier et al. 2004; Gonzalez et al. 2005; Zibetti et al. 2005), and agree with the predictions of other semi-analytic models where galaxy disruption is implemented self-consistently (Purcell et al., 2007). We find that the median luminosity of type 2 galaxies accounts for about 20 per cent of the total luminosity for haloes with , increasing to about per cent in haloes with . This is strong evidence that disruption of dwarf galaxies is not only helpful in reducing the number density of faint red galaxies but is actually required by the observations, as there is no other plausible mechanism for generating the ICL.
4 Conclusions
In this paper, we have considered the possibility that dwarf galaxies may become disrupted when subjected to gravitational tidal forces and repeated galaxy encounters within clusters and rich galaxy groups. For this purpose, we have introduced an ad hoc prescription for the disruption of galaxies in our analysis of galaxy catalogues produced by semi-analytic models of galaxy formation. Our simple prescription considers the stability of substructure within dark matter haloes. The merger trees produced by the algorithm SUBFIND (Springel et al., 2001) can identify dark matter sub-haloes within a larger structure until they are completely disrupted. We make the simple assumption that galaxies whose haloes have been disrupted will themselves disperse, while their stars become part of the population of intracluster stars responsible for the observed intracluster light.
Despite the simplicity of this assumption, our results show a substantial improvement over previous models and indicate that the inclusion of galaxy disruption is indeed a necessary ingredient of galaxy formation models. Our main results can be summarised as follows:
-
•
it suppresses the number of red dwarf galaxies, improving the model predictions for the faint end of the galaxy luminosity function in -band;
-
•
correspondingly, it suppresses the number density of the faint, reddest galaxies in colour-magnitude diagrams;
-
•
it predicts values for the fraction and colour of intracluster light in good agreement with observational estimates for clusters and rich galaxy groups.
Our prescription to model the ICL, implemented a posteriori in the publicly available galaxy catalogue of DLB07, assumes that all type 2 galaxies that have survived merging until are disrupted and contribute their stars to the population of intracluster stars. By doing this, the evolution of type 2 galaxies at is not affected.
Although the simplicity of our model is to be valued, the assumption that halo disruption leads to galaxy disruption is very simplistic. Hydrodynamical simulations (Moore et al. 1996; Napolitano et al. 2003; Murante et al. 2004; Willman et al. 2004; Sommer-Larsen et al. 2005; Monaco et al. 2006; Murante et al. 2007) suggest that tidal stripping of stars from the outer regions of a galaxy is a gradual process that takes several passages of the galaxy through the cluster core and that can be enhanced by previous galaxy encounters in groups. Furthermore, a galaxy infalling into a cluster might not be completely disrupted, but might conserve its densest core intact, as the existence of UCD galaxies seem to suggest.
A natural extension of the results presented here would be to introduce the halo disruption self-consistently within the semi-analytic model, as Monaco et al. (2006) have done. This would have several effects, the main ones being to limit the growth of central galaxies and to affect the abundance of dwarf galaxies. We intend to follow this up in future work.
Acknowledgements
We would like to thank Ivan Baldry for supplying us with the observational data for Fig. 2. BMH would also like to thank Jon Loveday for the support and supervision through the build–up of this paper. Many thanks to Gerard Lemson for setting up the GAVO Millennium database and for his continuous efforts on its development and outreach. BMH thanks the Portuguese Science and Technology Foundation (FCT) for financial support through an International Ph.D. fellowship (grant number SFRH/BD/21497/2005). SB and PAT are supported by STFC. The Millennium simulation was carried out by the Virgo Consortium at the Max Planck Society in Garching. Data on the galaxy population produced by this model, as well as on the parent halo population, are publicly available at http://www.mpa-garching.mpg.de/millennium/.
References
- Arnaboldi et al. (1996) Arnaboldi M., Freeman K. C., Mendez R. H., Capaccioli M., Ciardullo R., Ford H., Gerhard O., Hui X., Jacoby G. H., Kudritzki R. P., Quinn P. J., 1996, ApJ, 472, 145
- Arnaboldi et al. (2004) Arnaboldi M., Gerhard O., Aguerri J. A. L., Freeman K. C., Napolitano N. R., Okamura S., Yasuda N., 2004, ApJL, 614, 33
- Baldry et al. (2006) Baldry I. K., Balogh M. L., Bower R. G., Glazebrook K., Nichol R. C., Bamford S. P., Budavari T., 2006, MNRAS, 373, 469
- Baldry et al. (2004) Baldry I. K., Glazebrook K., Brinkmann J., Ivezić Ž., Lupton R. H., Nichol R. C., Szalay A. S., 2004, ApJ, 600, 681
- Benson et al. (2002) Benson A. J., Lacey C. G., Baugh C. M., Cole S., Frenk C. S., 2002, MNRAS, 333, 156
- Bernstein et al. (1995) Bernstein G. M., Nichol R. C., Tyson J. A., Ulmer M. P., Wittman D., 1995, AJ, 110, 1507
- Bertone et al. (2007) Bertone S., De Lucia G., Thomas P. A., 2007, MNRAS, 379, 1143 (BDT07)
- Bertone et al. (2005) Bertone S., Stoehr F., White S. D. M., 2005, MNRAS, 359, 1201
- Bower et al. (2006) Bower R. G., Benson A. J., Malbon R., Helly J. C., Frenk C. S., Baugh C. M., Cole S., Lacey C. G., 2006, MNRAS, 370, 645
- Bullock et al. (2001) Bullock J. S., Kravtsov A. V., Weinberg D. H., 2001, ApJ, 548, 33
- Calcáneo-Roldán et al. (2000) Calcáneo-Roldán C., Moore B., Bland-Hawthorn J., Malin D., Sadler E. M., 2000, MNRAS, 314, 324
- Conroy et al. (2007) Conroy C., Wechsler R. H., Kravtsov A. V., 2007, arXiv:astro-ph/0703374
- Croton et al. (2006) Croton D. J., Springel V., White S. D. M., De Lucia G., Frenk C. S., Gao L., Jenkins A., Kauffmann G., Navarro J. F., Yoshida N., 2006, MNRAS, 365, 11
- De Lucia & Blaizot (2007) De Lucia G., Blaizot J., 2007, MNRAS, 375, 2 (DLB07)
- Drinkwater et al. (2000) Drinkwater M. J., Jones J. B., Gregg M. D., Phillipps S., 2000, PASP, 17, 227
- Durrell et al. (2002) Durrell P. R., Ciardullo R., Feldmeier J. J., Jacoby G. H., Sigurdsson S., 2002, ApJ, 570, 119
- Faltenbacher & Mathews (2005) Faltenbacher A., Mathews W. G., 2005, MNRAS, 362, 498
- Feldmeier et al. (2003) Feldmeier J. J., Ciardullo R., Jacoby G. H., Durrell P. R., 2003, ApJS, 145, 65
- Feldmeier et al. (2004) Feldmeier J. J., Ciardullo R., Jacoby G. H., Durrell P. R., 2004, ApJ, 615, 196
- Feldmeier et al. (2004) Feldmeier J. J., Mihos J. C., Morrison H. L., Harding P., Kaib N., Dubinski J., 2004, ApJ, 609, 617
- Feldmeier et al. (2002) Feldmeier J. J., Mihos J. C., Morrison H. L., Rodney S. A., Harding P., 2002, ApJ, 575, 779
- Gal-Yam et al. (2003) Gal-Yam A., Maoz D., Guhathakurta P., Filippenko A. V., 2003, AJ, 125, 1087
- Gnedin (2003) Gnedin O. Y., 2003, ApJ, 589, 752
- Gonzalez et al. (2005) Gonzalez A. H., Zabludoff A. I., Zaritsky D., 2005, ApJ, 618, 195
- Gonzalez et al. (2000) Gonzalez A. H., Zabludoff A. I., Zaritsky D., Dalcanton J. J., 2000, ApJ, 536, 561
- Gregg & West (1998) Gregg M. D., West M. J., 1998, Nature, 396, 549
- Hilker et al. (2007) Hilker M., Baumgardt H., Infante L., Drinkwater M., Evstigneeva E., Gregg M., 2007, A&A, 463, 119
- Hilker et al. (1999) Hilker M., Infante L., Vieira G., Kissler-Patig M., Richtler T., 1999, A&AS, 134, 75
- Jones et al. (2006) Jones D. H., Peterson B. A., Colless M., Saunders W., 2006, MNRAS, 369, 25
- Krick et al. (2006) Krick J. E., Bernstein R. A., Pimbblet K. A., 2006, ApJ, 131, 168
- Madgwick et al. (2002) Madgwick D. S., et al., 2002, MNRAS, 333, 133
- Merritt (1984) Merritt D., 1984, ApJ, 276, 26
- Mihos (2004) Mihos J. C., 2004, in Duc P.-A., Braine J., Brinks E., eds, Recycling Intergalactic and Interstellar Matter Vol. 217 of IAU Symposium. p. 390
- Monaco et al. (2006) Monaco P., Murante G., Borgani S., Fontanot F., 2006, ApJL, 652, 89
- Moore et al. (1996) Moore B., Katz N., Lake G., Dressler A., Oemler A., 1996, Nature, 379, 613
- Murante et al. (2004) Murante G., Arnaboldi M., Gerhard O., Borgani S., Cheng L. M., Diaferio A., Dolag K., Moscardini L., Tormen G., Tornatore L., Tozzi P., 2004, ApJL, 607, L83
- Murante et al. (2007) Murante G., Giovalli M., Gerhard O., Arnaboldi M., Borgani S., Dolag K., 2007, MNRAS, 377, 2
- Napolitano et al. (2003) Napolitano N. R., Pannella M., Arnaboldi M., Gerhard O., Aguerri J. A. L., Freeman K. C., Capaccioli M., Ghigna S., Governato F., Quinn T., Stadel J., 2003, ApJ, 594, 172
- Neill et al. (2005) Neill J. D., Shara M. M., Oegerle W. R., 2005, ApJ, 618, 692
- Norberg et al. (2002) Norberg P., et al., 2002, MNRAS, 336, 907
- Purcell et al. (2007) Purcell C. W., Bullock J. S., Zentner A. R., 2007, ApJ, 666, 20
- Richstone (1976) Richstone D. O., 1976, ApJ, 204, 642
- Rudick et al. (2006) Rudick C. S., Mihos J. C., McBride C., 2006, ApJ, 648, 936
- Sommer-Larsen et al. (2005) Sommer-Larsen J., Romeo A. D., Portinari L., 2005, MNRAS, 357, 478
- Springel et al. (2005) Springel V., et al., 2005, Nature, 435, 629
- Springel et al. (2001) Springel V., White S. D. M., Tormen G., Kauffmann G., 2001, MNRAS, 328, 726
- Taylor & Babul (2001) Taylor J. E., Babul A., 2001, ApJ, 559, 716
- Trentham & Mobasher (1998) Trentham N., Mobasher B., 1998, MNRAS, 293, 53
- Willman et al. (2004) Willman B., Governato F., Wadsley J., Quinn T., 2004, MNRAS, 355, 159
- Zibetti & White (2004) Zibetti S., White S. D. M., 2004, in Diaferio A., ed., IAU Colloq. 195: Outskirts of Galaxy Clusters: Intense Life in the Suburbs pp 226–230
- Zibetti et al. (2005) Zibetti S., White S. D. M., Schneider D. P., Brinkmann J., 2005, MNRAS, 358, 949
- Zwicky (1951) Zwicky F., 1951, PASP, 63, 61