DESY 07-092
June 2007
High- dijet photoproduction at HERA
Abstract
The cross section for high- dijet production in photoproduction has been measured with the ZEUS detector at HERA using an integrated luminosity of pb-1. The events were required to have a virtuality of the incoming photon, , of less than GeV2 and a photon-proton center-of-mass energy in the range GeV. Events were selected if at least two jets satisfied the transverse-energy requirements of GeV and GeV and pseudorapidity (with respect to the proton beam direction) requirements of , with at least one of the jets satisfying . The measurements show sensitivity to the parton distributions in the photon and proton and to effects beyond next-to-leading order in QCD. Hence these data can be used to constrain further the parton densities in the proton and photon.
The ZEUS Collaboration
S. Chekanov1,
M. Derrick,
S. Magill,
B. Musgrave,
D. Nicholass2,
J. Repond,
R. Yoshida
Argonne National Laboratory, Argonne, Illinois 60439-4815, USA n
M.C.K. Mattingly
Andrews University, Berrien Springs, Michigan 49104-0380, USA
M. Jechow, N. Pavel †, A.G. Yagües Molina
Institut für Physik der Humboldt-Universität zu Berlin,
Berlin, Germany
S. Antonelli, P. Antonioli,
G. Bari,
M. Basile,
L. Bellagamba,
M. Bindi,
D. Boscherini,
A. Bruni,
G. Bruni,
L. Cifarelli,
F. Cindolo,
A. Contin,
M. Corradi,
S. De Pasquale,
G. Iacobucci,
A. Margotti,
R. Nania,
A. Polini,
G. Sartorelli,
A. Zichichi
University and INFN Bologna, Bologna, Italy e
D. Bartsch,
I. Brock,
S. Goers3,
H. Hartmann,
E. Hilger,
H.-P. Jakob,
M. Jüngst,
O.M. Kind4,
A.E. Nuncio-Quiroz,
E. Paul5,
R. Renner6,
U. Samson,
V. Schönberg,
R. Shehzadi,
M. Wlasenko
Physikalisches Institut der Universität Bonn,
Bonn, Germany b
N.H. Brook,
G.P. Heath,
J.D. Morris
H.H. Wills Physics Laboratory, University of Bristol,
Bristol, United Kingdom m
M. Capua,
S. Fazio,
A. Mastroberardino,
M. Schioppa,
G. Susinno,
E. Tassi
Calabria University,
Physics Department and INFN, Cosenza, Italy e
J.Y. Kim7,
K.J. Ma8
Chonnam National University, Kwangju, South Korea g
Z.A. Ibrahim,
B. Kamaluddin,
W.A.T. Wan Abdullah
Jabatan Fizik, Universiti Malaya, 50603 Kuala Lumpur, Malaysia r
Y. Ning,
Z. Ren,
F. Sciulli
Nevis Laboratories, Columbia University, Irvington on Hudson,
New York 10027 o
J. Chwastowski,
A. Eskreys,
J. Figiel,
A. Galas,
M. Gil,
K. Olkiewicz,
P. Stopa,
L. Zawiejski
The Henryk Niewodniczanski Institute of Nuclear Physics, Polish Academy of Sciences, Cracow,
Poland i
L. Adamczyk,
T. Bołd,
I. Grabowska-Bołd,
D. Kisielewska,
J. Łukasik,
M. Przybycień,
L. Suszycki
Faculty of Physics and Applied Computer Science,
AGH-University of Science and Technology, Cracow, Poland p
A. Kotański9,
W. Słomiński10
Department of Physics, Jagellonian University, Cracow, Poland
V. Adler11,
U. Behrens,
I. Bloch,
C. Blohm,
A. Bonato,
K. Borras,
R. Ciesielski,
N. Coppola,
A. Dossanov,
V. Drugakov,
J. Fourletova,
A. Geiser,
D. Gladkov,
P. Göttlicher12,
J. Grebenyuk,
I. Gregor,
T. Haas,
W. Hain,
C. Horn13,
A. Hüttmann,
B. Kahle,
I.I. Katkov,
U. Klein14,
U. Kötz,
H. Kowalski,
E. Lobodzinska,
B. Löhr,
R. Mankel,
I.-A. Melzer-Pellmann,
S. Miglioranzi,
A. Montanari,
T. Namsoo,
D. Notz,
L. Rinaldi,
P. Roloff,
I. Rubinsky,
R. Santamarta,
U. Schneekloth,
A. Spiridonov15,
H. Stadie,
D. Szuba16,
J. Szuba17,
T. Theedt,
G. Wolf,
K. Wrona,
C. Youngman,
W. Zeuner
Deutsches Elektronen-Synchrotron DESY, Hamburg, Germany
W. Lohmann, S. Schlenstedt
Deutsches Elektronen-Synchrotron DESY, Zeuthen, Germany
G. Barbagli,
E. Gallo,
P. G. Pelfer
University and INFN, Florence, Italy e
A. Bamberger,
D. Dobur,
F. Karstens,
N.N. Vlasov18
Fakultät für Physik der Universität Freiburg i.Br.,
Freiburg i.Br., Germany b
P.J. Bussey,
A.T. Doyle,
W. Dunne,
J. Ferrando,
M. Forrest,
D.H. Saxon,
I.O. Skillicorn
Department of Physics and Astronomy, University of Glasgow,
Glasgow, United Kingdom m
I. Gialas19,
K. Papageorgiu
Department of Engineering in Management and Finance, Univ. of
Aegean, Greece
T. Gosau,
U. Holm,
R. Klanner,
E. Lohrmann,
H. Perrey,
H. Salehi,
P. Schleper,
T. Schörner-Sadenius,
J. Sztuk,
K. Wichmann,
K. Wick
Hamburg University, Institute of Exp. Physics, Hamburg,
Germany b
C. Foudas,
C. Fry,
K.R. Long,
A.D. Tapper
Imperial College London, High Energy Nuclear Physics Group,
London, United Kingdom m
M. Kataoka20,
T. Matsumoto,
K. Nagano,
K. Tokushuku21,
S. Yamada,
Y. Yamazaki
Institute of Particle and Nuclear Studies, KEK,
Tsukuba, Japan f
A.N. Barakbaev,
E.G. Boos,
N.S. Pokrovskiy,
B.O. Zhautykov
Institute of Physics and Technology of Ministry of Education and
Science of Kazakhstan, Almaty, Kazakhstan
V. Aushev1
Institute for Nuclear Research, National Academy of Sciences, Kiev
and Kiev National University, Kiev, Ukraine
D. Son
Kyungpook National University, Center for High Energy Physics, Daegu,
South Korea g
J. de Favereau,
K. Piotrzkowski
Institut de Physique Nucléaire, Université Catholique de
Louvain, Louvain-la-Neuve, Belgium q
F. Barreiro,
C. Glasman22,
M. Jimenez,
L. Labarga,
J. del Peso,
E. Ron,
M. Soares,
J. Terrón,
M. Zambrana
Departamento de Física Teórica, Universidad Autónoma
de Madrid, Madrid, Spain l
F. Corriveau,
C. Liu,
R. Walsh,
C. Zhou
Department of Physics, McGill University,
Montréal, Québec, Canada H3A 2T8 a
T. Tsurugai
Meiji Gakuin University, Faculty of General Education,
Yokohama, Japan f
A. Antonov,
B.A. Dolgoshein,
V. Sosnovtsev,
A. Stifutkin,
S. Suchkov
Moscow Engineering Physics Institute, Moscow, Russia j
R.K. Dementiev,
P.F. Ermolov,
L.K. Gladilin,
L.A. Khein,
I.A. Korzhavina,
V.A. Kuzmin,
B.B. Levchenko23,
O.Yu. Lukina,
A.S. Proskuryakov,
L.M. Shcheglova,
D.S. Zotkin,
S.A. Zotkin
Moscow State University, Institute of Nuclear Physics,
Moscow, Russia k
I. Abt,
C. Büttner,
A. Caldwell,
D. Kollar,
W.B. Schmidke,
J. Sutiak
Max-Planck-Institut für Physik, München, Germany
G. Grigorescu,
A. Keramidas,
E. Koffeman,
P. Kooijman,
A. Pellegrino,
H. Tiecke,
M. Vázquez20,
L. Wiggers
NIKHEF and University of Amsterdam, Amsterdam, Netherlands h
N. Brümmer,
B. Bylsma,
L.S. Durkin,
A. Lee,
T.Y. Ling
Physics Department, Ohio State University,
Columbus, Ohio 43210 n
P.D. Allfrey,
M.A. Bell, A.M. Cooper-Sarkar,
A. Cottrell,
R.C.E. Devenish,
B. Foster,
K. Korcsak-Gorzo,
S. Patel,
V. Roberfroid24,
A. Robertson,
P.B. Straub,
C. Uribe-Estrada,
R. Walczak
Department of Physics, University of Oxford,
Oxford United Kingdom m
P. Bellan,
A. Bertolin, R. Brugnera,
R. Carlin,
F. Dal Corso,
S. Dusini,
A. Garfagnini,
S. Limentani,
A. Longhin,
L. Stanco,
M. Turcato
Dipartimento di Fisica dell’ Università and INFN,
Padova, Italy e
B.Y. Oh,
A. Raval,
J. Ukleja25,
J.J. Whitmore26
Department of Physics, Pennsylvania State University,
University Park, Pennsylvania 16802 o
Y. Iga
Polytechnic University, Sagamihara, Japan f
G. D’Agostini,
G. Marini,
A. Nigro
Dipartimento di Fisica, Università ’La Sapienza’ and INFN,
Rome, Italy
J.E. Cole,
J.C. Hart
Rutherford Appleton Laboratory, Chilton, Didcot, Oxon,
United Kingdom m
H. Abramowicz27,
A. Gabareen,
R. Ingbir,
S. Kananov,
A. Levy
Raymond and Beverly Sackler Faculty of Exact Sciences,
School of Physics, Tel-Aviv University, Tel-Aviv, Israel d
M. Kuze,
J. Maeda
Department of Physics, Tokyo Institute of Technology,
Tokyo, Japan f
R. Hori,
S. Kagawa28,
N. Okazaki,
S. Shimizu,
T. Tawara
Department of Physics, University of Tokyo,
Tokyo, Japan f
R. Hamatsu,
H. Kaji29,
S. Kitamura30,
O. Ota,
Y.D. Ri
Tokyo Metropolitan University, Department of Physics,
Tokyo, Japan f
M.I. Ferrero,
V. Monaco,
R. Sacchi,
A. Solano
Università di Torino and INFN, Torino, Italy e
M. Arneodo,
M. Ruspa
Università del Piemonte Orientale, Novara, and INFN, Torino,
Italy e
S. Fourletov,
J.F. Martin
Department of Physics, University of Toronto, Toronto, Ontario,
Canada M5S 1A7 a
S.K. Boutle19,
J.M. Butterworth,
C. Gwenlan31,
T.W. Jones,
J.H. Loizides,
M.R. Sutton31,
C. Targett-Adams,
M. Wing
Physics and Astronomy Department, University College London,
London, United Kingdom m
B. Brzozowska,
J. Ciborowski32,
G. Grzelak,
P. Kulinski,
P. Łużniak33,
J. Malka33,
R.J. Nowak,
J.M. Pawlak,
T. Tymieniecka,
A. Ukleja,
A.F. Żarnecki
Warsaw University, Institute of Experimental Physics,
Warsaw, Poland
M. Adamus,
P. Plucinski34
Institute for Nuclear Studies, Warsaw, Poland
Y. Eisenberg,
I. Giller,
D. Hochman,
U. Karshon,
M. Rosin
Department of Particle Physics, Weizmann Institute, Rehovot,
Israel c
E. Brownson,
T. Danielson,
A. Everett,
D. Kçira,
D.D. Reeder5,
P. Ryan,
A.A. Savin,
W.H. Smith,
H. Wolfe
Department of Physics, University of Wisconsin, Madison,
Wisconsin 53706, USA n
S. Bhadra,
C.D. Catterall,
Y. Cui,
G. Hartner,
S. Menary,
U. Noor,
J. Standage,
J. Whyte
Department of Physics, York University, Ontario, Canada M3J
1P3 a
1 supported by DESY, Germany
2 also affiliated with University College London, UK
3 now with TÜV Nord, Germany
4 now at Humboldt University, Berlin, Germany
5 retired
6 self-employed
7 supported by Chonnam National University in 2005
8 supported by a scholarship of the World Laboratory
Björn Wiik Research Project
9 supported by the research grant no. 1 P03B 04529 (2005-2008)
10 This work was supported in part by the Marie Curie Actions Transfer of Knowledge
project COCOS (contract MTKD-CT-2004-517186)
11 now at Univ. Libre de Bruxelles, Belgium
12 now at DESY group FEB, Hamburg, Germany
13 now at Stanford Linear Accelerator Center, Stanford, USA
14 now at University of Liverpool, UK
15 also at Institut of Theoretical and Experimental
Physics, Moscow, Russia
16 also at INP, Cracow, Poland
17 on leave of absence from FPACS, AGH-UST, Cracow, Poland
18 partly supported by Moscow State University, Russia
19 also affiliated with DESY
20 now at CERN, Geneva, Switzerland
21 also at University of Tokyo, Japan
22 Ramón y Cajal Fellow
23 partly supported by Russian Foundation for Basic
Research grant no. 05-02-39028-NSFC-a
24 EU Marie Curie Fellow
25 partially supported by Warsaw University, Poland
26 This material was based on work supported by the
National Science Foundation, while working at the Foundation.
27 also at Max Planck Institute, Munich, Germany, Alexander von Humboldt
Research Award
28 now at KEK, Tsukuba, Japan
29 now at Nagoya University, Japan
30 Department of Radiological Science
31 PPARC Advanced fellow
32 also at Łódź University, Poland
33 Łódź University, Poland
34 supported by the Polish Ministry for Education and
Science grant no. 1 P03B 14129
† deceased
a
supported by the Natural Sciences and Engineering Research Council of Canada (NSERC)
b
supported by the German Federal Ministry for Education and Research (BMBF), under
contract numbers HZ1GUA 2, HZ1GUB 0, HZ1PDA 5, HZ1VFA 5
c
supported in part by the MINERVA Gesellschaft für Forschung GmbH, the Israel Science
Foundation (grant no. 293/02-11.2) and the U.S.-Israel Binational Science Foundation
d
supported by the German-Israeli Foundation and the Israel Science Foundation
e
supported by the Italian National Institute for Nuclear Physics (INFN)
f
supported by the Japanese Ministry of Education, Culture, Sports, Science and Technology
(MEXT) and its grants for Scientific Research
g
supported by the Korean Ministry of Education and Korea Science and Engineering
Foundation
h
supported by the Netherlands Foundation for Research on Matter (FOM)
i
supported by the Polish State Committee for Scientific Research, grant no.
620/E-77/SPB/DESY/P-03/DZ 117/2003-2005 and grant no. 1P03B07427/2004-2006
j
partially supported by the German Federal Ministry for Education and Research (BMBF)
k
supported by RF Presidential grant N 8122.2006.2 for the leading
scientific schools and by the Russian Ministry of Education and Science through its grant
Research on High Energy Physics
l
supported by the Spanish Ministry of Education and Science through funds provided by
CICYT
m
supported by the Particle Physics and Astronomy Research Council, UK
n
supported by the US Department of Energy
o
supported by the US National Science Foundation. Any opinion,
findings and conclusions or recommendations expressed in this material
are those of the authors and do not necessarily reflect the views of the
National Science Foundation.
p
supported by the Polish Ministry of Science and Higher Education
as a scientific project (2006-2008)
q
supported by FNRS and its associated funds (IISN and FRIA) and by an Inter-University
Attraction Poles Programme subsidised by the Belgian Federal Science Policy Office
r
supported by the Malaysian Ministry of Science, Technology and
Innovation/Akademi Sains Malaysia grant SAGA 66-02-03-0048
1 Introduction
In photoproduction at HERA, a quasi-real photon emitted from the incoming positron111In the following, the term “positron” denotes generically both the electron () and positron (). Unless explicitly stated, positron will be the term used to describe both particles. collides with a parton from the incoming proton. The photoproduction of jets can be classified into two types of processes in leading-order (LO) Quantum Chromodynamics (QCD). In direct processes, the photon participates in the hard scatter via either boson-gluon fusion (see Fig. 1(a)) or QCD Compton scattering. The second class, resolved processes (see Fig. 1(b)), involves the photon acting as a source of quarks and gluons, with only a fraction of its momentum, , participating in the hard scatter. Measurements of jet cross sections in photoproduction [1, 2, 3, 4, 5, *pl:b348:665, *pl:b384:401, *pl:b443:394, *epj:c4:591, *epj:c11:35, *pl:b560:7, 12, *zfp:c70:17, *epj:c1:97, *pl:b483:36, *epj:c25:13, *epj:c29:497, *pl:b639:21] are sensitive to the structure of both the proton and the photon and thus provide input to global fits to determine their parton densities.
There are three objectives of the measurement reported in this paper. Firstly, the analysis was designed to provide constraints on the parton density functions (PDFs) of the photon. Over the last two years there has been active research in the area of fitting photon PDFs and a number of new parameterizations have become available [19, 20, 21]. In two of these [19, 20], fits were performed exclusively to photon structure function, , data; the other [21] also considered data from a previous dijet photoproduction analysis published by the ZEUS collaboration [4]. It is the purpose of this analysis to test the effectiveness of each parameterization at describing HERA photoproduction data. To this end, the present analysis was conducted at higher transverse energy relative to previous publications. It is expected that at these high transverse energies the predictions of next-to-leading-order (NLO) QCD calculations should describe the data well, have smaller uncertainties, and allow a more precise discrimination between the different parameterizations of the photon PDFs. The reduction in statistics associated with moving to higher transverse energies was in part compensated by the factor of two increase in luminosity, for this independent data sample, and the extension to higher pseudorapidity222The ZEUS coordinate system is a right-handed Cartesian system, with the axis pointing in the proton beam direction, referred to as the “forward direction”, and the axis pointing left towards the center of HERA. The coordinate origin is at the nominal interaction point. The pseudorapidity is defined as , where the polar angle, , is measured with respect to the proton beam direction. of the jet compared to the previous analysis [4].
Secondly, the present analysis was designed to provide constraints on the proton PDFs. Global fits to determine the proton PDFs continue to be a very active and important area of research. A common feature of these global fits is a large uncertainty in the gluon PDF for high values of , the fractional momentum at which partons inside the proton are probed. At such high values (), the gluon PDF is poorly constrained and so attempts were made for the present investigation to measure cross sections which show particular sensitivity to these uncertainties. Recently, the ZEUS collaboration included jet data into fits for the proton PDFs [22].
Finally, the difference in azimuthal angle of two jets was considered, as in previous measurements of charm and prompt photon photoproduction [23, 24]. In LO QCD, the cross section as a function of the azimuthal difference would simply be a delta function located at radians. However, the presence of higher-order effects leads to extra jets in the final state and in values less than radians. The cross section is therefore directly sensitive to higher-order topologies and provides a test of NLO QCD and of Monte Carlo (MC) models with different implementations of parton-cascade algorithms. The data for charm photoproduction [23] demonstrated the inadequacy of NLO QCD, particularly when the azimuthal angle difference was significantly different from and for a sample of events enriched in resolved-photon processes. To investigate this inadequacy in a more inclusive way and with higher precision, such distributions were also measured.
2 Definition of the cross section and variables
Within the framework of perturbative QCD, the dijet positron-proton cross section, , can be written as a convolution of the proton PDFs, , and photon PDFs, , with the partonic hard cross section, , as
| (1) |
where is the longitudinal momentum fraction of the almost-real photon emitted by the positron and the function is the flux of photons from the positron. The equation is a sum over all possible partons, and . In the case of the direct cross section, the photon PDF is replaced by a delta function at . The scales of the process are the renormalization, , and factorization scales, .
To probe the structure of the photon, it is desirable to measure cross sections as functions of variables that are sensitive to the incoming parton momentum spectrum, such as the momentum fraction, , at which partons inside the photon are probed. Since is not directly measurable, it is necessary to define [1] an observable, , which is the fraction of the photon momentum participating in the production of the two highest transverse-energy jets (and is equal to for partons in LO QCD), as:
| (2) |
where is the incident positron energy, and are the transverse energies and and the pseudorapidities of the two jets in the laboratory frame (). At LO (see Fig. 1), direct processes have , while resolved processes have .
For the proton, the observable is similarly defined [1] as
| (3) |
where is the incident proton energy. This observable is the fraction of the proton momentum participating in the production of the two highest-energy jets (and is equal to for partons in LO QCD).
Cross sections are presented as functions of , , , , and . The mean transverse energy of the two jets, , is given by
| (4) |
Similarly, the mean pseudorapidity of the two jets, , is given by
| (5) |
The absolute difference in azimuthal angle of the two jets, and , is given by
| (6) |
The kinematic region for this study is defined as GeV2, where and and are the energy and angle, respectively, of the scattered positron. The photon-proton center-of-mass energy, , is required to be in the range GeV to GeV. Each event is required to have at least two jets reconstructed with the cluster algorithm [25] in its longitudinally invariant inclusive mode [26], with at least one jet having transverse energy greater than GeV and another greater than GeV. The jets are required to satisfy with at least one jet lying in the range between and . The upper bound of 3 units represents an extension of the pseudorapidity range by units in the forward direction over the previous analysis [4], thereby increasing the sensitivity of the measurement to low- and high- processes. The cross sections for all distributions have been determined for regions enriched in direct- and resolved-photon processes by requiring to be greater than or less than , respectively.
One of the goals of the present investigation is to provide data that constrain the gluon PDF in the proton, which exhibits large uncertainties at values of . A study was performed [27] by considering the cross section in different kinematic regions, varying the cuts on the jet transverse energies and pseudorapidities as well as on . This allowed the determination of kinematic regions in which the cross section was large enough to be measured and in which the uncertainties on the cross section that arise due to those of the gluon PDF were largest. These cross sections will be referred to as “optimized” cross sections and are those which have the largest uncertainty from the gluon PDF; in total eight cross sections were measured (four direct enriched and four resolved enriched). The PDF sets chosen to conduct the optimization study were the ZEUS-S [28] and ZEUS-JETS [22] PDF sets. The kinematic regions of the cross sections are defined in Table 1, where the and requirements are as above.
3 Experimental conditions
The data were collected during the 1998-2000 running periods, where HERA operated with protons of energy GeV and electrons or positrons of energy GeV. During 1998 and the first half of 1999, a sample of electron data corresponding to an integrated luminosity of pb-1 was collected. The remaining data up to the year 2000 were taken using positrons and correspond to an integrated luminosity of pb-1. The results presented here are therefore based on a total integrated luminosity of pb-1. A detailed description of the ZEUS detector can be found elsewhere [29, 30]. A brief outline of the components that are most relevant for this analysis is given below.
Charged particles are tracked in the central tracking detector (CTD) [31, *npps:b32:181, *nim:a338:254], which operates in a magnetic field of provided by a thin superconducting coil. The CTD consists of 72 cylindrical drift chamber layers, organized in 9 superlayers covering the polar-angle region . The transverse-momentum resolution for full-length tracks is , with in GeV.
The high-resolution uranium–scintillator calorimeter (CAL) [34, *nim:a309:101, *nim:a321:356, *nim:a336:23] consists of three parts: the forward (FCAL), the barrel (BCAL) and the rear (RCAL) calorimeters. Each part is subdivided transversely into towers and longitudinally into one electromagnetic section (EMC) and either one (in RCAL) or two (in BCAL and FCAL) hadronic sections (HAC). The smallest subdivision of the calorimeter is called a cell. The CAL energy resolutions, as measured under test-beam conditions, are for electrons and for hadrons, with in GeV.
The luminosity was measured from the rate of the bremsstrahlung process , where the photon was measured in a lead–scintillator calorimeter [38, *zfp:c63:391, *acpp:b32:2025] placed in the HERA tunnel at .
4 Monte Carlo models
The acceptance and the effects of detector response were determined using samples of simulated events. The programs Herwig 6.505 [41, *cpc:67:465] and Pythia 6.221 [43, *cpc:82:74], which implement the leading-order matrix elements, followed by parton showers and hadronization, were used. The Herwig and Pythia generators differ in the details of the implementation of the leading-logarithmic parton-shower models and hence are also compared to the measured cross-section . The MC programs also use different hadronization models: Herwig uses the cluster model [45] and Pythia uses the Lund string model [46]. Direct and resolved events were generated separately. For the purposes of correction, the relative contribution of direct and resolved events was fitted to the data. For all generated events, the ZEUS detector response was simulated in detail using a program based on Geant 3.13 [47].
For both MC programs, the CTEQ5L [48] and GRV-LO [49, *pr:d46:1973] proton and photon PDFs, respectively, were used. The for the outgoing partons from the hard scatter was set to 4 GeV. For the generation of resolved photon events, the default multiparton interaction models [51, 52] were used. A comparably reasonable description of the raw data kinematic distributions was observed with both Herwig and Pythia MC simulations.
5 NLO QCD calculations
The calculation for jet photoproduction used is that of Frixione and Ridolfi [53, *np:b507:295, 55], which employs the subtraction method [56] for dealing with the collinear and infra-red divergencies. The number of flavors was set to 5 and the renormalization and factorization scales were both set to , which is half the sum of the transverse energies of the final-state partons. The parton densities in the proton were parameterized using CTEQ5M1 [48]; the value used therein was adopted for the central prediction.
The following parameterizations of the photon PDFs were used: Cornet et al. (CJK) [19], Aurenche et al. (AFG04) [20], Slominski et al. (SAL) [21], Glück et al. (GRV-HO) [49, *pr:d46:1973] and a previous set of PDFs from Aurenche et al. (AFG) [57]. The three new PDFs [19, 20, 21] use all available data on from the LEP experiments. The data are of higher precision and cover a wider region of phase space, reaching lower in and higher in the momentum of the exchanged photon, compared to the data used in the AFG and GRV-HO parameterizations. The parameterization from CJK uses a more careful treatment of heavy quarks, whereas that from SAL also considers previous dijet photoproduction data from ZEUS [4]. The most striking difference between the resulting PDFs is that CJK has a more rapid rise of the gluon density at low .
The NLO QCD predictions were corrected for hadronization effects using a bin-by-bin procedure according to , where is the cross section for partons in the final state of the NLO calculation. The hadronization correction factor, , was defined as the ratio of the dijet cross sections after and before the hadronization process, . The value of was taken as the mean of the ratios obtained using the Herwig and Pythia predictions. The hadronization correction was generally below in each bin.
Several sources of theoretical uncertainty were investigated, which are given below with their typical size,
-
•
the renormalization scale was changed to [22]. This led to an uncertainty of ;
-
•
the factorization scale was changed to [22]. This led to an uncertainty of ;
-
•
the value of was changed by , the uncertainty on the world average [58], by using the CTEQ4 PDFs for 0.113, 0.116 and 0.119 and interpolating accordingly. This led to an uncertainty of about ;
-
•
the uncertainty in the hadronization correction was estimated as half the spread between the two MC correction factors. This led to an uncertainty of generally less than .
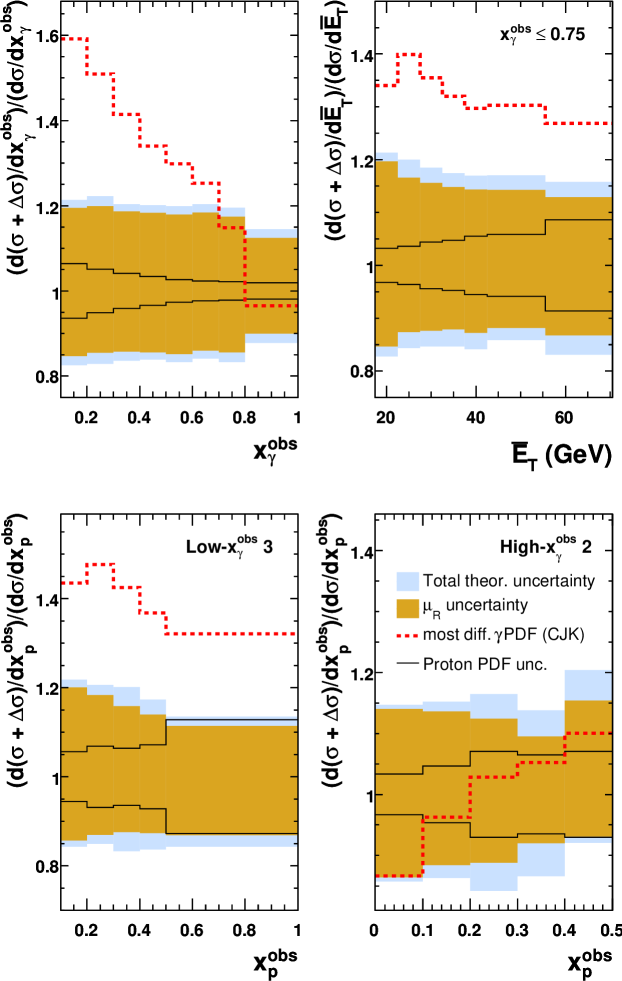
The above four uncertainties were added in quadrature and are displayed on the figures as the shaded band around the central prediction. The size of these uncertainties is also shown as a function of , and in Fig. 2. The uncertainty from changing the renormalization scale is dominant. It should be noted that here the renormalization and factorization scales were varied independently by factors of and the resulting changes were added in quadrature as in the determination of the ZEUS-JETS PDF [22]. The result of this procedure leads to an uncertainty which is approximately the same as varying both simultaneously by as has been done previously [4].
Other uncertainties which were considered are:
-
•
the uncertainties in determining the proton PDFs were assessed by using the ZEUS-JETS PDF uncertainties propagated from the experimental uncertainties of the fitted data. This led to an uncertainty of ;
-
•
the uncertainties in determining the photon PDFs were assessed by using sets from different authors. Differences of generally less than 25% were observed between the AFG, AFG04, SAL and GRV sets. However, the predictions based on CJK were up to 70% higher than those based on the other four.
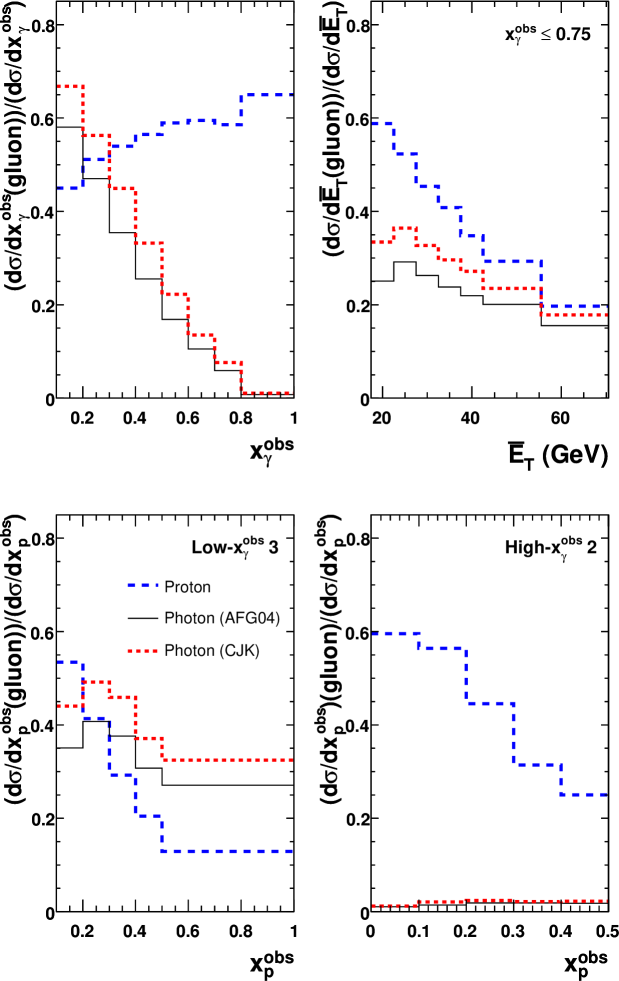
These uncertainties were not added in quadrature with the others, but examples of their size are given in Fig. 2. Differences between the two photon PDFs, CJK and AFG04, are concentrated at low and low ; the low region is most sensitive to the gluon distribution in the photon, which increases more rapidly for CJK as shown in Fig. 3. At lowest , the fraction of the cross section arising from the gluon distribution in the photon is 66% for CJK. The uncertainty on the proton PDF increases with increasing and and is sometimes, as seen in Fig. 2(c), as large as the other combined uncertainties. The fraction of the cross section arising from the gluon distribution in the proton is about 50% for the lower and values considered, but decreases to below 20% for high values. However, the uncertainty on the gluon dominates the proton PDF uncertainty in most of the kinematic region investigated.
6 Event selection
A three-level trigger system was used to select events online [30, 59, 2]. At the third level, a cone algorithm was applied to the CAL cells and jets were reconstructed using the energies and positions of these cells. Events with at least one jet, which satisfied the requirements that the transverse energy exceeded GeV and the pseudorapidity was less than , were accepted. Dijet events in photoproduction were then selected offline by using the following procedures and cuts designed to remove sources of background:
-
•
to remove background due to proton beam-gas interactions and cosmic-ray showers, the longitudinal position of the reconstructed vertex was required to be in the range cm;
-
•
a cut on the ratio of the number of tracks assigned to the primary vertex to the total number of tracks, , was also imposed to remove beam-related background, which have values of this ratio typically below 0.1;
-
•
to remove background due to charged current deep inelastic scattering (DIS) and cosmic-ray showers, events were required to have a relative transverse momentum of , where and are, respectively, the measured transverse momentum and transverse energy of the event;
-
•
neutral current (NC) DIS events with a scattered positron candidate in the CAL were removed by cutting [1] on the inelasticity, , which is estimated from the energy, , and polar angle, , of the scattered positron candidate using . Events were rejected if ;
-
•
the requirement was imposed, where is the estimator of measured from the CAL energy deposits according to the Jacquet-Blondel method [60]. The upper cut removed NC DIS events where the positron was not identified and which therefore have a value of close to 1. The lower cut removed proton beam-gas events which typically have a low value of ;
-
•
the -clustering algorithm was applied to the CAL energy deposits. The transverse energies of the jets were corrected [4, 3, 61] in order to compensate for energy losses in inactive material in front of the CAL. Events were selected in which at least two jets were found with 20 GeV, 15 GeV and , with at least one jet lying in the range between and . In this region, the resolution of the jet transverse energy was about 10%.
7 Data correction and systematics
The data were corrected using the MC samples detailed in Section 4 for acceptance and the effects of detector response using the bin-by-bin method, in which the correction factor, as a function of an observable in a given bin , is . The variable is the number of events in the simulation passing the kinematic requirements on the hadronic final state described in Section 2 and is the number of reconstructed events passing the selection requirements as detailed in Section 6.
The results of a detailed analysis [27, 62] of the possible sources of systematic uncertainty are listed below. Typical values for the systematic uncertainty are quoted for the cross sections as a function of ,
- •
-
•
the central correction factors were determined using the Pythia MC. The Herwig MC sample was used to assess the model dependency of this correction and gave an uncertainty of +4%, but up to +12% at lowest ;
-
•
changing the values of the various cuts to remove backgrounds from DIS, cosmic-ray and beam-gas events gave a combined uncertainty of less than ;
-
•
varying the fraction of direct processes between 34% and 70% of the total MC sample in order to describe each of the kinematic distributions gave an uncertainty of about ;
- •
The uncertainty in the cross sections due to the jet energy-scale uncertainty is correlated between bins and is therefore displayed separately as a shaded band in Figs. 4–13. All other systematic uncertainties were added in quadrature when displayed in these figures. The choice of MC sample also exhibited some correlation between bins and is hence given separately in Tables 2–20. In addition, an overall normalization uncertainty of from the luminosity determination is not included in either the figures or tables.
8 Results
8.1 Dijet differential cross sections
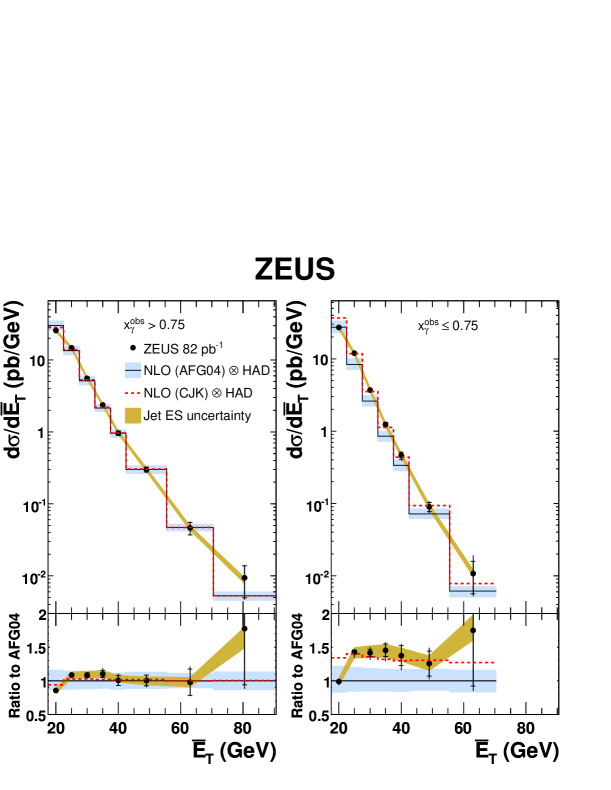
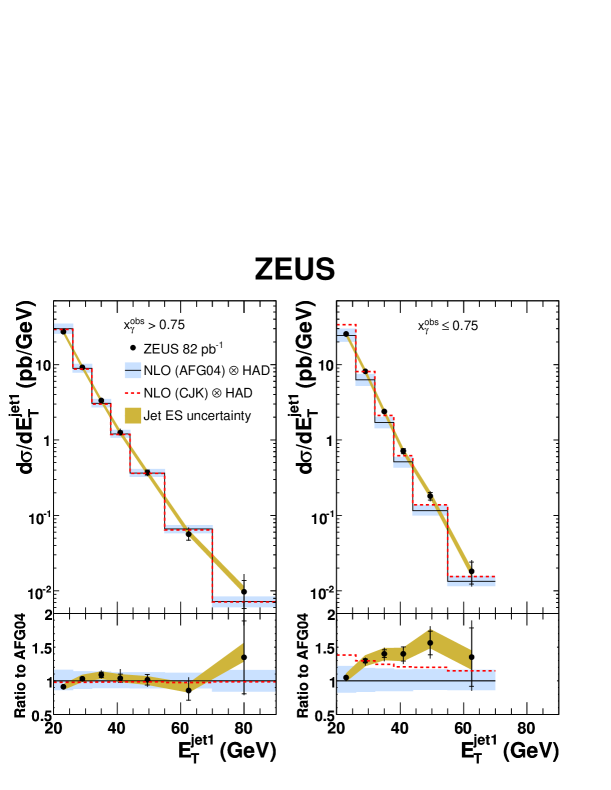
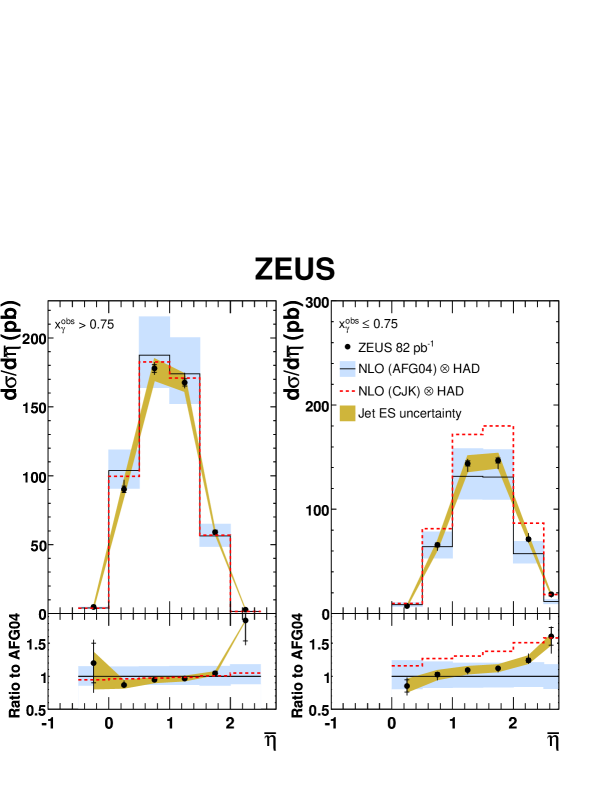
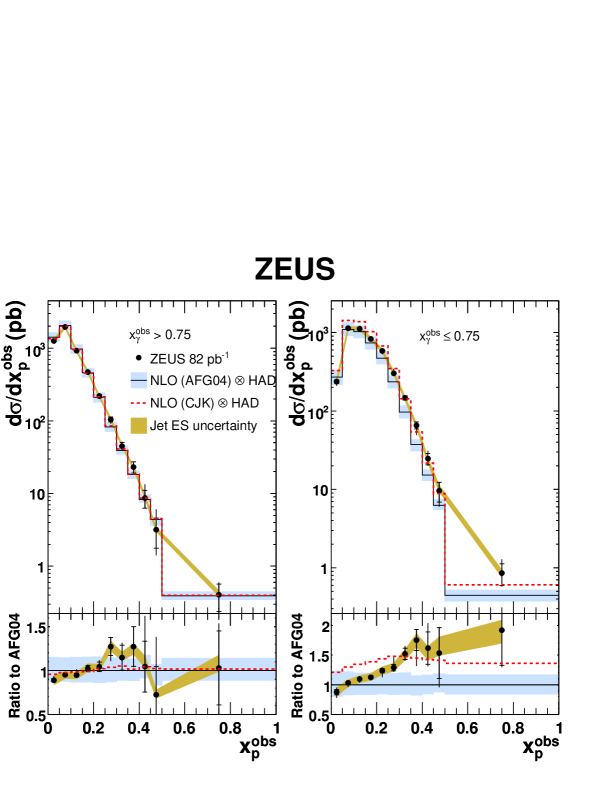
Differential cross-sections , , and are given in Tables 2–9 and shown in Figs. 4–7 for above and below 0.75. For 0.75, and fall by over three orders of magnitude over the and ranges measured and the jets are produced up to 2. For 0.75, the slopes of and are steeper, with the jets produced further forward in . It is interesting to note that in both regions of , the data probe high values of in the proton.
The NLO QCD predictions, corrected for hadronization and using the AFG04 and CJK photon PDFs, are compared to the data. For 0.75, the NLO QCD predictions describe the data well, although some differences in shape are observed for and . Although measurements at high are less sensitive to the structure of the photon, it is interesting to note that the prediction using the CJK photon PDF describes the spectrum somewhat better. The shapes for the and distributions are also better reproduced using the CJK photon PDF.
At low , the difference in shapes between data and NLO QCD for and is more marked, as has been seen previously [4]. For the prediction using AFG04, the data and NLO agree in the lowest bin whereas the prediction is significantly lower at higher and . In contrast, the prediction from CJK is too high in the first bin, which dominates the cross section, but agrees well at higher and . For the and distributions, the shapes are again better described by NLO QCD using the CJK photon PDF, although the normalization is too high. Sensitivity to the photon PDFs is discussed further in Section 8.4.
8.2 Measurement of
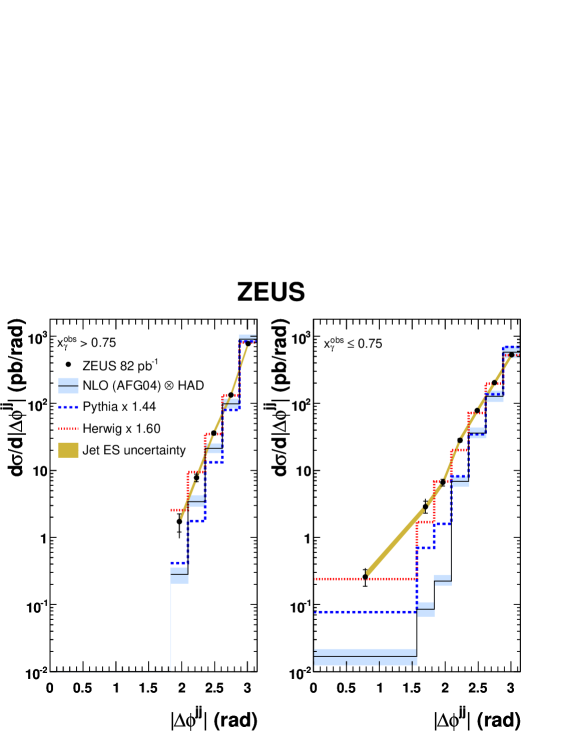
The cross-section is presented for above and below 0.75 in Tables 10 and 11 and Fig. 8. For 0.75, the cross-section data fall by about three orders of magnitude in the cross section, more steeply than for 0.75. The predictions from NLO QCD and also both Herwig and Pythia MC programs (plotted separately since the implementation of parton showers differs between the two programs) are compared to the data. The MC predictions are area normalized to the data in the measured kinematic region. At high , NLO QCD agrees with the data at highest , but it has a somewhat steeper fall off. The prediction from the Pythia MC program is similar to that for NLO QCD, whereas the prediction from the Herwig program describes the data well. For low , the distribution for NLO QCD is much too steep and is significantly below the data for all values of except the highest bin. The prediction from the Pythia program is less steep, but still gives a poor description. The prediction from the Herwig program is in remarkable agreement with the data.
The results and conclusions shown are qualitatively similar to those already seen in dijet photoproduction in which at least one of the jets was tagged as originating from a charm quark [23]. The results here confirm that the parton-shower model in Herwig gives a good simulation of high-order processes and suggest that a matching of it to NLO QCD would give a good description of the data in both shape and normalization. Should such a calculation or other high-order prediction become available, the distributions presented here would be ideal tests of their validity as they present inclusive quantities and also have higher precision compared to the previous result [23].
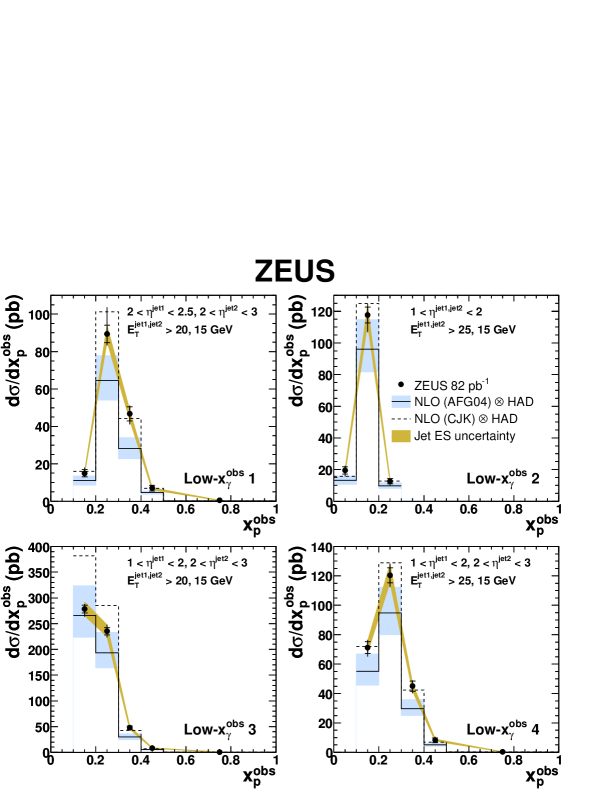
8.3 Optimized cross sections
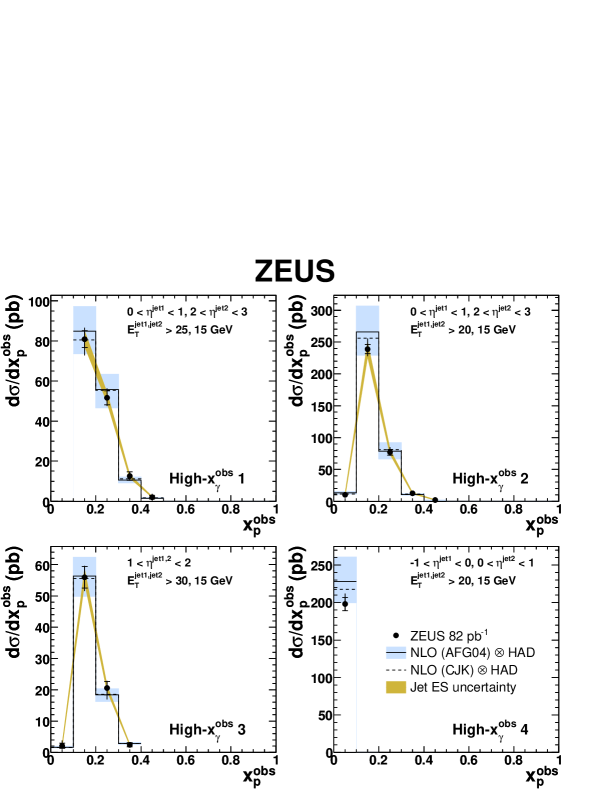
The cross-sections , optimized to be most sensitive to the uncertainty on the gluon PDF in the proton, are given in Tables 12–19 and shown in Figs. 9 and 10 for above and below 0.75, respectively. The measurements cover a range in of about 0.1 to 0.5. At high , the data are very well described by NLO QCD predictions. At low , the description by NLO QCD is poorer, particularly when using the AFG04 photon PDF. Generally the predictions with CJK describe the data better with the exception of the “Low- 3” cross section. Inclusion of these high- data in future fits would constrain the proton PDFs further, in particular that of the gluon. To include the cross sections for low , a systematic treatment of the photon PDFs and their uncertainty is needed.
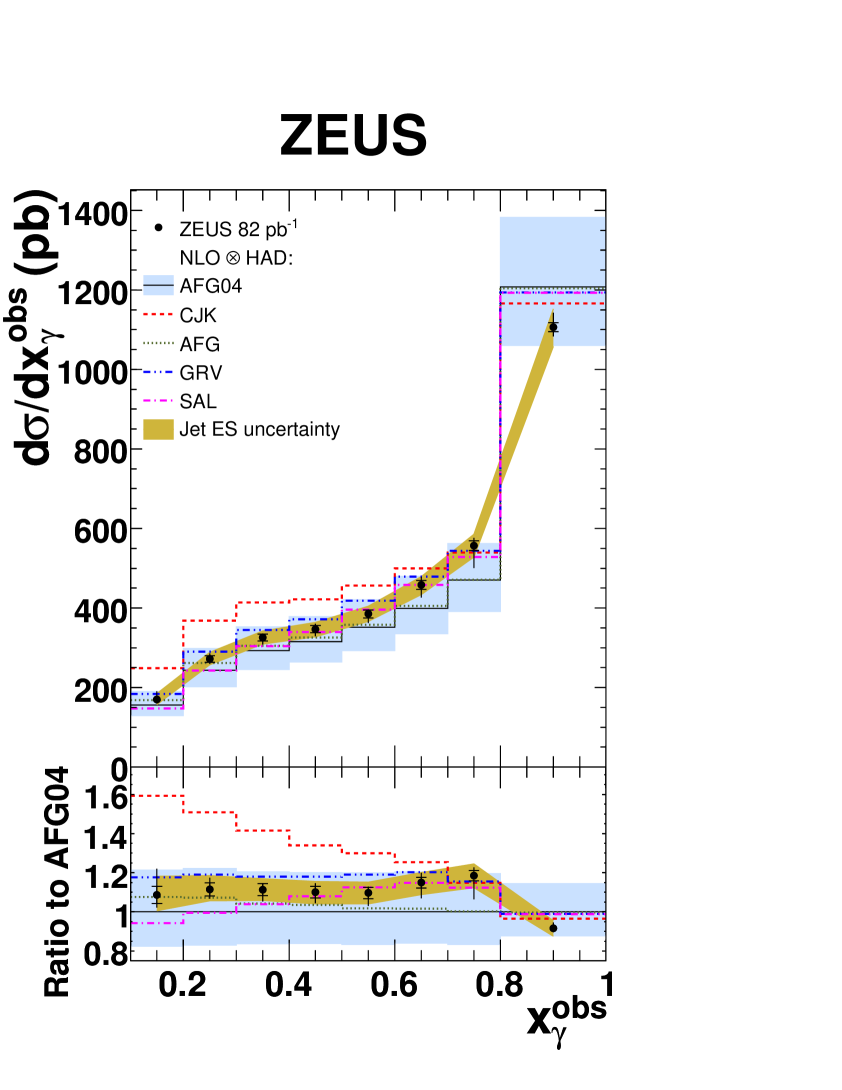
8.4 Sensitivity to the photon PDFs
As discussed in Section 8.1, the measured cross sections show sensitivity to the choice of photon PDFs. This is to be expected due to the extension further forward in pseudorapidity compared to previous measurements. This was investigated further, with the results presented in Figs. 11–13, where predictions with all five available parameterizations of the photon PDFs are compared to the data. In Table 20 and Fig. 11 the cross-section is shown. At high , all predictions are similar, as expected since there is little sensitivity to the photon structure in this region. Towards low , the predictions differ by up to 70%. The prediction from CJK deviates most from the other predictions and also from the data. The other predictions, although also exhibiting differences between each other of up to 25%, give a qualitatively similar description of the data.
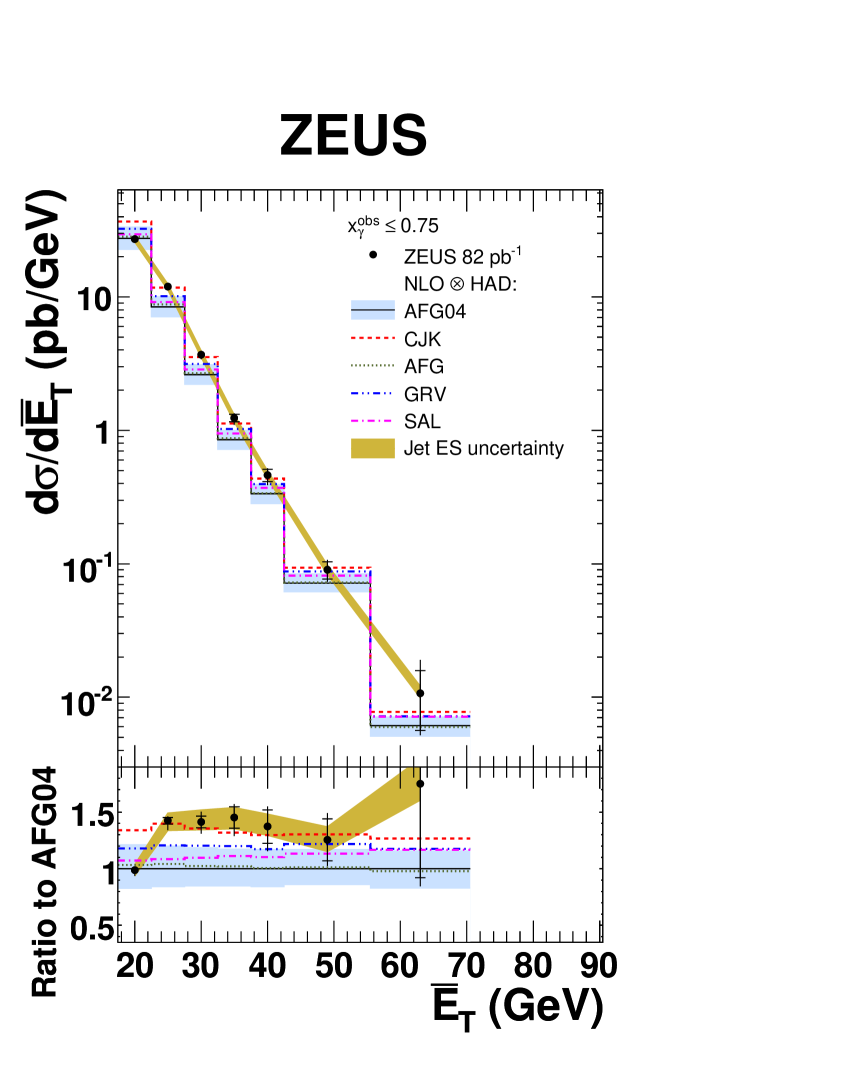
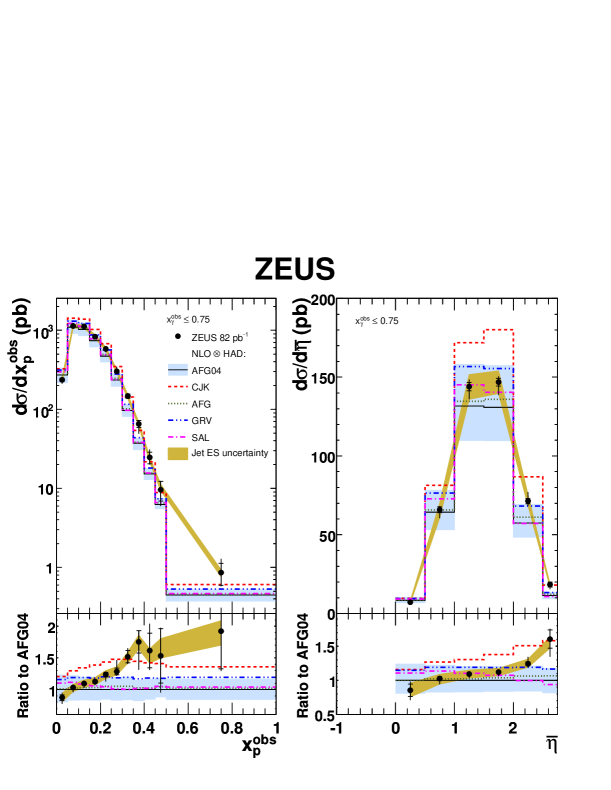
In Figs. 12 and 13, the cross-sections , and are presented for , as shown previously in Figs. 4, 7 and 6, respectively, but here with additional predictions using different photon PDFs. For , the prediction using CJK is much higher than the data in the first bin, but then agrees with the data for all subsequent bins. All photon PDFs have a similar shape, and none can reproduce the shape of the measured distribution. Apart from CJK, all PDFs are too low in the region GeV. For the cross-section , no prediction gives a satisfactory description of the data. The prediction from CJK is generally above the data by 20-30%, but describes the shape of the cross section reasonably well. All other predictions give a poor description of the shape, with cross sections which fall too rapidly to high . For , the prediction from CJK again gives the best description of the shape of the data, although it is too high in normalization.
In summary, the data show a large sensitivity to the parameterization of the photon PDFs. The gluon PDF from CJK, in particular, differs from the others and this may give a hint of how to improve the photon PDFs. The data presented here should significantly improve the measurement of the gluon PDF of the photon, which is currently insufficiently constrained by the data.
9 Conclusions
Dijet cross sections in photoproduction have been measured at high and probe a wide range of and . The kinematic region is GeV2, 142 293 GeV, 20 GeV, 15 GeV and -1 3, with at least one jet lying in the range between and . In general, the data enriched in direct-photon events, at high , are well described by NLO QCD predictions. For the data enriched in resolved-photon events, at low , the data are less well described by NLO QCD predictions. Predictions using different parameterizations of the photon parton density functions give a large spread in the region measured, with no parton density function giving an adequate description of the data. Therefore the data have the potential to improve the constraints on the parton densities in the proton and photon and should be used in future fits. The cross section in the difference of azimuthal angle of the two jets is intrinsically sensitive to high-order QCD processes and the data are poorly described by NLO QCD, particularly at low . Therefore the data should be compared with new calculations of higher orders, or simulations thereof.
10 Acknowledgments
The strong support and encouragement of the DESY Directorate have been invaluable, and we are much indebted to the HERA machine group for their inventiveness and diligent efforts. The design, construction and installation of the ZEUS detector have been made possible by the ingenuity and dedicated efforts of many people from inside DESY and from the home institutes who are not listed as authors. Their contributions are acknowledged with great appreciation. We would also like to thank S. Frixione for help in using his calculation. {mcbibliography}10
References
- [1] ZEUS Coll., M. Derrick et al., Phys. Lett. B 322, 287 (1994)
- [2] ZEUS Coll., J. Breitweg et al., Eur. Phys. J. C 1, 109 (1998)
- [3] ZEUS Coll., S. Chekanov et al., Phys. Lett. B 531, 9 (2002)
- [4] ZEUS Coll., S. Chekanov et al., Eur. Phys. J. C 23, 615 (2002)
- [5] ZEUS Coll., M. Derrick et al., Phys. Lett. B 342, 417 (1995)
- [6] ZEUS Coll., M. Derrick et al., Phys. Lett. B 348, 665 (1995)
- [7] ZEUS Coll., M. Derrick et al., Phys. Lett. B 384, 401 (1995)
- [8] ZEUS Coll., J. Breitweg et al., Phys. Lett. B 443, 394 (1998)
- [9] ZEUS Coll., J. Breitweg et al., Eur. Phys. J. C 4, 591 (1998)
- [10] ZEUS Coll., J. Breitweg et al., Eur. Phys. J. C 11, 35 (1999)
- [11] ZEUS Coll., S. Chekanov et al., Phys. Lett. B 560, 7 (2003)
- [12] H1 Coll., I. Abt et al., Phys. Lett. B 314, 436 (1993)
- [13] H1 Coll., S. Aid et al., Z. Phys. C 70, 17 (1996)
- [14] H1 Coll., C. Adloff et al., Eur. Phys. J. C 1, 97 (1998)
- [15] H1 Coll., C. Adloff et al., Phys. Lett. B 483, 36 (2000)
- [16] H1 Coll., C. Adloff et al., Eur. Phys. J. C 25, 13 (2002)
- [17] H1 Coll., C. Adloff et al., Eur. Phys. J. C 29, 497 (2003)
- [18] H1 Coll., A. Aktas et al., Phys. Lett. B 639, 21 (2006)
- [19] F. Cornet, P. Jankowksi and M. Krawczyk, Phys. Rev. D 70, 093004 (2004)
- [20] P. Aurenche, M. Fontannaz and J.Ph. Guillet, Eur. Phys. J. C 34, 395 (2005)
- [21] W. Slominski, H. Abramowicz and A. Levy, Eur. Phys. J. C 45, 633 (2006)
- [22] ZEUS Coll., S. Chekanov et al., Eur. Phys. J. C 42, 1 (2005)
- [23] ZEUS Coll., S. Chekanov et al., Nucl. Phys. B 729, 492 (2005)
- [24] ZEUS Coll., S. Chekanov et al., Phys. Lett. B 511, 19 (2001)
- [25] S. Catani et al., Nucl. Phys. B 406, 187 (1993)
- [26] S.D. Ellis and D.E. Soper, Phys. Rev. D 48, 3160 (1993)
- [27] C. Targett-Adams, Ph.D. Thesis, University College London, 2006 (unpublished)
- [28] ZEUS Coll., S. Chekanov et al., Phys. Rev. D 67, 012007 (2003)
- [29] ZEUS Coll., M. Derrick et al., Phys. Lett. B 297, 404 (1992)
- [30] ZEUS Coll., U. Holm (ed.), The ZEUS Detector. Status Report (unpublished), DESY (1993), available on http://www-zeus.desy.de/bluebook/bluebook.html
- [31] N. Harnew et al., Nucl. Inst. Meth. A 279, 290 (1989)
- [32] B. Foster et al., Nucl. Phys. Proc. Suppl. B 32, 181 (1993)
- [33] B. Foster et al., Nucl. Inst. Meth. A 338, 254 (1994)
- [34] M. Derrick et al., Nucl. Inst. Meth. A 309, 77 (1991)
- [35] A. Andresen et al., Nucl. Inst. Meth. A 309, 101 (1991)
- [36] A. Caldwell et al., Nucl. Inst. Meth. A 321, 356 (1992)
- [37] A. Bernstein et al., Nucl. Inst. Meth. A 336, 23 (1993)
- [38] J. Andruszków et al., Preprint DESY-92-066, DESY, 1992
- [39] ZEUS Coll., M. Derrick et al., Z. Phys. C 63, 391 (1994)
- [40] J. Andruszków et al., Acta Phys. Pol. B 32, 2025 (2001)
- [41] G. Corcella et al., JHEP 0101, 010 (2001)
- [42] G. Marchesini et al., Comp. Phys. Comm. 67, 465 (1992)
- [43] T. Sjöstrand et al., Comp. Phys. Comm. 135, 238 (2001)
- [44] T. Sjöstrand, Comp. Phys. Comm. 82, 74 (1994)
- [45] B.R. Webber, Nucl. Phys. B 238, 492 (1984)
- [46] B. Andersson et al., Phys. Rep. 97, 31 (1983)
- [47] R. Brun et al., geant3, Technical Report CERN-DD/EE/84-1, CERN, 1987
- [48] H.L. Lai et al., Phys. Rev. D 55, 1280 (1997)
- [49] M. Glück, E. Reya and A. Vogt, Phys. Rev. D 45, 3986 (1992)
- [50] M. Glück, E. Reya and A. Vogt, Phys. Rev. D 46, 1973 (1992)
- [51] J.M. Butterworth, J.R. Forshaw and M.H. Seymour, Z. Phys. C 72, 636 (1996)
- [52] T. Sjöstrand and M. van Zijl, Phys. Rev. D 36, 2019 (1987)
- [53] S. Frixione, Z. Kunszt and A. Signer, Nucl. Phys. B 467, 399 (1996)
- [54] S. Frixione, Nucl. Phys. B 507, 295 (1997)
- [55] S. Frixione and G. Ridolfi, Nucl. Phys. B 507, 315 (1997)
- [56] R.K. Ellis, D.A. Ross and A.E. Terrano, Nucl. Phys. B 178, 421 (1981)
- [57] P. Aurenche, J.P. Guillet and M. Fontannaz, Z. Phys. C 64, 621 (1994)
- [58] S. Bethke, Prog. Part. Nucl. Phys. 58, 351 (2007)
- [59] W.H. Smith, K. Tokushuku and L.W. Wiggers, Proc. Computing in High-Energy Physics (CHEP), Annecy, France, Sept. 1992, C. Verkerk and W. Wojcik (eds.), p. 222. CERN, Geneva, Switzerland (1992). Also in preprint DESY 92-150B
- [60] F. Jacquet and A. Blondel, Proceedings of the Study for an Facility for Europe, U. Amaldi (ed.), p. 391. Hamburg, Germany (1979). Also in preprint DESY 79/48
- [61] M. Wing (on behalf of the ZEUS Coll.), Proc. of the 10th International Conference on Calorimetry in High Energy Physics, R. Zhu (ed.), p. 767. Pasadena, USA (2002). Also in preprint hep-ex/0206036
- [62] H. Perrey, Diploma Thesis, Universität Hamburg, 2007 (unpublished)
- [63] K. Hagiwara et al., Phys. Rev. D 51, 3197 (1995)
| Label | cut | cuts | cuts |
|---|---|---|---|
| “High- 1” | 0.75 | , | GeV |
| “High- 2” | 0.75 | , | GeV |
| “High- 3” | 0.75 | GeV | |
| “High- 4” | 0.75 | , | GeV |
| “Low- 1” | 0.75 | , | GeV |
| “Low- 2” | 0.75 | GeV | |
| “Low- 3” | 0.75 | , | GeV |
| “Low- 4” | 0.75 | , | GeV |
| bin (GeV) | (pb/GeV) | ||||||
|---|---|---|---|---|---|---|---|
| 17.5, 22.5 | 25.73 | 0.36 | 0.955 0.017 | ||||
| 22.5, 27.5 | 14.66 | 0.28 | 0.931 0.008 | ||||
| 27.5, 32.5 | 5.57 | 0.18 | 0.937 0.029 | ||||
| 32.5, 37.5 | 2.37 | 0.12 | 0.927 0.012 | ||||
| 37.5, 42.5 | 0.96 | 0.07 | 0.907 0.034 | ||||
| 42.5, 55.5 | 0.300 | 0.024 | 0.932 0.044 | ||||
| 55.5, 70.5 | 0.046 | 0.009 | 0.926 0.029 | ||||
| 70.5, 90.5 | 0.009 | 0.004 | 0.917 0.085 |
| bin (GeV) | (pb/GeV) | ||||||
|---|---|---|---|---|---|---|---|
| 17.5, 22.5 | 27.10 | 0.36 | 1.082 0.045 | ||||
| 22.5, 27.5 | 11.97 | 0.24 | 1.047 0.009 | ||||
| 27.5, 32.5 | 3.69 | 0.14 | 1.057 0.016 | ||||
| 32.5, 37.5 | 1.24 | 0.08 | 1.004 0.024 | ||||
| 37.5, 42.5 | 0.46 | 0.05 | 1.069 0.043 | ||||
| 42.5, 55.5 | 0.090 | 0.013 | 1.019 0.015 | ||||
| 55.5, 70.5 | 0.011 | 0.005 | 0.974 0.064 |
| bin (GeV) | (pb/GeV) | ||||||
|---|---|---|---|---|---|---|---|
| 20, 26 | 27.24 | 0.33 | 0.957 0.021 | ||||
| 26, 32 | 9.21 | 0.20 | 0.920 0.011 | ||||
| 32, 38 | 3.34 | 0.12 | 0.916 0.024 | ||||
| 38, 44 | 1.25 | 0.07 | 0.943 0.005 | ||||
| 44, 55 | 0.37 | 0.03 | 0.921 0.035 | ||||
| 55, 70 | 0.056 | 0.009 | 0.889 0.051 | ||||
| 70, 90 | 0.010 | 0.004 | 0.85 0.11 |
| bin (GeV) | (pb/GeV) | ||||||
|---|---|---|---|---|---|---|---|
| 20, 26 | 25.59 | 0.31 | 1.081 0.043 | ||||
| 26, 32 | 8.11 | 0.18 | 1.041 0.015 | ||||
| 32, 38 | 2.39 | 0.10 | 1.017 0.025 | ||||
| 38, 44 | 0.72 | 0.05 | 0.997 0.006 | ||||
| 44, 55 | 0.18 | 0.02 | 0.963 0.027 | ||||
| 55, 70 | 0.018 | 0.006 | 0.927 0.033 |
| bin | (pb) | ||||||
|---|---|---|---|---|---|---|---|
| -0.50, 0.00 | 4.8 | 1.2 | 0.551 0.037 | ||||
| 0.00, 0.50 | 90.1 | 2.3 | 0.892 0.018 | ||||
| 0.50, 1.00 | 177.8 | 2.9 | 0.940 0.001 | ||||
| 1.00, 1.50 | 167.6 | 2.6 | 0.952 0.014 | ||||
| 1.50, 2.00 | 59.0 | 1.5 | 1.079 0.035 | ||||
| 2.00, 2.50 | 2.8 | 0.5 | 1.062 0.064 |
| bin | (pb) | ||||||
|---|---|---|---|---|---|---|---|
| 0.00, 0.50 | 7.2 | 0.8 | 1.052 0.080 | ||||
| 0.50, 1.00 | 65.9 | 1.9 | 1.074 0.054 | ||||
| 1.00, 1.50 | 144.0 | 2.6 | 1.080 0.021 | ||||
| 1.50, 2.00 | 146.8 | 2.4 | 1.063 0.019 | ||||
| 2.00, 2.50 | 71.3 | 1.7 | 1.062 0.022 | ||||
| 2.50, 2.75 | 18.4 | 1.5 | 1.066 0.002 |
| bin | (pb) | ||||||
|---|---|---|---|---|---|---|---|
| 0.00, 0.05 | 1260 | 26 | 0.902 0.025 | ||||
| 0.05, 0.10 | 1960 | 30 | 0.932 0.007 | ||||
| 0.10, 0.15 | 925 | 20 | 0.996 0.024 | ||||
| 0.15, 0.20 | 468 | 15 | 0.999 0.015 | ||||
| 0.20, 0.25 | 220 | 11 | 0.982 0.012 | ||||
| 0.25, 0.30 | 104.9 | 8.4 | 0.963 0.015 | ||||
| 0.30, 0.35 | 45.0 | 5.6 | 1.063 0.023 | ||||
| 0.35, 0.40 | 23.2 | 4.1 | 1.027 0.008 | ||||
| 0.40, 0.45 | 8.7 | 2.4 | 1.010 0.020 | ||||
| 0.45, 0.50 | 3.2 | 1.4 | 1.006 0.016 | ||||
| 0.50, 1.00 | 0.40 | 0.17 | 0.987 0.018 |
| bin | (pb) | ||||||
|---|---|---|---|---|---|---|---|
| 0.00, 0.05 | 236 | 12 | 1.103 0.092 | ||||
| 0.05, 0.10 | 1131 | 24 | 1.063 0.046 | ||||
| 0.10, 0.15 | 1120 | 22 | 1.086 0.022 | ||||
| 0.15, 0.20 | 829 | 19 | 1.074 0.001 | ||||
| 0.20, 0.25 | 581 | 17 | 1.053 0.001 | ||||
| 0.25, 0.30 | 302 | 12 | 1.052 0.052 | ||||
| 0.30, 0.35 | 146.8 | 9.4 | 1.052 0.014 | ||||
| 0.35, 0.40 | 65.5 | 6.6 | 1.041 0.008 | ||||
| 0.40, 0.45 | 24.6 | 4.2 | 1.036 0.004 | ||||
| 0.45, 0.50 | 9.6 | 2.7 | 1.020 0.005 | ||||
| 0.50, 1.00 | 0.86 | 0.27 | 1.012 0.034 |
| bin | (pb/rad) | ||||||
|---|---|---|---|---|---|---|---|
| 1.83, 2.09 | 1.7 | 0.5 | 0.65 0.11 | ||||
| 2.09, 2.36 | 7.8 | 1.0 | 0.729 0.059 | ||||
| 2.36, 2.62 | 36.1 | 2.2 | 0.826 0.013 | ||||
| 2.62, 2.88 | 132.9 | 3.9 | 0.868 0.008 | ||||
| 2.88, 3.14 | 779.1 | 8.1 | 0.984 0.015 |
| bin | (pb/rad) | ||||||
|---|---|---|---|---|---|---|---|
| 0.00, 1.57 | 0.26 | 0.07 | 0.84 0.15 | ||||
| 1.57, 1.83 | 2.9 | 0.6 | 0.869 0.083 | ||||
| 1.83, 2.09 | 6.6 | 0.8 | 0.910 0.031 | ||||
| 2.09, 2.36 | 28.2 | 1.7 | 0.959 0.004 | ||||
| 2.36, 2.62 | 78.4 | 2.8 | 0.988 0.006 | ||||
| 2.62, 2.88 | 203.2 | 4.5 | 1.006 0.015 | ||||
| 2.88, 3.14 | 528.6 | 6.7 | 1.069 0.020 |
| bin | (pb) | ||||||
|---|---|---|---|---|---|---|---|
| 0.1, 0.2 | 80.9 | 4.2 | 0.957 0.010 | ||||
| 0.2, 0.3 | 51.6 | 3.5 | 0.974 0.059 | ||||
| 0.3, 0.4 | 12.6 | 2.1 | 0.962 0.010 | ||||
| 0.4, 0.5 | 2.1 | 1.0 | 0.953 0.024 |
| bin | (pb) | ||||||
|---|---|---|---|---|---|---|---|
| 0.0, 0.1 | 10.1 | 1.6 | 0.961 0.037 | ||||
| 0.1, 0.2 | 238.9 | 7.1 | 1.006 0.021 | ||||
| 0.2, 0.3 | 77.0 | 4.5 | 1.005 0.026 | ||||
| 0.3, 0.4 | 12.6 | 2.1 | 0.964 0.009 | ||||
| 0.4, 0.5 | 2.1 | 1.0 | 0.953 0.024 |
| bin | (pb) | ||||||
|---|---|---|---|---|---|---|---|
| 0.0, 0.1 | 2.1 | 0.8 | 0.914 0.014 | ||||
| 0.1, 0.2 | 55.9 | 3.5 | 0.974 0.006 | ||||
| 0.2, 0.3 | 20.5 | 2.1 | 0.988 0.011 | ||||
| 0.3, 0.4 | 2.4 | 0.7 | 1.007 0.046 |
| bin | (pb) | ||||||
|---|---|---|---|---|---|---|---|
| 0.0, 0.1 | 198.0 | 8.8 | 0.832 0.017 |
| bin | (pb) | ||||||
|---|---|---|---|---|---|---|---|
| 0.1, 0.2 | 15.0 | 2.0 | 1.004 0.099 | ||||
| 0.2, 0.3 | 89.4 | 4.6 | 1.030 0.003 | ||||
| 0.3, 0.4 | 46.7 | 3.8 | 1.070 0.090 | ||||
| 0.4, 0.5 | 7.0 | 1.5 | 0.960 0.083 | ||||
| 0.5, 1.0 | 0.48 | 0.20 | 1.024 0.027 |
| bin | (pb) | ||||||
|---|---|---|---|---|---|---|---|
| 0.0, 0.1 | 19.5 | 2.3 | 0.876 0.076 | ||||
| 0.1, 0.2 | 117.6 | 5.0 | 1.048 0.014 | ||||
| 0.2, 0.3 | 12.6 | 1.7 | 1.116 0.085 |
| bin | (pb) | ||||||
|---|---|---|---|---|---|---|---|
| 0.1, 0.2 | 278.4 | 7.6 | 1.087 0.015 | ||||
| 0.2, 0.3 | 235.2 | 7.1 | 1.077 0.030 | ||||
| 0.3, 0.4 | 47.8 | 3.6 | 0.999 0.064 | ||||
| 0.4, 0.5 | 8.3 | 1.6 | 1.037 0.020 | ||||
| 0.5, 1.0 | 0.28 | 0.14 | 1.003 0.037 |
| bin | (pb) | ||||||
|---|---|---|---|---|---|---|---|
| 0.1, 0.2 | 71.3 | 4.1 | 1.066 0.052 | ||||
| 0.2, 0.3 | 120.4 | 5.0 | 1.042 0.021 | ||||
| 0.3, 0.4 | 45.0 | 3.4 | 1.013 0.059 | ||||
| 0.4, 0.5 | 8.3 | 1.6 | 1.037 0.020 | ||||
| 0.5, 1.0 | 0.28 | 0.14 | 1.003 0.037 |
| bin | (pb) | ||||||
|---|---|---|---|---|---|---|---|
| 0.1, 0.2 | 169.5 | 6.8 | 1.081 0.046 | ||||
| 0.2, 0.3 | 271.6 | 8.0 | 1.042 0.056 | ||||
| 0.3, 0.4 | 325.7 | 8.9 | 1.065 0.017 | ||||
| 0.4, 0.5 | 346.6 | 9.3 | 1.058 0.023 | ||||
| 0.5, 0.6 | 385 | 10 | 1.072 0.016 | ||||
| 0.6, 0.7 | 458 | 11 | 1.089 0.028 | ||||
| 0.7, 0.8 | 557 | 12 | 1.087 0.011 | ||||
| 0.8, 1.0 | 1106 | 11 | 0.940 0.018 |