Evolution of dust and ice features around FU Orionis objects11affiliation: Based on observations with ISO, an ESA project with instruments funded by ESA Member States (especially the PI countries: France, Germany, the Netherlands and the United Kingdom) and with the participation of ISAS and NASA. This work is based in part on observations made with the Spitzer Space Telescope, which is operated by the Jet Propulsion Laboratory, California Institute of Technology under a contract with NASA.
Abstract
We present spectroscopy data for a sample of 14 FUors and 2 TTauri stars observed with the Spitzer Space Telescope or with the Infrared Space Observatory (ISO). Based on the appearance of the 10 m silicate feature we define 2 categories of FUors. Objects showing the silicate feature in absorption (Category 1) are still embedded in a dusty and icy envelope. The shape of the 10 m silicate absorption bands is compared to typical dust compositions of the interstellar medium and found to be in general agreement. Only one object (RNO 1B) appears to be too rich in amorphous pyroxene dust, but a superposed emission feature can explain the observed shape. We derive optical depths and extinction values from the silicate band and additional ice bands at 6.0, 6.8 and 15.2 m. In particular the analysis of the CO2 ice band at 15.2 m allows us to search for evidence for ice processing and constrains whether the absorbing material is physically linked to the central object or in the foreground. For objects showing the silicate feature in emission (Category 2), we argue that the emission comes from the surface layer of accretion disks. Analyzing the dust composition reveals that significant grain growth has already taken place within the accretion disks, but no clear indications for crystallization are present. We discuss how these observational results can be explained in the picture of a young, and highly active accretion disk. Finally, a framework is proposed as to how the two categories of FUors can be understood in a general paradigm of the evolution of young, low-mass stars. Only one object (Parsamian 21) shows PAH emission features. Their shapes, however, are often seen toward evolved stars and we question the object’s status as a FUor and discuss other possible classifications. Two spectra (RNO 1B and L1551 IRS 5) show [Fe II] emission lines which are attributed to hot and dense material located close to the root of an outflow (L1551 IRS 5) or to shocked material directly within an outflow (RNO 1B).
1 Introduction
By means of mid-infrared (MIR) spectroscopy gaseous and solid state features have been observed and analyzed in a variety of astronomical environments. While ground-based observations are restricted to certain atmospheric windows (e.g., the N-band around 10 m), spectrographs onboard space-borne telescopes, such as ISO and Spitzer, enable us to study a broad wavelength range from the near-infrared (NIR) to well beyond 30 m. Those instruments fostered and revolutionized our understanding in numerous astronomical fields of research. In particular the star-formation community benefitted from studies based on data from the space telescopes. The composition of dust grains and their evolution (e.g., grain growth and crystallization) in protoplanetary disks was analyzed to great extend in young, intermediate mass Herbig Ae/Be stars (HAeBes) (e.g., Bouwman et al., 2001; Meeus et al., 2001; Acke & van den Ancker, 2004; van Boekel et al., 2005), but also in the young, less massive TTauri stars (e.g., Forrest et al., 2004; Kessler-Silacci et al., 2006; Sargent et al., 2006). In addition, the ice and dust features of younger and more deeply embedded objects were studied (e.g., Watson et al., 2004) and the ice inventory of molecular clouds was investigated (e.g., Knez et al., 2005; Bergin et al., 2005).
One special sub-group of young low-mass objects are FU Orionis objects (FUors), named after the prototype FU Ori. For most objects of this group evidence was found for a tremendous outburst in optical or NIR light over short timescales (months to years) followed by a decline in luminosity typically over several decades. Other objects were included to this group as they shared peculiar spectral features, e.g, CO bandhead absorption in the NIR and a changing spectral type with wavelength. Most observational data can be well explained with highly active accretion disks surrounding these objects, possibly fed with fresh material from a remnant envelope (for a review, see, Hartmann & Kenyon, 1996). Observations in the MIR are thus ideally suited to probe the dusty component of the circumstellar material of these objects, either contained in the accretion disks or, additionally, in the envelopes. Recent findings from NIR and MIR interferometers support the presence of accretion disks several tens of AU in size (Quanz et al., 2006; Malbet et al., 2005; Millan-Gabet et al., 2006). However, while the SED and the NIR and MIR visibilities of FU Ori itself can be sufficiently explained by a simple accretion disk model (Quanz et al., 2006), Millan-Gabet et al. (2006) found that accretion disks alone can not reproduce the SED and observed low K-band visibilities of V1057 Cyg, V1515 Cyg and Z CMa-SE simultaneously. They concluded that additional uncorrelated flux is required possibly arising due to scattering by large dusty envelopes.
While Lorenzetti et al. (2000) presented far-infrared spectroscopy data for 6 FUors observed with ISO-LWS, a dedicated MIR study of a larger sample of FUors is still missing. Larsson et al. (2000) showed the ISO-SWS spectra for 6 FUors for comparison, but no analysis was carried out. The ISO data for Z CMa were presented in publications related to Herbig Ae/Be stars by Acke & van den Ancker (2004) and Elia et al. (2004), as Z CMa presumably is a binary system consisting of a Herbig star and a FUor. White et al. (2000) used the ISO observations of L1551 IRS 5 as input for a radiative transfer model of this source. Hanner et al. (1998) discussed ground-based 8-13m spectra for four FUors (FU Ori, V1515 Cyg, V1057 Cyg, V1735 Cyg) and fitted a simple dust model to the data to check whether silicate particles from the interstellar medium (ISM) can reproduce the observed features. Schütz et al. (2005) published additional ground-based data for another four objects in the same wavelength regime. As three objects (Z CMa, V346 Nor, V883 Ori) showed the 10m feature in absorption they inferred the optical depth from fitting an ISM dust model to the spectra. The fourth object (Bran 76, alias BBW 76) was not analyzed in greater detail. Polomski et al. (2005) presented data on RNO 1B, Z CMa, and Parsamian 21 and derived dust temperatures and optical depths.
To our knowledge, the first MIR spectra of FUors observed with Spitzer were presented in Green et al. (2006). The main focus of this publication was an accurate SED modeling of FU Ori, V1515 Cyg, and V1057 Cyg. Spectral solid state features were not analyzed in greater detail. The spectrum of V346 Nor was presented for comparison. In Quanz et al. (2006) the first detailed dust composition modeling for the FU Ori spectrum was presented and evidence for grain growth in the accretion disk was found. The Spitzer spectra of RNO 1B/1C were shown in Quanz et al. (2007). However, the dust composition was not yet analyzed in detail.
In this paper we compile MIR spectra for 14 FU Orionis objects observed with ISO and/or Spitzer. As up to now only 20 FUors or FUor candidates are known, this is the largest sample of these objects analyzed so far in a single MIR study. Part of the data have not been published before. For objects where the spectra show a sufficient signal-to-noise ratio, the dust and ice composition of the circumstellar material is investigated.
2 Observations and Data Reduction
The mid-infrared spectra we present in this paper are compiled from the archives of the ISO111The ISO archive can be accessed via http://www.iso.vilspa.esa.es/ida/ and the Spitzer222http://ssc.spitzer.caltech.edu/archanaly/archive.html satellite. The Short Wavelength Spectrograph (SWS) onboard ISO consisted of two nearly independent grating spectrometers with a spectral resolution between 1000 and 2500 (depending on the band and order) and covering a wavelength range from 2.4 - 12.0 m and from 12.0 - 45.0 m, respectively. While the field-of-view (FOV) for the shorter wavelength regime was 14, the FOV for the longer wavelength range was 14, with the exception of the wavelength range between 28.9 - 45.0 m which had a FOV of 20. With ISO/SWS seven objects classified as FUors were observed between April 1996 and October 1997. For one object (OO Ser) data were taken at five different epochs documenting a decay in luminosity over a few months. Table 1 summarizes the ISO-observations with object names, coordinates, ISO-SWS observing mode and scan speed, integration time on target, possible pointing offsets (see below), and the date of the observation. For the data reduction Highly Processed Data Products (HPDP) or SWS Auto Analysis Results (AAR) were downloaded from the ISO archive for speed 1 and 2 or speed 3 and 4 observations, respectively. With the OSIA software package (version 4.0)333http://sws.ster.kuleuven.ac.be/osia/ the following reduction steps were carried out: For each object the spectra from the ISO-SWS up- and down-scan were flat-fielded and rebinned. After sigma clipping, the speed 3 and speed 4 spectra were de-fringed. This procedure was not required for the speed 1 and speed 2 data as the HPDP are already de-fringed. Finally, the spectra from the up- and down-scan were combined and rebinned to a spectral resolution of 100. In case the resulting spectrum showed signs of a pointing offset (e.g., aperture jumps) a correction based on the measured beam profiles along the different axes was applied to the raw data and the data reduction was repeated. The applied offsets are listed in Table 1.
The Spitzer observations are summarized in Table 2. The IRS onboard Spitzer offers a short wavelength, low resolution module (SL) covering the wavelength range between 5.2 - 14.5 m, and a short wavelength, high resolution module (SH) going from 9.9 - 19.6 m. The corresponding slit sizes are 3.6 (including both SL orders and an additional bonus segment connecting both orders) and 4.7, respectively. For the longer wavelength part a long wavelength, low resolution module (LL) ranging from 14.0 - 38.0 m and a long wavelength, high resolution model (LH) covering the regime from 18.7 - 37.2 m are available. The slits sizes are 10.5 (including both LL orders and an additional bonus segment connecting both orders) and 11.1, respectively. Both low resolution modules (SL and LL) offer a spectral resolution between 64 - 128 (depending on the wavelength) while the high resolution modules both have 600. All objects listed in Table 2 were observed with the full wavelength coverage, either with a combination of SL+LL or with SL+SH+LH. Two objects (HL Tau and XZ Tau) are not classified as FUors but were part of a small Spitzer/IRS map including L1551 IRS 5, and data for all three objects could be downloaded simultaneously. Interestingly, XZ Tau is a binary system that recently was found to show EXor-type variations (Coffey et al., 2004), i.e., another type of short term eruptions of young stars. Thus, a comparison to the FUor data presented here is reasonable. In addition, the data of HL Tau enable us to compare the FUor spectra to that of a well-studied young star with a remnant envelope and a highly inclined accretion disk seen almost edge-on (Close et al., 1997). Part of the Spitzer spectrum of HL Tau was already published in Bergin et al. (2005). The object V1647 Ori was observed three times within a period of roughly 5 months to monitor its brightness as it underwent an eruption beginning of 2004. However, to our knowledge, thus far no spectrum was published.
The data reduction process of the Spitzer data is described in detail in Quanz et al. (2007). However, we should mention that the error bar for each individual spectral point represents the formal standard deviation from the mean flux of at least two independent measurements (two telescope nod position and possibly several observation cycles). Also taken into account is the formal error of the spectral response function. For details on the method we refer the reader also to Bouwman et al. (2006). We estimate a relative flux calibration error across a spectral order of % and an absolute calibration error between orders or modules of %. In particular, for the objects RNO 1B and RNO 1C apparent flux density offsets between the SL and the SH part of the spectra, as well as between the short and long wavelengths part of the high-resolution spectra, are already discussed in Quanz et al. (2007). For the other objects presented here, the discrepancies in the flux densities between the SL and the SH part of the spectrum were 10% and we matched the longer wavelength part to the shorter regime by multiplying a scalar factor. Only Bran 76 (also known as BBW 76) showed a larger offset of 15% as already mentioned by Green et al. (2006). For Parsamian 21 (HBC 687) we do not show the SH spectrum between 14 and 20 m as the slit of the spectrograph was not centered on the source and significant flux loss occurred for which we could not correct. An additional correction between the SH and the LH module of the spectrum was required for XZ Tau, HL Tau and L1551 IRS 5 where the flux densities of the LH part had to be scaled down by 10 - 15%. This offset can be explained by the larger aperture of this module which possibly probed additional large scale emission from the surroundings of these objects.
3 Results
3.1 General overview
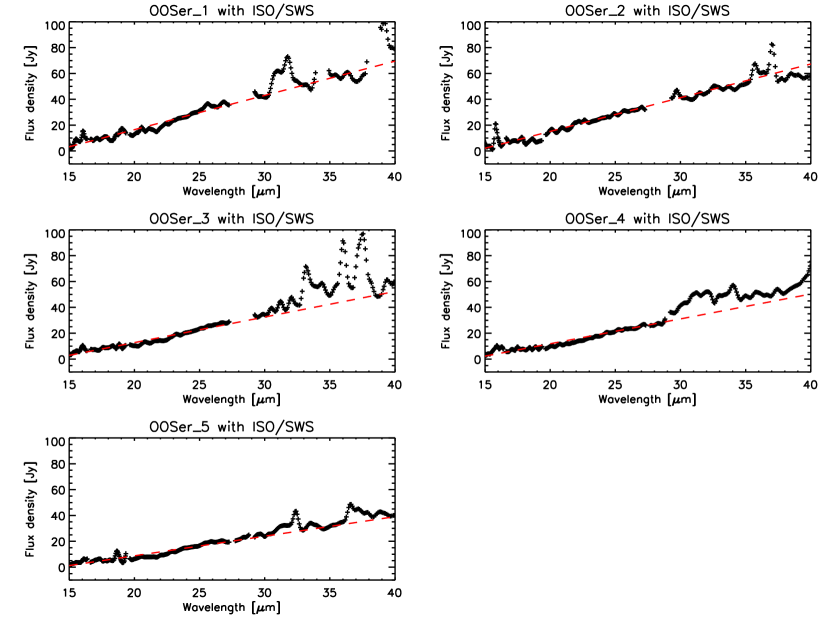
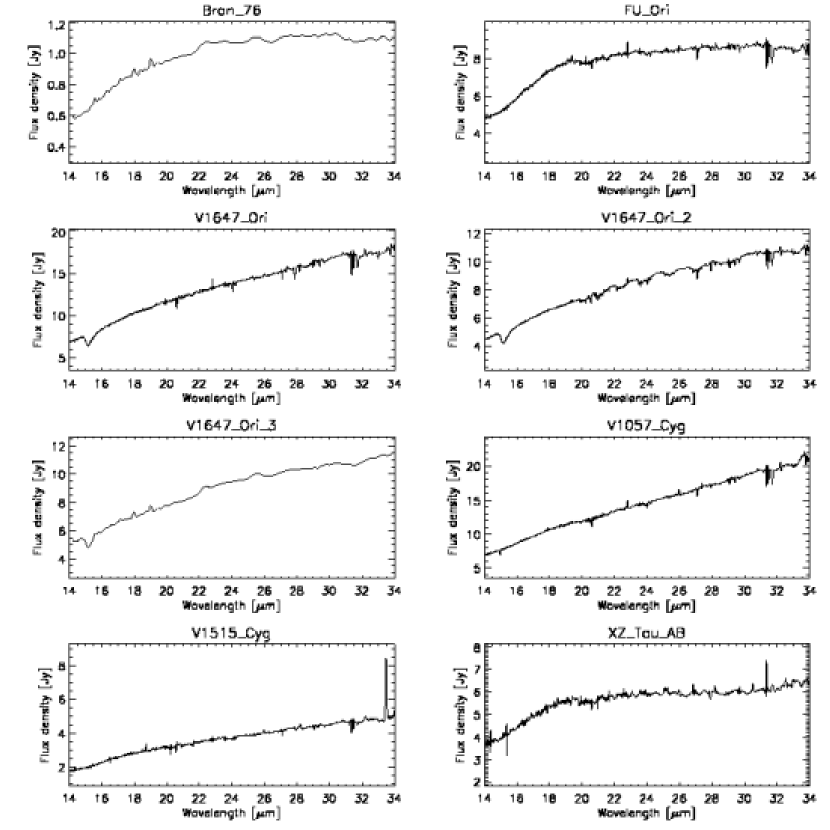
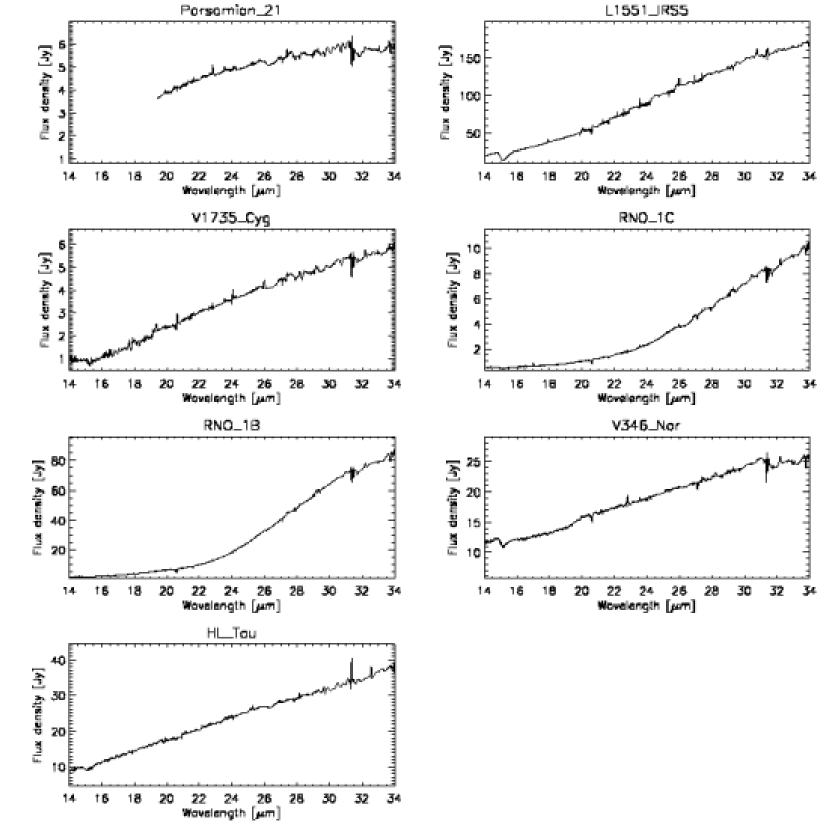
Figures 1-8 show the complete sample of spectra. For Bran 76 and the third observation of V1647 Ori only low-resolution Spitzer data were available. To increase the signal to noise, all Spitzer LH data and the SH data of V1735 Cyg were smoothed by a factor of three. Most of the yet remaining spikes in these spectra are not real but rather flux jumps between the different orders of the spectrographs. As mentioned in the introduction of this paper, parts of the data shown here were already published: Green et al. (2006) presented the Spitzer data for FU Ori, V1515 Cyg, V1057 Cyg, Bran 76, and V346 Nor and used disk-envelope models to explain the SEDs. The spectrum of HL Tau was shown by Bergin et al. (2005). Schütz et al. (2005) used the ISO data for Z CMa and V346 Nor to compare with their ground-based data. Finally, Larsson et al. (2000) showed the ISO/SWS SEDs of the outbursting object OO Ser and used the ISO/SWS data for RNO1B, Z CMa, V1057 Cyg, and V1735 Cyg for comparison.
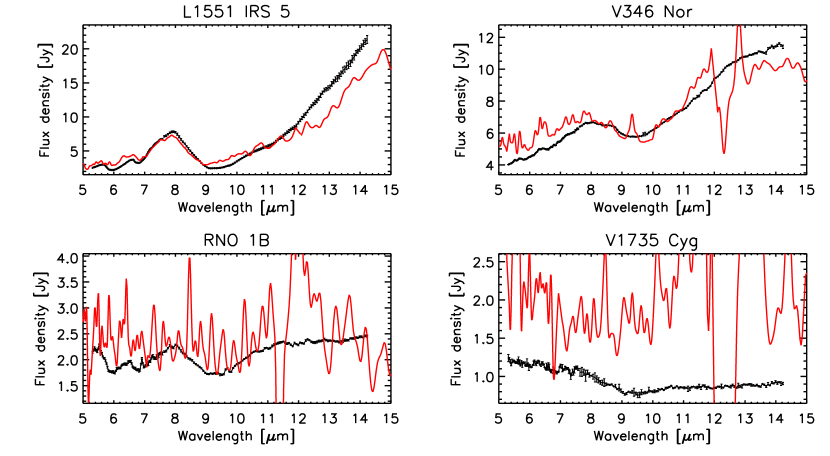
Unfortunately, for most objects the quality of the ISO/SWS data is significantly worse than that of the Spitzer observations. Even after the data have been rebinned to a spectral resolution of 100, artefacts, i.e. potential emission features that were only detected either during the up- or the down-scan, remain in the spectra. In Figure 9 we show data for four objects that were observed with both Spitzer and ISO. In particular, for the objects with lower flux levels the noise in the SWS data is significant. The reason for this is the short integration time for most objects which is reflected in the speed parameter in Table 1. In consequence, the ISO data are mainly used for qualitative statements rather then for quantitative analyses throughout the rest of the paper. Only the ISO data for Z CMa (with a high flux level) and Reipurth 50 (with long integration time) will be examined in more detail in one of the consecutive sections. The data on Reipurth 50 is published for the first time.
From Figures 1-8 it becomes clear that for all objects the flux densities increase toward longer wavelengths indicative of warm dusty material surrounding all objects. However, Figures 1, 2, 5, and 6 show that there are striking differences within the group of FUors: While some objects show a silicate emission feature in the 10 m region, other objects show deep absorption profiles. Since other spectral features do further support such a differentiation we will in the following distinguish the objects via the behavior of their 10 m feature and discuss the two categories separately in the following subsections. A complete overview of the most prominent spectral features between 3 and 16 m is given in Table 3. If we count in V883 Ori, which was observed by Schütz et al. (2005), and disregard XZ Tau and HL Tau, then 9 FUors show the silicate feature in absorption while 6 FUors show silicate emission.
3.2 Objects with 10 m emission
3.2.1 Qualitative analysis of the 10 m region
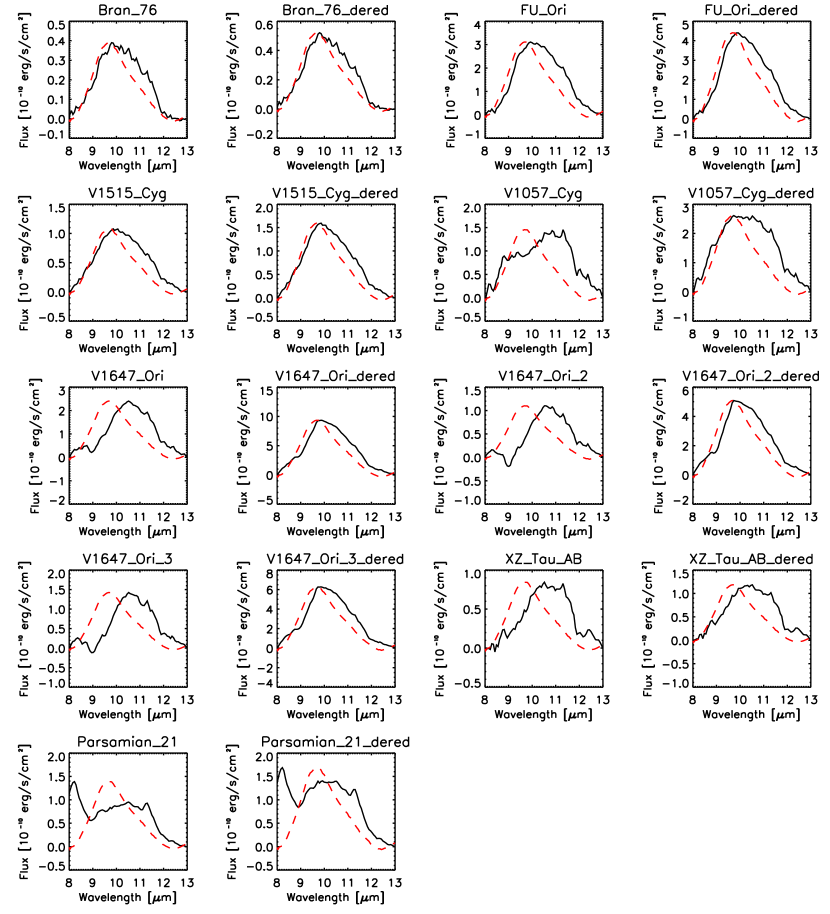
In Figure 10 we compiled all objects showing signs of silicate emission in the 10 m band. To subtract the underlying continuum we fitted a polynomial of first order to the flux at 8 and 13 m444For Parsamian 21 we had to shift the left point of the fit to 6.6 m due to the special shape of the spectrum (see below).. As we are thus far only interested in a qualitative comparison among the various objects, the exact shape of the continuum is not important and higher oder polynomial fits did not alter the results relative to each other. For comparison we overplot the silicate emission feature of typical interstellar medium (ISM) dust grains, scaled to the observed spectra (red, dashed lines in Figure 10; Kemper et al., 2004). We note that the spectrum of each object is shown twice: While the first plot shows the observed spectrum of the source, the second one shows the dereddened spectrum. For the dereddening we compiled optical extinction values from the literature (see caption of Figure 10) and used the extinction law described in Mathis (1990) to derive corresponding extinction values for the MIR. It is assumed that all of the extinction is caused by material in the line of sight toward the objects and that no self-shadowing effect (e.g., by an inclined accretion disk with a certain flaring angle) is present. The continuum was fitted for the dereddened spectra separately. It shows that for most objects the extinction is not negligible and that it can have substantial influence on the shape of the silicate feature (see, e.g., V1057 Cyg and V1647 Ori). For a fair comparison it thus seems reasonable to evaluate the dereddened and not the observed spectra.
At first glance, when comparing the spectra, it is noteworthy that all emission features differ from the typical shape of the typical ISM dust feature. Green et al. (2006) stated that the emission peak for the first four objects in Figure 10 was close to 9.5 m and that the dust features appeared to be pristine555It should be mentioned that Green et al. (2006) determined the underlying continuum from a fit to the 6 - 8 m region and not as we did from fitting a straight line between 8 and 13 m.. We find that all features peak longward of 9.7 m (the typical peak position for ISM type dust; Kemper et al., 2004) and that they show additional flux excess compared to the ISM feature at even longer wavelengths. This indicates that dust grain processing has already set in. Furthermore, it should be noted that the spectrum of Parsamian 21 looks significantly different compared to the others. The most prominent characteristic are strong emission bands around 8.2 m and probably also around 11.3 m from polycyclic aromatic hydrocarbons (PAHs). Polomski et al. (2005) already suspected the existence of PAH emission in the spectrum of this source based on ground-based observations, but a firm confirmation was thus far lacking. We discuss the spectrum of Parsamian 21 in more detail below.
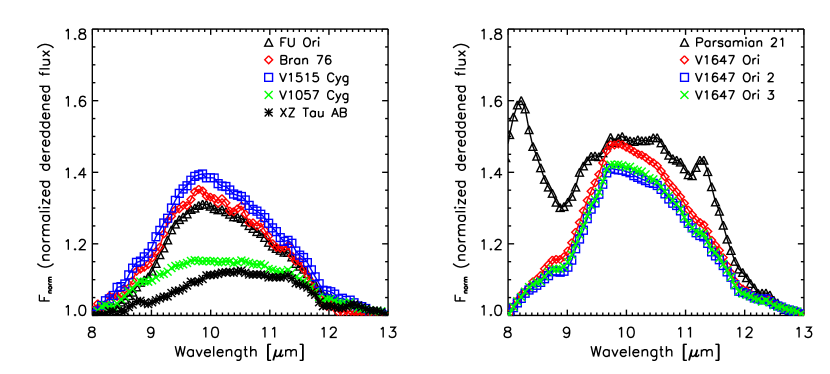
For a better comparison of the emission features, we plotted in Figure 11 the normalized fluxes of the objects between 8 and 13 m. Following van Boekel et al. (2005), the normalization was done via
| (1) |
where is the observed flux, is the continuum flux and denotes the mean value of the underlying continuum in the considered wavelength regime. This normalization ensures that the shape of the emission feature is preserved. From Figure 11 it becomes clear that the emission features of Bran 76, FU Ori, and V1515 Cyg are quite similar in terms of shape and strength. The features of V1057 Cyg and XZ Tau are far less pronounced and much broader666In contrast to our analysis Green et al. (2006) found the feature of V1057 Cyg to be comparable in shape (and thus in dust composition) to those of Bran 76, FU Ori, and V1515 Cyg.. The emission profiles of V1647 Ori and Parsamian 21 are slightly stronger than those of the other objects and, as mentioned above, the latter object is the only one showing strong PAH emission bands. The three epochs of data for V1647 Ori allow us to study the variability of this object in the 10 m region over a period of approximately five months. Figure 11 shows that between October 2004 (epoch 1) and mid of March 2005 (epoch 2) the flux level decreased significantly. At the third epoch (end of March 2005) the flux appears to have slightly increased again (see also Figure 5). The overall shape of the feature during the six months period did, however, not change.
To put these results in a broader context with other young objects and to get a first idea on the dust grain properties, we plot in Figure 12 the flux ratio at 11.3 and 9.8 m against the computed peak over the continuum in the normalized spectra, i.e., the maxima of equation (1). This figure also shows the region typically occupied by young TTauri stars and the slightly more massive Herbig Ae/Be stars (see, e.g., Przygodda et al., 2003; van Boekel et al., 2003, 2005; Kessler-Silacci et al., 2006). We find that the objects presented here tend to have in general a relatively weak peak over continuum emission and a flux ratio between 0.8 and 1.0. While the strength of the peak over the continuum is interpreted as a tracer for grain sizes (with higher peak values denoting smaller grains), the flux ratio is a more general tracer for grain processing, i.e., grain growth as well as crystallization. This is explained by the fact that not only the growing of grains leads to a broader and flatter silicate feature between 9.8 and 12.0 m (Bouwman et al., 2001), but also the crystallization process introduces distinct emission peaks of forsterite and enstatite longward of 10 m (see, e.g., van Boekel et al., 2005). Taking these considerations into account, we find that our sample shows clear evidence for grain growth and dust processing. For a more quantitative analysis of the dust composition we fitted a dust model to the data as explained in the following subsection.
3.2.2 Dust composition
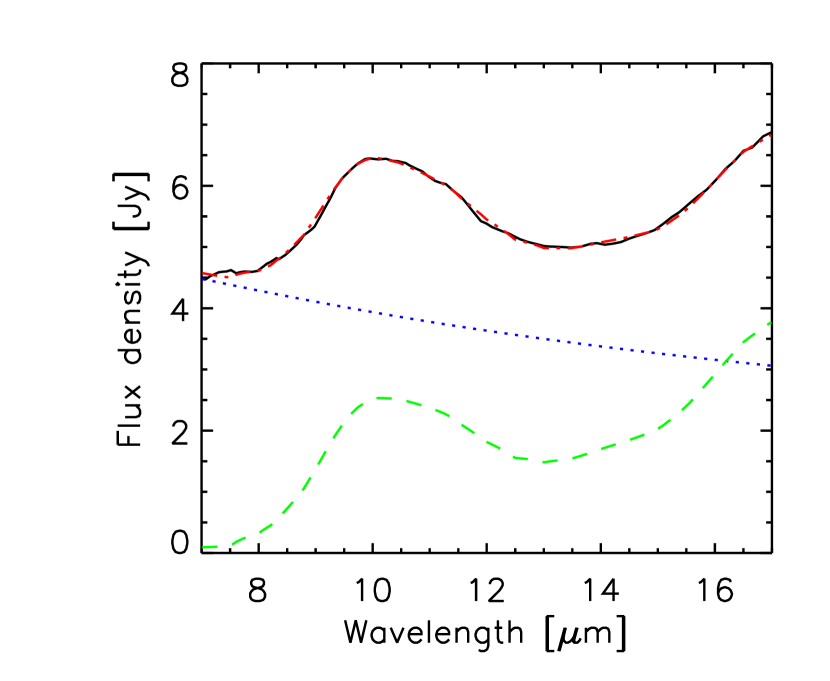
In Figure 13 we fitted an analytical dust model to the spectrum of FU Ori between 7 and 17 m. To equally weight the low- and high-resolution part of the spectrum, we rebinned the data to a spectral resolution of 100, still sufficient to disentangle contributions from different dust species. Instead of fitting a two component model to the data, with one temperature for the underlying continuum and one temperature for the emission layer, as we did in Quanz et al. (2006), we use a new model described in Juhász et al. 2007 (to be submitted). In this model the temperatures for the disk midplane, the disk surface layer and an inner disk rim are fitted by powerlaw distributions instead of single black body temperatures. In this respect, the model represents more realistically the temperature distribution in a protoplanetary disk. The input parameters for the model were taken from the simple accretion disk model in Quanz et al. (2006). Table 4 summarizes the fitted parameters of the individual temperature components.
The dust model was based on opacities for six dust species (amorphous olivine and pyroxene, crystalline forsterite and enstatite, silica, and amorphous carbon) in three grain sizes (0.1, 1.5, and 6.0 m). References for the optical properties of the grains are given in Juhász et al. 2007 (to be submitted) and Quanz et al. (2006). In contrast the analysis presented in Quanz et al. (2006), this time we included also carbon grains in the fit. However, as shown in Figure 13 and summarized in Table 5, the best fit ( = 45.3) does not require any carbon grains. The derived mass fractions agree well with the results based on the more simple two component dust model used in Quanz et al. (2006). While a large fraction of big, amorphous grains contribute to a high-temperature continuum, the smaller grains are responsible for the observed emission feature. Still, we emphasize that, according to our analysis, also in the disk surface layer large grains are present: Comparing the derived composition to that of the interstellar medium (Kemper et al., 2004; van Boekel et al., 2005), we find a significantly higher fraction of 1.5 m grains in the dust of FU Ori. Furthermore, the model does predict a negligible amount of crystalline grains ( 0.01), no silica dust and, as mentioned above, no carbon grains. Certainly, the values for the derived mass fractions should not be taken literally, as, for instance, the temperature structure in the disk and the dust opacities are not perfectly known. However, the models presented here and in Quanz et al. (2006) agree on two very important aspects: (1) there is clear evidence for dust coagulation in the spectra of FUors, and (2) there is hardly any contribution from crystalline grains detectable in the data. This lack of crystalline grains was already noticed and discussed in Quanz et al. (2006), but we will reinvestigate this issue below.
3.2.3 The PAH features of Parsamian 21
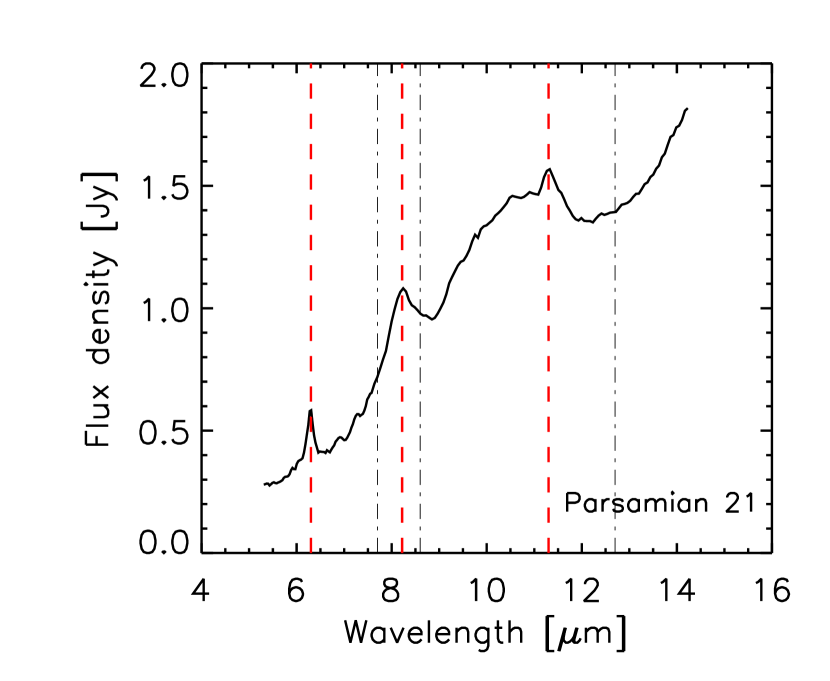
As its features are significantly different than those of the other FUors, we plot in Figure 14 the dereddened spectrum of Parsamian 21 and analyze it in more detail. The vertical lines illustrate, where typically PAH emission bands are located. While prominent PAH emission is present at 6.3, 8.2 and (possibly) 11.3 m, no bands are seen at 7.7, 8.6 and 12.7 m. In addition, the spectrum bears signs of underlying silicate emission and it is difficult to disentangle in the 11.3 m emission band the possible contributions from crystalline forsterite and PAHs.
PAHs are commonly seen in the spectra of HAeBe stars (e.g., Meeus et al., 2001; Acke & van den Ancker, 2004; Sloan et al., 2005) and, more recently, PAH emission was also detected in TTauri spectra (Geers et al., 2006). However, the spectrum of Parsamian 21 differs significantly from the PAH spectra of other young objects: it shows a broad and strong feature at 8.2 m which is barely detected and the main characteristic of group C objects in Peeters et al. (2002). These objects show no PAH complex at 7.7 m and 8.6 m but the peculiar broad band at 8.2 m whose origin yet remains unknown (Peeters et al., 2002). In section 4.3 we will critically review the findings presented here and discuss their implications with respect to the FUor status of Parsamian 21.
3.2.4 Qualitative analyses of the 5 - 8 m region
As already noted and explained by Green et al. (2006) FU Ori, Bran 76, V1515 Cyg, and also V1057 Cyg show absorption bands of gaseous H2O at 5.8 and 6.8 m (Figure 5) coming from a collection of rotation-vibration bands.777Interestingly, already Sato et al. (1992) found evidence for water vapor absorption between 1 and 3 m in the spectra of FU Ori, V1515 Cyg, and V1057 Cyg, but also L1551 IRS 5, V1057 Cyg, and Z CMa. V1647 Ori, however, shows evidence for ice absorption bands at 6.0 and 6.85 m (see also Figure 20). We mention already here that this objects shows an additional ice feature at 15.2 m due to CO2 (Figure 19). V1647 Ori is the only object in the sample showing the 10 m silicate feature in emission accompanied by significant ice absorption bands. A more detailed analysis of these ice features is given in section 3.3. Finally, as we will discuss in the following section, Parsamian 21 shows clear evidence for a PAH emission feature at 6.2 m.
3.3 Objects with 10 m absorption
3.3.1 Analyses of the 10 m region
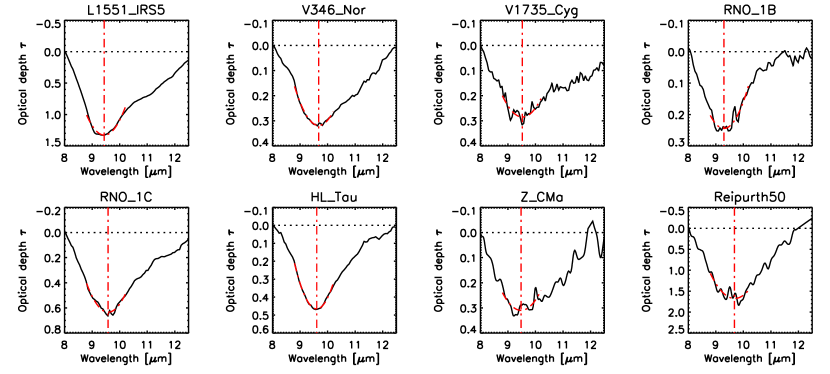
In Figure 15 we plot the optical depth in the 10 m region for the objects showing the silicate band in absorption. To derive the optical depth, we fitted the continuum with a polynomial of first order to the observed spectra between 8 and 13 m, assuming that no absorption due to silicates is present at these wavelengths. Also here the exact shape of the continuum is difficult to estimate and any fit always carries uncertainties. However, even fits with higher order polynomials did not alter the results significantly and the main conclusions remained valid. Based on the assumed continuum we then computed the optical depth using
| (2) |
where is the observed flux and the assumed continuum. To derive the wavelength position and value of the maximum optical depth, we did the following: As some spectra are quite noisy (e.g., V1735 Cyg, RNO 1B, Z CMa, and Reipurth 50) we fitted the data between 8.8 and 10.2 m, i.e., the region with the greatest optical depth, with a polynomial of second order (shown as red, dash-dotted lines in Figure 15). The wavelength position of the maximum optical depth (vertical, red, dash-dotted lines in Figure 15) and the corresponding value are then derived from the fit. From the spectra with a high signal to noise ratio and strong absorption profiles (e.g., the Spitzer spectra of L1551 IRS 5 and HL Tau) it becomes clear that the fit matches the shape of the absorption feature quite well and that this approach seems reasonable. The black, dotted horizontal line in Figure 15 shows the assumed continuum level. In Table 6 we summarize the derived maximum optical depth for each object and the corresponding wavelength. We give also values for the extinction in the silicate band Asilicate and estimates for the corresponding extinction in the optical AV. Asilicate was derived via
| (3) |
The errors for and Asilicate are based on the 1- uncertainties in the spectra and the resulting fluctuations of the polynomial fit. AV and its error are derived from averaging over the extinction models of Mathis (1990) and Weingartner & Draine (2001) and assuming two different values of RV for each model (RV = 3.1 and 5.0 for Mathis (1990) and RV = 3.0 and 5.5 for Weingartner & Draine (2001)). As already noted by Cohen & Kuhi (1979) one has to be careful when deriving a value for the optical extinction based on the silicate feature, as uncertainties in the underlying continuum and unknown dust compositions influence the results. Hence, for comparison, Table 6 gives also values for AV found in the literature. One has to keep in mind, though, that also here certain assumptions have been made and partly different observing techniques were applied potentially leading to discrepancies in the derived values for AV.
For V346 Nor and RNO 1C the values for AV agree quite well. Also for Z CMa, Reipurth 50 and L1551 IRS 5 the values are in general agreement. Due to the high extinction toward the latter two objects, a good estimate of AV is difficult. We would like to point out, however, that a value of AV 150 mag for L1551 IRS 5 as found by Campbell et al. (1988) and mentioned, for instance, by Stocke et al. (1988), White et al. (2000) and Fridlund et al. (2002) appears to be an overestimate. In yet unpublished NIR data taken with the Omega2000 camera at the Calar Alto Observatory (Spain) we do see a near-infrared (NIR) counterpart to the L1551 IRS 5 system with KS 9.7 mag. Even if this was purely scattered light from a disk the intrinsic K magnitude of the central object(s) (it might be a multiple system) can not be lower. Thus, the observed K-magnitude is a lower limit for the intrinsic K-luminosity of the source. The above mentioned value for AV would translate into A 15 mag, and thus the absolute K-band magnitude of L1551 IRS 5 would be mag for an assumed distance of 140 pc. For young low-mass objects this appears to be definitely too luminous even if accretion luminosities are taken into account as well. For V1735 Cyg and HL Tau our derived values for AV are lower than those found in the literature. However, for V1735 Cyg no errors are given for the value found in the literature. For HL Tau the optical extinction derived from the radiative transfer model by Men’shchikov et al. (1999) may suffer from insufficient information about the source geometry or dust opacities which can easily lead to large uncertainties in the computed figures. The comparison for these objects clearly shows that, in particular for embedded objects, it is difficult to derive consistent values for AV if different techniques are applied.
Finally, RNO 1B also shows a discrepancy between our value for AV and that given by Staude & Neckel (1991). In this case, however, the silicate absorption feature bears evidence for additional superposed emission as will be described in the next paragraph. Thus, we attribute at least part of the missing optical depth to an underlying silicate emission feature.
To measure not only the depth of the absorption profile, but to get also an idea of the dust composition responsible for the observed absorption, we analyzed the shape of the silicate feature. In Figure 16 we show the optical depths computed or measured for different dust grain compositions. Depending on the composition the wavelengths of the maximum optical depth changes. The most extreme cases are amorphous olivine grains with a size of 0.1 m peaking at a wavelength slightly longward of 9.7 m, and amorphous pyroxene grains with the same size peaking around 9.2 m wavelength. As mentioned above, in Table 6 we already give the wavelengths of the maximum optical depths observed toward our sources and it shows that there is indeed a broad range of values, indicating different dust compositions.
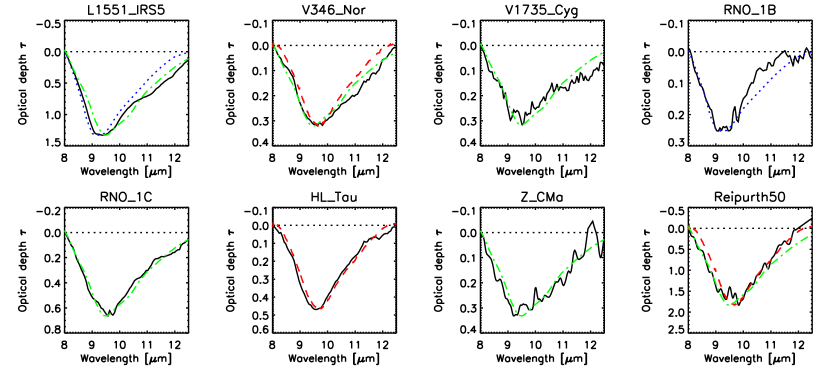
In Figure 17 we plot again the observed optical depth of our objects as shown in Figure 15, but now we overplot one or two of the absorption profiles presented in Figure 16, scaled to the maximum observed optical depth. Whether this scaling is appropriate is difficult to determine but it shows that most observed features agree reasonably well with one or two of the reference profiles. Three objects (L1551 IRS 5, V346 Nor and V1735 Cyg) show additional absorption longward of 11 m when compared to the dust features, but at least part of this absorption can be attributed to H2O libration bands (e.g., Pontoppidan et al., 2005). V1735 Cyg, RNO 1C and Z CMa seem to agree best with the dust model computed by Draine (2003) based on the particle size distribution from Weingartner & Draine (2001). V346 Nor requires shortward of 10 m a mixture of the same model and the dust composition observed toward the galactic center (Kemper et al., 2004). Longward of 10 m the former model alone fits better. For Reipurth 50 a combination of both models explains the data well over the whole wavelength regime with the Draine (2003) model fitting the short and the Kemper et al. (2004) model fitting the long wavelength part. L1551 IRS 5 is best fitted with a mixture of small, amorphous pyroxene grains and the model from Draine (2003). The profile of HL Tau agrees extremely well with the galactic center dust profile from Kemper et al. (2004). To account for a small shift toward shorter wavelengths a little bit more amorphous pyroxene seems to be required or small uncertainties in the position of the peak absorption from the continuum fit can explain this shift. Finally, the absorption profile of RNO 1B is special in two ways: First, the short wavelength range is best fitted solely with small, amorphous pyroxene grains. And secondly, between 10 and 11.5 m the profile shows a significantly lower optical depth than any of the reference profiles. In combination with our findings for the visual extinction (see above) this suggests that RNO 1B shows silicate emission superposed on the absorption feature. Interestingly, the apparent decrease in optical depth longward of 10 m indicates that at these wavelengths the contribution of the emission is relatively larger compared to the other wavelengths in the silicate band. This in turn means that the emission profile does not have the typical shape of the ISM dust feature but a broader and more evolved profile like the other FUors emission profiles shown in Figure 10.
3.3.2 The 15.2 m CO2 ice feature
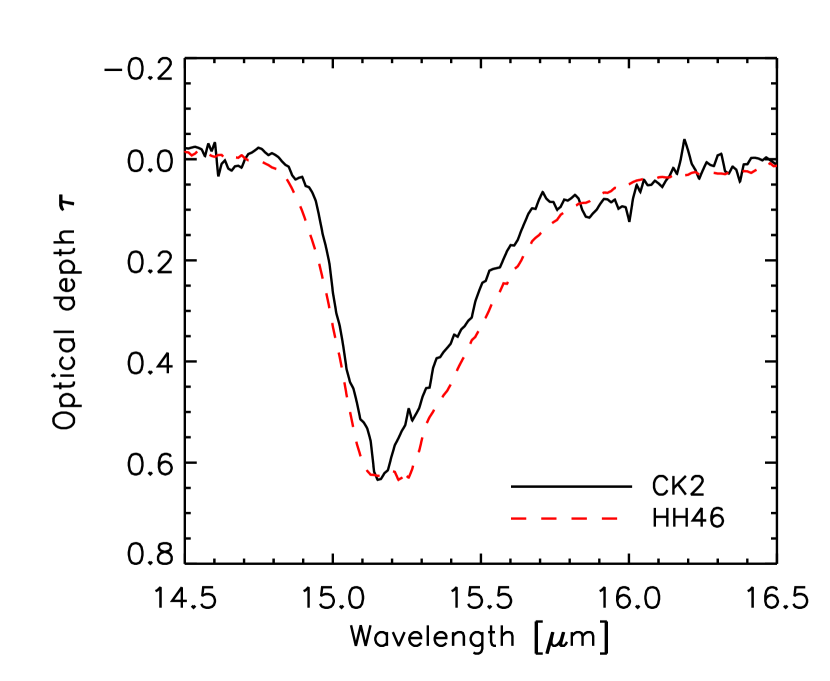
The shape of the bending mode profile of CO2 ice around 15.2 m does not only allow a detailed analysis of the involved ice inventory, but it enables us to derive information about potential ice processing due to heating effects (e.g., Pontoppidan et al., 2005). In Figure 18 we present two reference cases which we will use in the following as a benchmark for comparison with the FUor spectra. The first object in Figure 18 (CK2) is a highly extincted background star behind the Serpens dark cloud (Knez et al., 2005), and the second object (HH46) is an embedded low-mass protostar (Boogert et al., 2004).
While the spectrum of CK2 probes mainly the ice composition of the intervening dark cloud, the spectrum of HH46 bears information about the immediate environment of the young star. Apart from being slightly broader, the spectrum of HH46 shows a double-peaked sub-structure which is caused by crystallization and effective segregation of the CO2 and H2O ice involved in the absorption. These processes take place when ice mixtures with concentrations of CO2/H2O1 are heated (Boogert et al., 2004). In space, this phase transition from amorphous to crystalline ice is expected to occur between 50-90 K and thus at higher temperatures than typically found in cold, dark molecular clouds. Thus, the 15.2 m ice feature of HH46 shows that (at least) part of the ice must already have been heated by the embedded protostar. In fact, Boogert et al. (2004) fit the feature with a two-component ice model based on laboratory spectra with one component being highly processed polar ice with a laboratory temperature of Tlab = 125 K, and the other component being an H2O-rich, CH3OH-deficient cold ice with Tlab = 10 K.888The presence of CH3OH in the ice feature can potentially be traced by the shape of the long-wavelength wing of the CO2 profile showing additional absorption if CH3OH is present in higher abundances. The spectrum of CK2 was fitted by Knez et al. (2005) solely with cold ice components. They used a polar mixture of H2O:CO2=1:1 and H2O:CO2=10:1 at 10 K with a ratio of 2:1 and an additional apolar component of CO:N2:CO2=100:50:20 at 30 K. The overall polar fraction was assumed to be 78 %.
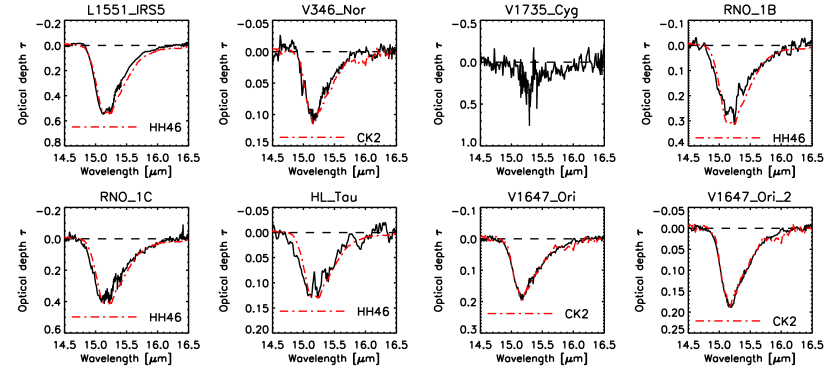
In Figure 19 we present the 15.2 m features observed toward our FUor sample. To derive the optical depths we fitted the continuum with a straight line fixed around 14.65 and 16.3 m. For each object we overplot either the (scaled) spectrum of HH46 or CK2 depending on the shape of the profile. While the profiles of V1647 Ori and V346 Nor agree better with the profile of CK2 (the spectrum representing unprocessed ice), L1551 IRS 5, RNO 1B and 1C, and HL Tau show evidence for a double-peaked sub-structure and thus heating effects and processed ice. The comparatively bad quality of the V1735 Cyg spectrum does not allow a solid comparison to either reference spectrum. It is noteworthy that the spectrum of V1647 Ori is almost an exact copy of CK2 indicating that the ice composition is mostly identical. Based on the fitted reference spectrum we computed also the optical depth for each object and summarized the results in Table 7. The errors are based on the 1- uncertainties in the observed spectra.
3.3.3 The 6.0 and 6.8 m ice features
Although frequently observed toward high- and low-mass sources, the two well-known ice features at 6.0 and 6.8 m are quite complex and difficult to interpret. Certainly, a large fraction of the optical depth of the 6.0 m band can be attributed to H2O ice, but also other species might contribute to this absorption feature (Keane et al., 2001). For instance, slightly shortward, at roughly 5.85 m, an additional absorption shoulder is sometimes superposed (e.g., Pontoppidan et al., 2005; Keane et al., 2001) for which formaldehyde (H2CO) and formic acid (HCOOH) are theoretical candidates. Without any additional information (e.g., the 3.08 m band of H2O or the 3.47 m band of H2CO) it is thus difficult to determine the true water ice content in the 6.0 m band.
An additional absorption feature at 6.85 m is often observed toward protostars (e.g., Keane et al., 2001), but also toward the extincted background star CK2 (Knez et al., 2005) and the edge-on disk CRBR 2422.8-3423 (Pontoppidan et al., 2005). Although a final identification of this band has yet to be provided, NH seems to be one of the most promising candidates (Schutte & Khanna, 2003; Pontoppidan et al., 2005). However, van Dishoeck (2004) for example, mention also methanol (CH3OH) as a potential carrier of this absorption band.
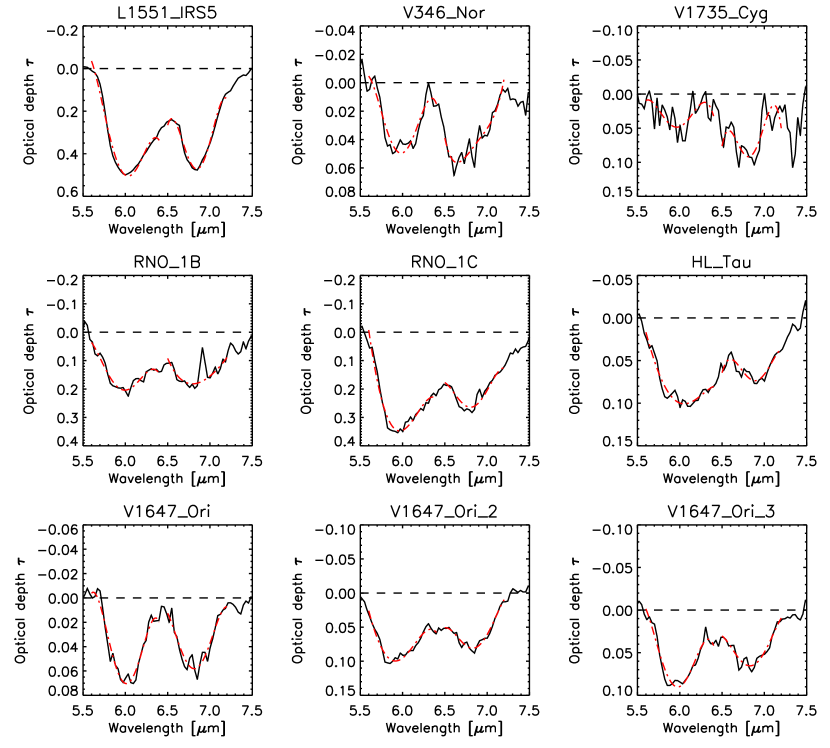
Given all these uncertainties we restrict ourselves in this section to the computation of the optical depth of both of the above mentioned absorption bands. Like in the previous section we assumed a straight line for the continuum anchored at 5.4 and 7.6 m. To derive the optical depths we then fitted a polynomial of fourth order to both absorption dips to eliminate the noise in the spectra. Figure 20 shows the observed spectra between 5.5 and 7.5 m on an optical depth scale (black lines) with the resulting fits overplotted (red, dashed-dotted lines). The computed optical depth for each band and each object is given in Table 7. Like in the previous section the errors are based on the 1- uncertainties in the observed spectra.
3.4 The fading of OO Ser and V1647 Ori
For two objects (OO Ser and V1647 Ori) we have multi-epoch data and can derive some conclusions on the variability of these objects. As illustrated in Figure 4, we fitted a straight line to the data of OO Ser between 15 and 30 m to estimate the decay in flux density observed over the 5 epochs (see, Table1). The wavelength range was chosen as in this regime all spectra are still relatively clear of artefacts and spikes partly seen at longer wavelengths. In Table 8 we summarize the flux density level at 20 and 30 m at each epoch and give also the slope measured between 15 and 30 m. The errors are derived from the goodness of the fit to the data. Between the first observations on April 14, 1996, and the last observations, carried out September 22, 1997, the flux densities decreased to roughly 50% of the initial values. These data demonstrate that OO Ser faded rapidly over relatively short timescales and that it might be an intermediate object between a typical FUor and an EXor having fading timescales of several decades and months, respectively. Based on photometric monitoring at infrared wavelengths, Kóspál et al. (2007) came to a similar conclusion and predicted that OO Ser should return to its pre-outburst luminosity not before 2011.
In Table 8 we also summarize the flux densities of V1647 Ori observed at 8, 20 and 30 m at three different epochs. The errors are taken directly from the Spitzer spectra. It shows that also this object faded significantly over a period of less than 5 months between October 2004 and March 2005. In addition, short time variations in the flux levels seem to be present, as between the two epochs in March 2005 the object became slightly brighter again. In consequence, these data support the assumption that the outburst of V1647 Ori may also be intermediate between FUor- and EXor-type events similar to OO Ser (Muzerolle et al., 2005; Acosta-Pulido et al., 2007).
3.5 Additional emission lines
For completeness we show in Figure 21 absorption and emission lines identified in the high-resolution regime of the Spitzer spectra, part of which are difficult to identify in Figures 7 and 8. Already Green et al. (2006) noted the [S III] emission lines at 18.7 and 33.4 m in the spectrum of V1515 Cyg and argued that they originate from extended emission in the region and not from the object itself. The spectra of RNO 1B and RNO 1C show evidence for H2 quadrupole emission around 17 m and additional H2 lines in the low-resolution part of the spectrum at shorter wavelengths. In Quanz et al. (2007) we analyzed these emission lines in detail and concluded that they are related to shocks within a molecular outflow powered by the nearby embedded object IRAS 00338+6312. [Fe II] lines around 17.9 m are present in the spectra of L1551 IRS 5 and RNO 1B, and L1551 IRS 5 shows also the [Fe II] line near 26.0 m. The [Fe II] lines of L1551 IRS 5 were already detected in the ISO/SWS spectrum of this source and attributed to hot and dense material located close to the root of the outflow (White et al., 2000). The line intensities did not fit the predictions from shock models. Concerning the [Fe II] line in the spectrum of RNO 1B, it seems likely that it arises in the outflow shocks that also excite the H2 emission lines discussed in Quanz et al. (2007). Finally, V1057 Cyg shows gaseous CO2 absorption slightly shortward of 15.0 m.
4 Discussion
4.1 Two categories of FUors
The results presented here suggest that the sample of FUors can be divided into two categories based on the observational appearance of the 10 m silicate feature. We decided to call the absorption feature objects ”Category 1”-FUors (9 objects in Table 3) and the emission feature objects ”Category 2”-FUors (6 objects in Table 3). In the following we discuss the properties of the two categories in more detail.
4.1.1 Category 1 FUors: silicate and ice absorption features
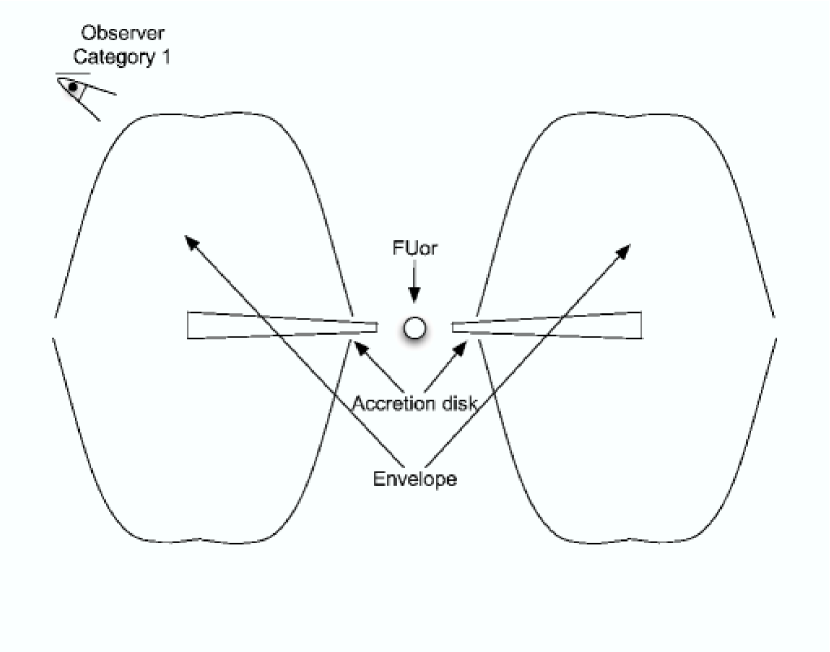
In general it is possible to observe the silicate feature in absorption if the circumstellar disk surrounding a young object is seen close to edge-on. Men’shchikov & Henning (1997) showed that typically for a disk with an opening angle of 20∘ between the upper and lower disk surface the silicate feature appears in absorption only if the disk inclination is from edge-on. Given the amount of objects showing silicate absorption compared to the number of objects with silicate emission and assuming a random distribution of the orientation of the accretion disks, it is unlikely that all Category 1 FUors are seen edge-on. Rather, these objects are still more deeply embedded in their molecular envelopes covering a larger solid angle than the edge-on disk alone. These envelopes cause the ice and dust absorption features.
Figure 17 illustrates that all but one silicate absorption bands are fitted best either with the silicate composition observed toward the Galactic center by Kemper et al. (2004) or with the astronomical silicates from Weingartner & Draine (2001) and Draine (2003)999L1551 IRS 5 requires a fraction of additional amorphous pyroxene grains.. This finding shows that all absorption features can be fitted with small, amorphous silicates and hence the extinction is caused by pristine and not processed dust. Only the spectrum of RNO 1B is difficult to fit with any ISM dust compostition, but, as already mentioned, there are strong hints that the absorption feature is altered by a superposed emission feature.
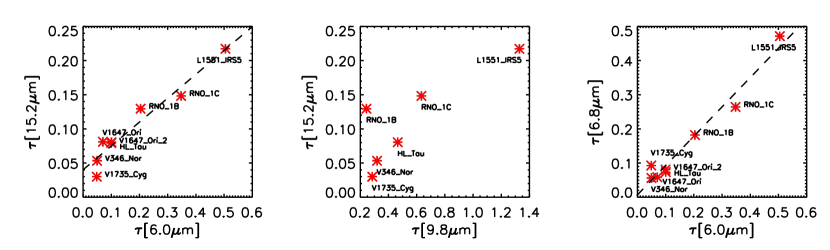
In Figure 22 we show the observed optical depths of the ices and the silicate feature in a scatter plot to search for any correlation. Although the range of optical depths we probe here is limited, it seems that at least for the ices there seem to be correlations (left and right plot in Figure 22). Fitting a straight line to the data we find:
| (4) |
| (5) |
This implies that the physical and chemical conditions within the envelopes and clouds causing the absorption are similar. A more detailed analysis, e.g., the determination of different ice abundances relative to water ice, is beyond the scope of this work. For such an analysis the water ice feature around 3 m is required as it suffers less from additional contributions of other ice species compare to the 6 m feature.
For a correlation between the optical depths of the silicates and ices the situation is slightly different because, as we have already pointed out, the silicate feature can be influenced by superposed emission. This shows nicely in the middle plot in Figure 22, where RNO 1B is shifted with respect to the other objects.
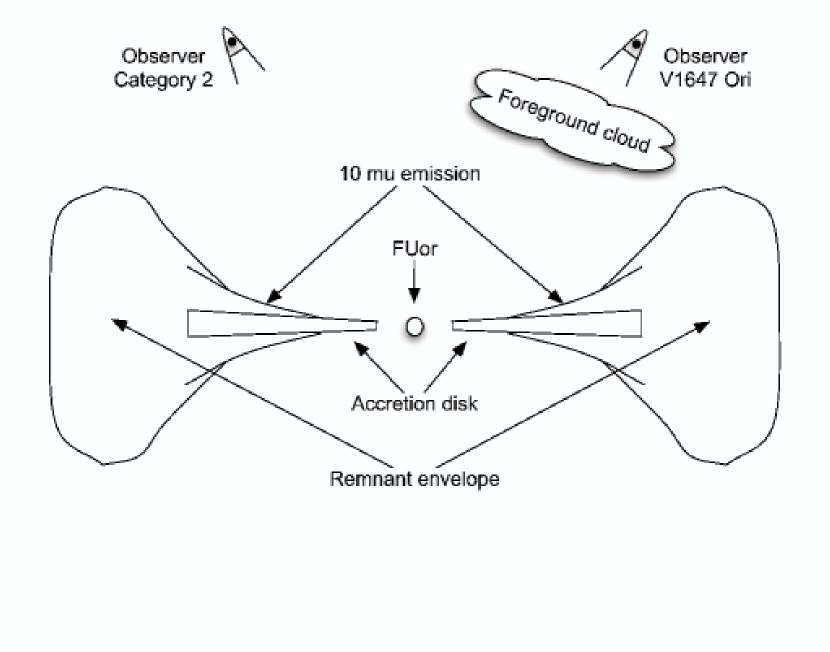
Finally, it is interesting to note that the objects showing evidence for ice processing in Figure 19 tend to show higher optical depths in the ice features than the other sources. This might suggest that the extinction for the latter objects (V346 Nor, V1735 Cyg) might be caused by ices somewhere in the line of sight to the source, rather than by material related to the young star. This might also explain why V1647 Ori shows weak silicate emission, but ice absorption: the extinction is caused by cold foreground material, reflected also in the observed high value for AV (see caption Figure 10). Ground-based observations find the spectrum to be flat in the 10 m regime (Ábrahám et al., 2006). However, the sensitivity of Spitzer allows the detection of a weak feature resulting from an extinguished but intrinsically strong silicate emission band.
4.1.2 Category 2 FUors: the silicate emission feature and its dust composition
As presented in Figure 10 and described in the related section, the emission profiles bear evidence for dust grain processing. Even after the correction for apparent interstellar extinction, the shape of the silicate profile differs from that of typical ISM dust. Like for TTauri stars and the slightly more massive HAeBes, the origin of the emission feature in the spectra of the FUors is the heated surface layer of the accretion disk. The apparent grain processing is believed to be only possible in circumstellar disks and not in he less dense circumstellar envelopes. While the emission layer for TTauri stars and HAeBes is mainly heated be the central stellar object, for FUors the hot inner parts of the accretion disk itself can act as the main illuminating source (e.g., Lachaume, 2004). Due to the high accretion rates of FUors those inner regions are extremely hot and account for a significant fraction of the total flux even at optical wavelengths (Quanz et al., 2006). Furthermore, accretion disk models with a flared geometry were not only able to explain the SEDs of FU Ori and Bran 76 (Green et al., 2006), but they could also reproduce interferometric observations in the NIR (Malbet et al., 2005) and MIR (Quanz et al., 2006). V1057 Cyg and V1515 Cyg show more emission at longer infrared wavelengths than the previous objects, which can be accounted for assuming a remnant infalling envelope in addition to the accretion disks. This is supported by the results from K-band interferometry Millan-Gabet et al. (2006), where envelopes are required to explain the low NIR visibilities.
Concerning the dust composition it is interesting to note that, given the low peak-over-continuum ratio illustrated in Figure 12, grain growth must have already set in. This is supported by the results of our dust model fit. Furthermore, the spectra do not show evidence for crystalline dust particles. The mass fraction of crystalline particles in the dust model computed for the spectrum of FU Ori was negligible (see, Table 5). Since strength and shape of the silicate feature of FU Ori is comparable to those of Bran 76 and V1515 Cyg (Figure11), the dust composition in all objects is similar. The spectrum of V1057 Ori is even broader and less pronounced than the other spectra, indicating even larger grains in the disk surface layer. The intrinsic feature of V1647 Ori is stronger than those of the other FUors, but no prominent signs of crystalline silicates are present either.101010The spectrum of Parsamian 21 does show a prominent feature at 11.3 m but we attribute most of the related flux to PAH emission and not to crystalline silicates (see section 3.2.3).
As already mentioned in Quanz et al. (2006), there are several reasons for which stronger crystalline features could have been expected to be detected. The high disk accretion rates should ease the detection of crystalline particles in two ways: (1) high accretion rates lead to high disk temperatures (Bell et al., 1997) which in turn should increase the amount of crystalline particles produced by annealing processes at T800 K. (2) an increase in the accretion rate should also increase the radial and vertical mixing in the disk (Gail, 2001) transporting the crystalline particles farther out and to the disk surface, where they can be detected by means of MIR spectroscopy. However, neither in the innermost disk regions probed with MIR interferometry (Quanz et al., 2006) nor in the Spitzer spectra presented here in Figure 10 or at longer wavelengths in Figure 7 we see any striking evidence for crystallinity. This means, that either those grains do not exist in large amount in these disks or they are somehow hidden.
The disks of FUor objects are different from those of TTauri or Herbig star disks in the sense that in the radially innermost regions of FUor disks the luminosity is accretion dominated (TTauri and Herbig star disks are irradiation dominated everywhere). At larger radii, also FUor disks are irradiation dominated, albeit the main heating source may not be the central star itself, but rather the hot inner disk regions close to the star where accretion dominates (e.g., Lachaume, 2004). Disk regions that are irradiation dominated have a surface layer that is warmer than the underlying disk interior; such an ”inverted” temperature profile causes dust features to appear in emission. In the accretion dominated regions, the main heating source is the release of gravitational energy in the disk midplane. Here, the disk interior is at least as hot (and likely hotter) than the disk surface, causing dust features to be effectively hidden, or even to appear in absorption111111The gas absorption features between 5 and 8 m described in 3.2.4 likely originate in this hot disk region.. Thus, it is conceivable that there are significant amounts of crystalline silicates present in the hot inner disk regions of our targets, even if they do not show up prominently in the spectra.
But what about crystalline silicates further from the central object, in irradiation dominated regions? Given the high accretion luminosity in our objects it seems unavoidable that large amounts of crystalline silicates are produced in the innermost disk regions. In addition to this, crystalline silicates may be produced in situ at large radii in shocks (Harker & Desch, 2002) or electric discharges (Pilipp et al., 1998; Desch & Cuzzi, 2000). If the disk is well mixed in the vertical direction, the crystalline silicates should be present in the surface layer of the disk at large ( few AU) radii, and show up in emission, which they evidently do not (at least, to a much lesser extent than in many TTauri and Herbig Ae/Be star disks, which are more evolved). This inevitably leads to the conclusion that crystalline silicates are not abundant in the surface layer of FUor disks at radii of more than a few AU from the central object, contrary to expectations.
At this point, we have no proper explanation for this observation. In order to animate the discussion, we will post the following idea, but stress that at this point this is mere speculation. The crystalline silicates are not present in the surface layer at larger radii, but may be present in the disk interior, where they are expected to be formed by virtue of the processes mentioned before. Thus, we need to explain why the crystalline silicates do not get mixed in the vertical direction all the way to the disk surface. One possibility is that the crystalline particles are somehow less well coupled to the gas, possibly because they are more compact (or less ”fluffy”) than the unprocessed dust particles. This may cause the selective settling of crystalline dust. A second possibility is the following. The accretion rate in FUor objects is high, suggesting that the disk is still being supplied with fresh material from the maternal envelope. This material, which is thought to contain exclusively small, amorphous dust particles, will in part ”rain” onto the disk surface at larger radii. If the rate at which this material falls onto the disk is higher than the rate at which it is mixed through the disk in the vertical direction, the disk may be covered by a ”blanket” of pristine material, effectively hiding the more processed material present in the disk interior. It is unclear whether this idea can be harmonized with the observation that the dust we see at the disk surface has undergone significant grain growth. This issue clearly calls for a much more detailed and quantitative investigation, which is beyond the scope of the present work.
4.2 Unifying the two categories of FUors: An evolutionary sequence
The spectral properties of the sample presented here draw a rather inhomogeneous picture of the group of FU Orionis objects. However, as most of them are convincingly classified as FUors, they do share some common observational and physical properties. In the following, we present an idea, how the apparent differences can be explained within a unified paradigm of FU Orionis objects.
Already 20 years ago Herbig (1977) and Hartmann & Kenyon (1985) suggested that each FUor might undergo several outbursts. More recent theoretical models show that gravitational instabilities in the accretion disk, driven by continuing infall from a remnant envelope, can account for intense bursts of high accretion rates which are intersecting more prolonged, quiescent periods of low accretion (Vorobyov & Basu, 2006; Boley et al., 2006). After several of these outbursts have occurred within a time span of several 105 years, the envelope, which is the trigger of the disk instabilities, vanishes, and the object enters finally a state of permanently low accretion. If one relates this final phase to the classical TTauri phase of low-mass YSOs, then FUors are younger than classical TTauri stars as already pointed out by Weintraub et al. (1991) and Sandell & Weintraub (2001).
Kessler-Silacci et al. (2005) analyzed the 10 m silicate feature of 34 young stars and confirmed that the evolution of the feature of low-mass stars and the overall SEDs is similar to that of intermediate-mass stars: embedded objects, showing a pristine silicate band in absorption, evolve into objects showing a combination of silicate absorption and emission, and finally pure emission features appear, where dust processing leads to a broad range of shapes and strength. Since all these stages are represented in our sample, we believe that, indeed, the FUor-phase is the link between the embedded Class I objects and the more evolved Class II objects. In this context, the objects showing silicate absorption are younger and at the beginning of the period where subsequently numerous FUor outbursts will occur, while the objects showing pure emission features are more evolved and possibly near the end of their FUor period. As illustrated in Figure 23 the spectral indices of the emission objects are indistinguishable from Class II objects in Taurus (Furlan et al., 2006). In particular, the objects FU Ori and Bran 76 appear to be the most evolved objects, because, as mentioned above, their SEDs do not require the presence of a large remnant envelope. A nice example of an intermediate object is RNO 1B, where the dominating absorption feature is altered by the underlying silicate emission from the accretion disk. Figure 24 illustrates with simple sketches the main features of the the two categories of FUors. It should be mentioned that theoretically a Class II FUor seen close to edge-on might be interpreted as a Class I FUor. As outlined in 4.1.1 it is, however, statistically very unlikely that all of the Class I objects shown here are Class II FUors ”in disguise”.
One question arises, though. If FUors are younger than classical TTauri stars but do already show clear evidence for dust coagulation, then why do some classical TTauri stars show silicate emission features consisting purely of pristine and unprocessed dust? One possible explanation is linked to the high accretion rates of the FUors. It is believed that high disk accretion rates are related to a higher degree of turbulence and thus mixing in the disk. As a result, larger particles are coupled to the turbulent gas and mixed throughout the disk and to the disk surface, where they can be observed. Once the accretion rate, and hence the amount of mixing, drops, larger particles tend to settle to the disk midplane much faster than small particles, which remain in the disk surface layer. Thus, although large particles are present in the disk of a TTauri star, they might not reach the disk surface, and only the small grains produce a silicate emission feature. Again, as for the issue concerning the lack of crystalline grains, a more detailed theoretical modeling is certainly required to see to what extend this qualitative explanation is valid.
4.3 Parsamian 21 - intermediate mass FUor or Post-AGB star?
The strong PAH emission of Parsamian 21 is unique among the sample of FUors presented here, and the analysis rise serious doubts whether Parsamian 21 is indeed a member of this group. The initial classification was made by Staude & Neckel (1992) based on optical spectroscopy. These authors derived a spectral type of F5Iab, found a prominent P-Cygni profile in H and observed shock-induced emission in [O I], [N II] and [S II]. They also mention the detection of Li in their spectra, which, if present, does not seem to be significantly above the noise level in the data. New observations with higher spectral resolution and higher signal-to-noise would certainly be eligible. Although some of these features are commonly observed in FUors, they are not unique to this group of objects, as also HAeBes show, for instance, P-Cygni profiles in H. In addition, two of the main properties of FUors, an outburst in optical light and CO bandhead absorption profiles in the NIR (e.g., Hartmann & Kenyon, 1996), have not yet been observed for Parsamian 21. Looking at the immediate surroundings of Parsamian 21 in optical data from the Digitized Sky Survey121212http://archive.eso.org/dss/dss it is also striking that no dark cloud complex is linked to Parsamian 21 and hence no connection to a larger star-forming region is present.
To excite the PAH emission, sufficiently strong UV radiation is required. However, most FUors have a later spectral type than Parsamian 21 and lack, unlike TTauri stars, in general UV continuum excess emission (Hartmann & Kenyon, 1996). As mentioned above, the positions of the PAH emission bands are untypical for young stars and so far only 7 objects are known to show characteristics of PAH class C objects (Sloan et al., 2007) as defined by Peeters et al. (2002). Among these 7 objects only two presumably young stars (SU Aur and HD 135344) show the peculiar PAH band close to 8.2 m. All other PAH class C objects are post-AGB stars or red giants (Sloan et al., 2007; Peeters et al., 2002).
In addition, one of the Post-AGB stars from Peeters et al. (2002) and also HD 56126, a Post-AGB star with PAH and silicate emission (Hony et al., 2003), have the same spectral type as Parsamian 21. However, we should mention that Dibai (1969) and The et al. (1994) give a spectral type of A5Ve for Parsamian 21. This is too early for a typical FU Orionis object, but could also explain the PAH emission. Finally, the bipolar emission knots seen in H and [N II] in the optical spectrum of Parsamian 21 (Staude & Neckel, 1992), are also found in the bipolar outflows of evolved stars and ”pre-planetary” nebulae (e.g., in the ”Butterfly Nebula”, Solf, 2000). They are thus not only seen in young objects.
Based on these findings, we believe that the FUor status of Parsamian 21 is at least very questionable. Either this object represents an intermediate mass FUor object, suggesting that also stars in this mass regime undergo phases of enhanced accretion, or, and this appears even more likely, Parsamian 21 is not even a young object but an evolved star, sharing typical properties with Post-AGB stars.
5 Conclusions and future prospects
Our conclusions can be summarized as follows:
-
•
We presented the first coherent space based spectroscopic MIR study of 14 FUors observed with the Spitzer Space Telescope or the Infrared Space Observatory. The sample includes roughly two thirds of the known FUors or FUor candidates.
-
•
Based on the appearance of the 10 m silicate feature, we divided the sample into two categories: Category 1 objects show the silicate feature in absorption, and the spectra show additional absorption bands at 6.0, 6.8 and 15.2 m due to ices. Category 2 objects show silicate emission and (most of them also) indications for water vapor absorption at shorter wavelengths. Only one Category 2 object (V1647 Ori) shows ice absorption bands which we explain by foreground extinction and an intrinsically strong 10 m emission feature.
-
•
The silicate absorption is best explained with dusty and icy envelopes surrounding the Category 1 objects. Statistical reasons argue against all objects having accretion disks seen edge-on. The silicate emission of the Category 2 FUors arises from the surface layer of the surrounding accretion disks.
-
•
The shape of the silicate band of the Category 1 objects is in agreement with typical dust compositions of the ISM. For one object (RNO 1B) the shape of the feature and the decrease in optical depth longward of 10 m can be explained with a superposed emission feature.
-
•
Optical depths for the observed silicate and ice absorption bands were derived. We find an apparent correlation among the optical depths of the ices indicating similar environmental conditions for the objects. For the silicate feature, no correlation is expected.
-
•
Using different extinction curves we computed the optical extinction toward the objects based on the depth of the 10 m silicate features. The results are in agreement with values found in the literature, given the uncertainties in the dust models and for the optical extinction values in the references. For RNO 1B the derived value for AV is smaller than expected, indicating that on-top silicate emission might influence the optical depth at 10 m.
-
•
The emission profiles of the Category 2 objects show clear evidence for grain growth. Fitting a dust model to the spectrum of FU Ori reveals that, indeed, larger grains than typically observed in the ISM are required to explain the shape. As FUors are presumably younger than TTauri stars (see below), this indicates that grain growth sets in very early during disk evolution.
-
•
Despite the high accretion rates of the FUor accretion disks and the resulting higher disk temperatures and mixing rates, we find hardly any evidence for crystalline grains. So far we lack a clear explanation for this observational results and leave it to further investigations.
-
•
The two categories of FUors can be explained within a single paradigm, where Category 1 objects are younger and similar to Class I objects, while Category 2 FUors are more evolved and show already properties of Class II sources. This explanation is in agreement with theoretical models which expect FUors to undergo several outbursts before they enter the more quiescent classical TTauri phase. Thus, the FUor-phase might indeed be the link between Class I and Class II objects and common to most young low-mass stars.
-
•
For OO Ser and V1647 Ori the multi-epoch data allows an analysis of the post-outburst fading of the objects. Both objects fainted significantly over timescales of a few months, suggesting the outbursts might be intermediate between the long-lived FUor-eruptions and the short-lived EXor-type events.
-
•
Only one object (Parsamian 21) shows PAH emission similar to that often observed in Post-AGB stars. We find that most other observational data for Parsamian 21 can also be explained with the object being an evolved star. In consequence, the FUor-status for this object is questioned.
Based on these findings, future investigations might include the following points:
-
•
A complete MIR spectroscopic census of all known FUors would complement the data presented here and might help to derive conclusions concerning the duration of the FUor phase using statistical arguments.
-
•
Multidimensional radiative transfer models have not yet been applied to FUor accretion disk, but they are required to derive a coherent picture of the disk structure, including the emission layer.
-
•
Models for the dust evolution in accretion disks could try to explain quantitatively the observed large grain population and the apparent lack of crystalline silicates.
-
•
Finally, if our conclusions are correct, then some of the known low-mass Class I objects might be FU Ori objects hidden in a quiescent phase between two consecutive outbursts. The observational properties of these objects might be revisited to search for any indication of FUor properties.
References
- Ábrahám et al. (2006) Ábrahám, P., Mosoni, L., Henning, T., Kóspál, Á., Leinert, C., Quanz, S. P., & Ratzka, T. 2006, A&A, 449, L13
- Acke & van den Ancker (2004) Acke, B. & van den Ancker, M. E. 2004, A&A, 426, 151
- Acosta-Pulido et al. (2007) Acosta-Pulido, J. A., Kun, M., Ábrahám, P., Kóspál, Á., Csizmadia, S., Kiss, L. L., Moór, A., Szabados, L., Benkő, J. M., Delgado, R. B., Charcos-Llorens, M., Eredics, M., Kiss, Z. T., Manchado, A., Rácz, M., Almeida, C. R., Székely, P., & Vidal-Núñez, M. J. 2007, AJ, 133, 2020
- Bell et al. (1997) Bell, K. R., Cassen, P. M., Klahr, H. H., & Henning, T. 1997, ApJ, 486, 372
- Bergin et al. (2005) Bergin, E. A., Melnick, G. J., Gerakines, P. A., Neufeld, D. A., & Whittet, D. C. B. 2005, ApJ, 627, L33
- Boley et al. (2006) Boley, A. C., Mejía, A. C., Durisen, R. H., Cai, K., Pickett, M. K., & D’Alessio, P. 2006, ApJ, 651, 517
- Boogert et al. (2004) Boogert, A. C. A., Pontoppidan, K. M., Lahuis, F., Jørgensen, J. K., Augereau, J.-C., Blake, G. A., Brooke, T. Y., Brown, J., Dullemond, C. P., Evans, II, N. J., Geers, V., Hogerheijde, M. R., Kessler-Silacci, J., Knez, C., Morris, P., Noriega-Crespo, A., Schöier, F. L., van Dishoeck, E. F., Allen, L. E., Harvey, P. M., Koerner, D. W., Mundy, L. G., Myers, P. C., Padgett, D. L., Sargent, A. I., & Stapelfeldt, K. R. 2004, ApJS, 154, 359
- Bouwman et al. (2006) Bouwman, J., Lawson, W. A., Dominik, C., Feigelson, E. D., Henning, T., Tielens, A. G. G. M., & Waters, L. B. F. M. 2006, ApJ, 653, L57
- Bouwman et al. (2001) Bouwman, J., Meeus, G., de Koter, A., Hony, S., Dominik, C., & Waters, L. B. F. M. 2001, A&A, 375, 950
- Campbell et al. (1988) Campbell, B., Persson, S. E., Strom, S. E., & Grasdalen, G. L. 1988, AJ, 95, 1173
- Casali (1991) Casali, M. M. 1991, MNRAS, 248, 229
- Close et al. (1997) Close, L. M., Roddier, F., Northcott, M. J., Roddier, C., & Graves, J. E. 1997, ApJ, 478, 766
- Coffey et al. (2004) Coffey, D., Downes, T. P., & Ray, T. P. 2004, A&A, 419, 593
- Cohen & Kuhi (1979) Cohen, M. & Kuhi, L. V. 1979, ApJS, 41, 743
- Desch & Cuzzi (2000) Desch, S. J. & Cuzzi, J. N. 2000, Icarus, 143, 87
- Dibai (1969) Dibai, E. A. 1969, Astrophysics, 5, 115
- Dorschner et al. (1995) Dorschner, J., Begemann, B., Henning, T., Jaeger, C., & Mutschke, H. 1995, A&A, 300, 503
- Draine (2003) Draine, B. T. 2003, ARA&A, 41, 241
- Ehrenfreund et al. (1998) Ehrenfreund, P., Dartois, E., Demyk, K., & D’Hendecourt, L. 1998, A&A, 339, L17
- Elia et al. (2004) Elia, D., Strafella, F., Campeggio, L., Giannini, T., Lorenzetti, D., Nisini, B., & Pezzuto, S. 2004, ApJ, 601, 1000
- Forrest et al. (2004) Forrest, W. J., Sargent, B., Furlan, E., D’Alessio, P., Calvet, N., Hartmann, L., Uchida, K. I., Green, J. D., Watson, D. M., Chen, C. H., Kemper, F., Keller, L. D., Sloan, G. C., Herter, T. L., Brandl, B. R., Houck, J. R., Barry, D. J., Hall, P., Morris, P. W., Najita, J., & Myers, P. C. 2004, ApJS, 154, 443
- Fridlund et al. (2002) Fridlund, C. V. M., Bergman, P., White, G. J., Pilbratt, G. L., & Tauber, J. A. 2002, A&A, 382, 573
- Furlan et al. (2006) Furlan, E., Hartmann, L., Calvet, N., D’Alessio, P., Franco-Hernández, R., Forrest, W. J., Watson, D. M., Uchida, K. I., Sargent, B., Green, J. D., Keller, L. D., & Herter, T. L. 2006, ApJS, 165, 568
- Gail (2001) Gail, H.-P. 2001, A&A, 378, 192
- Geers et al. (2006) Geers, V. C., Augereau, J.-C., Pontoppidan, K. M., Dullemond, C. P., Visser, R., Kessler-Silacci, J. E., Evans, II, N. J., van Dishoeck, E. F., Blake, G. A., Boogert, A. C. A., Brown, J. M., Lahuis, F., & Merín, B. 2006, A&A, 459, 545
- Graham & Frogel (1985) Graham, J. A. & Frogel, J. A. 1985, ApJ, 289, 331
- Green et al. (2006) Green, J. D., Hartmann, L., Calvet, N., Watson, D. M., Ibrahimov, M., Furlan, E., Sargent, B., & Forrest, W. J. 2006, ApJ, 648, 1099
- Hanner et al. (1998) Hanner, M. S., Brooke, T. Y., & Tokunaga, A. T. 1998, ApJ, 502, 871
- Harker & Desch (2002) Harker, D. E. & Desch, S. J. 2002, ApJ, 565, L109
- Hartmann & Kenyon (1985) Hartmann, L. & Kenyon, S. J. 1985, ApJ, 299, 462
- Hartmann & Kenyon (1996) —. 1996, ARA&A, 34, 207
- Herbig (1977) Herbig, G. H. 1977, ApJ, 217, 693
- Hony et al. (2003) Hony, S., Tielens, A. G. G. M., Waters, L. B. F. M., & de Koter, A. 2003, A&A, 402, 211
- Keane et al. (2001) Keane, J. V., Tielens, A. G. G. M., Boogert, A. C. A., Schutte, W. A., & Whittet, D. C. B. 2001, A&A, 376, 254
- Kemper et al. (2004) Kemper, F., Vriend, W. J., & Tielens, A. G. G. M. 2004, ApJ, 609, 826
- Kessler-Silacci et al. (2006) Kessler-Silacci, J., Augereau, J.-C., Dullemond, C. P., Geers, V., Lahuis, F., Evans, II, N. J., van Dishoeck, E. F., Blake, G. A., Boogert, A. C. A., Brown, J., Jørgensen, J. K., Knez, C., & Pontoppidan, K. M. 2006, ApJ, 639, 275
- Kessler-Silacci et al. (2005) Kessler-Silacci, J. E., Hillenbrand, L. A., Blake, G. A., & Meyer, M. R. 2005, ApJ, 622, 404
- Knez et al. (2005) Knez, C., Boogert, A. C. A., Pontoppidan, K. M., Kessler-Silacci, J., van Dishoeck, E. F., Evans, II, N. J., Augereau, J.-C., Blake, G. A., & Lahuis, F. 2005, ApJ, 635, L145
- Kóspál et al. (2007) Kóspál, Á., Ábrahám, P., Prusti, T., Acosta-Pulido, J., Hony, S., Moór, A., & Siebenmorgen, R. 2007, ArXiv e-prints, 705
- Lachaume (2004) Lachaume, R. 2004, A&A, 422, 171
- Larsson et al. (2000) Larsson, B., Liseau, R., Men’shchikov, A. B., Olofsson, G., Caux, E., Ceccarelli, C., Lorenzetti, D., Molinari, S., Nisini, B., Nordh, L., Saraceno, P., Sibille, F., Spinoglio, L., & White, G. J. 2000, A&A, 363, 253
- Levreault (1988) Levreault, R. M. 1988, ApJS, 67, 283
- Lorenzetti et al. (2000) Lorenzetti, D., Giannini, T., Nisini, B., Benedettini, M., Creech-Eakman, M., Blake, G. A., van Dishoeck, E. F., Cohen, M., Liseau, R., Molinari, S., Pezzuto, S., Saraceno, P., Smith, H. A., Spinoglio, L., & White, G. J. 2000, A&A, 357, 1035
- Malbet et al. (2005) Malbet, F., Lachaume, R., Berger, J.-P., Colavita, M. M., di Folco, E., Eisner, J. A., Lane, B. F., Millan-Gabet, R., Ségransan, D., & Traub, W. A. 2005, A&A, 437, 627
- Mathis (1990) Mathis, J. S. 1990, ARA&A, 28, 37
- Meeus et al. (2001) Meeus, G., Waters, L. B. F. M., Bouwman, J., van den Ancker, M. E., Waelkens, C., & Malfait, K. 2001, A&A, 365, 476
- Men’shchikov & Henning (1997) Men’shchikov, A. B. & Henning, T. 1997, A&A, 318, 879
- Men’shchikov et al. (1999) Men’shchikov, A. B., Henning, T., & Fischer, O. 1999, ApJ, 519, 257
- Millan-Gabet et al. (2006) Millan-Gabet, R., Monnier, J. D., Akeson, R. L., Hartmann, L., Berger, J.-P., Tannirkulam, A., Melnikov, S., Billmeier, R., Calvet, N., D’Alessio, P., Hillenbrand, L. A., Kuchner, M., Traub, W. A., Tuthill, P. G., Beichman, C., Boden, A., Booth, A., Colavita, M., Creech-Eakman, M., Gathright, J., Hrynevych, M., Koresko, C., Le Mignant, D., Ligon, R., Mennesson, B., Neyman, C., Sargent, A., Shao, M., Swain, M., Thompson, R., Unwin, S., van Belle, G., Vasisht, G., & Wizinowich, P. 2006, ApJ, 641, 547
- Muzerolle et al. (2005) Muzerolle, J., Megeath, S. T., Flaherty, K. M., Gordon, K. D., Rieke, G. H., Young, E. T., & Lada, C. J. 2005, ApJ, 620, L107
- Peeters et al. (2002) Peeters, E., Hony, S., Van Kerckhoven, C., Tielens, A. G. G. M., Allamandola, L. J., Hudgins, D. M., & Bauschlicher, C. W. 2002, A&A, 390, 1089
- Pilipp et al. (1998) Pilipp, W., Hartquist, T. W., Morfill, G. E., & Levy, E. H. 1998, A&A, 331, 121
- Polomski et al. (2005) Polomski, E. F., Woodward, C. E., Holmes, E. K., Butner, H. M., Lynch, D. K., Russell, R. W., Sitko, M. L., Wooden, D. H., Telesco, C. M., & Piña, R. 2005, AJ, 129, 1035
- Pontoppidan et al. (2005) Pontoppidan, K. M., Dullemond, C. P., van Dishoeck, E. F., Blake, G. A., Boogert, A. C. A., Evans, II, N. J., Kessler-Silacci, J. E., & Lahuis, F. 2005, ApJ, 622, 463
- Przygodda et al. (2003) Przygodda, F., van Boekel, R., Àbrahàm, P., Melnikov, S. Y., Waters, L. B. F. M., & Leinert, C. 2003, A&A, 412, L43
- Quanz et al. (2007) Quanz, S. P., Henning, T., Bouwman, J., Linz, H., & Lahuis, F. 2007, ApJ, 658, 487
- Quanz et al. (2006) Quanz, S. P., Henning, T., Bouwman, J., Ratzka, T., & Leinert, C. 2006, ApJ, 648, 472
- Reipurth et al. (2002) Reipurth, B., Hartmann, L., Kenyon, S. J., Smette, A., & Bouchet, P. 2002, AJ, 124, 2194
- Sandell & Weintraub (2001) Sandell, G. & Weintraub, D. A. 2001, ApJS, 134, 115
- Sargent et al. (2006) Sargent, B., Forrest, W. J., D’Alessio, P., Li, A., Najita, J., Watson, D. M., Calvet, N., Furlan, E., Green, J. D., Kim, K. H., Sloan, G. C., Chen, C. H., Hartmann, L., & Houck, J. R. 2006, ApJ, 645, 395
- Sato et al. (1992) Sato, S., Okita, K., Yamashita, T., Mizutani, K., Shiba, H., Kobayashi, Y., & Takami, H. 1992, ApJ, 398, 273
- Schutte & Khanna (2003) Schutte, W. A. & Khanna, R. K. 2003, A&A, 398, 1049
- Schütz et al. (2005) Schütz, O., Meeus, G., & Sterzik, M. F. 2005, A&A, 431, 165
- Skinner et al. (2006) Skinner, S. L., Briggs, K. R., & Güdel, M. 2006, ApJ, 643, 995
- Sloan et al. (2007) Sloan, G. C., Jura, M., Duley, W. W., Kraemer, K. E., Bernard-Salas, J., Forrest, W. J., Sargent, B., Li, A., Barry, D. J., Bohac, C. J., Watson, D. M., & Houck, J. R. 2007, ArXiv e-prints, 705
- Sloan et al. (2005) Sloan, G. C., Keller, L. D., Forrest, W. J., Leibensperger, E., Sargent, B., Li, A., Najita, J., Watson, D. M., Brandl, B. R., Chen, C. H., Green, J. D., Markwick-Kemper, F., Herter, T. L., D’Alessio, P., Morris, P. W., Barry, D. J., Hall, P., Myers, P. C., & Houck, J. R. 2005, ApJ, 632, 956
- Smith et al. (1987) Smith, H. A., Fischer, J., Schwartz, P. R., & Geballe, T. R. 1987, ApJ, 316, 265
- Snell & Schloerb (1985) Snell, R. L. & Schloerb, F. P. 1985, ApJ, 295, 490
- Solf (2000) Solf, J. 2000, A&A, 354, 674
- Staude & Neckel (1991) Staude, H. J. & Neckel, T. 1991, A&A, 244, L13
- Staude & Neckel (1992) —. 1992, ApJ, 400, 556
- Stocke et al. (1988) Stocke, J. T., Hartigan, P. M., Strom, S. E., Strom, K. M., Anderson, E. R., Hartmann, L. W., & Kenyon, S. J. 1988, ApJS, 68, 229
- The et al. (1994) The, P. S., de Winter, D., & Perez, M. R. 1994, A&AS, 104, 315
- van Boekel et al. (2005) van Boekel, R., Min, M., Waters, L. B. F. M., de Koter, A., Dominik, C., van den Ancker, M. E., & Bouwman, J. 2005, A&A, 437, 189
- van Boekel et al. (2003) van Boekel, R., Waters, L. B. F. M., Dominik, C., Bouwman, J., de Koter, A., Dullemond, C. P., & Paresce, F. 2003, A&A, 400, L21
- van Dishoeck (2004) van Dishoeck, E. F. 2004, ARA&A, 42, 119
- Vorobyov & Basu (2006) Vorobyov, E. I. & Basu, S. 2006, ApJ, 650, 956
- Watson et al. (2004) Watson, D. M., Kemper, F., Calvet, N., Keller, L. D., Furlan, E., Hartmann, L., Forrest, W. J., Chen, C. H., Uchida, K. I., Green, J. D., Sargent, B., Sloan, G. C., Herter, T. L., Brandl, B. R., Houck, J. R., Najita, J., D’Alessio, P., Myers, P. C., Barry, D. J., Hall, P., & Morris, P. W. 2004, ApJS, 154, 391
- Weingartner & Draine (2001) Weingartner, J. C. & Draine, B. T. 2001, ApJ, 548, 296
- Weintraub et al. (1991) Weintraub, D. A., Sandell, G., & Duncan, W. D. 1991, ApJ, 382, 270
- White et al. (2000) White, G. J., Liseau, R., Men’shchikov, A. B., Justtanont, K., Nisini, B., Benedettini, M., Caux, E., Ceccarelli, C., Correia, J. C., Giannini, T., Kaufman, M., Lorenzetti, D., Molinari, S., Saraceno, P., Smith, H. A., Spinoglio, L., & Tommasi, E. 2000, A&A, 364, 741
- White & Ghez (2001) White, R. J. & Ghez, A. M. 2001, ApJ, 556, 265
| Object | RA (J2000) | DEC (J2000) | AOT / Speed | Time on | Offset [′′] | Date |
|---|---|---|---|---|---|---|
| target [sec] | y / z | |||||
| OO Ser (catalog ) | 18h29m49.05s | +01d16′19.2′′ | SWS01 / 1 | 1062 | - / - | 1996-04-14 |
| 18h29m49.08s | +01d16′19.8′′ | SWS01 / 1 | 1140 | 4 / 3 | 1996-10-24 | |
| 18h29m49.05s | +01d16′19.2′′ | SWS01 / 2 | 1140 | - / - | 1997-03-08 | |
| 18h29m49.05s | +01d16′19.2′′ | SWS01 / 3 | 3454 | - / - | 1997-04-12 | |
| 18h29m49.09s | +01d16′19.8′′ | SWS01 / 3 | 3454 | - / - | 1997-09-22 | |
| RNO 1B | 00h36m46.24s | +63d28′54.3′′ | SWS01 / 2 | 1912 | - / - | 1996-08-27 |
| V346 Nor | 16h32m32.05s | -44d55′28.9′′ | SWS01 / 2 | 1912 | - / - | 1996-08-31 |
| Z CMa (catalog ) | 07h03m43.17s | -11d33′06.6′′ | SWS01 / 2 | 3454 | 3 / 3 | 1997-11-07 |
| V1735 Cyg | 21h47m20.60s | +47d32′04.9′′ | SWS01 / 2 | 1912 | 4 / 4 | 1996-08-06 |
| Reipurth 50 | 05h40m17.89s | -07d27′29.3′′ | SWS01 / 3 | 3454 | 5 / 5 | 1997-10-13 |
| L1551 IRS 5 | 04h31m34.06s | +18d08′04.8′′ | SWS01 / 4 | 6538 | - / - | 1997-09-06 |
| Object | RA (J2000) | DEC (J2000) | AOR | Integration time sec | Date |
|---|---|---|---|---|---|
| Bran 76 (catalog ) (BBW 76) | 07h50m35.52s | -33d06′24.12′′ | 3571200 | 12 (SL, LL) | 2004-04-14 |
| FU Ori (catalog ) | 05h45m22.39s | +09d04′12.5′′ | 3569920 | 12 (SL, SH, LH) | 2004-03-04 |
| L1551 IRS 5 (catalog ) | 04h31m34.08s | +18d08′04.92′′ | 3531776 | 6 (SL, SH, LH) | 2004-03-04 |
| Parsamian 21 (catalog ) (HBC 687) | 19h29m00.72s | +09d38′47.11′′ | 5039872 | 36 (SL) | 2004-04-18 |
| 48 (SH, LH) | |||||
| RNO 1B (catalog ) | 00h36m46.34s | +63d28′53.76′′ | 6586624 | 36 (SL) | 2004-01-07 |
| 60 (SH, LH) | |||||
| RNO 1C (catalog ) | 00h36m46.89s | +63d28′58.44′′ | 6586624 | 36 (SL) | 2004-01-07 |
| 60 (SH, LH) | |||||
| V1057 Cyg (catalog ) | 20h58m53.76s | +44d15′28.44′′ | 3570176 | 12 (SL, SH, LH) | 2003-12-15 |
| V1515 Cyg (catalog ) | 20h23m48.00s | +42d12′25.56′′ | 3570432 | 12 (SL, SH, LH) | 2004-05-11 |
| V1647 Ori (catalog )aaThe object was observed at three different epochs. | 05h46m13.13s | -00d06′05.21′′ | 12261120 | 12 (SL) | 2004-10-20 |
| 24 (SH, LH) | |||||
| 05h46m13.15s | -00d06′04.41′′ | 11569920 | 48 (SL) | 2005-03-11 | |
| 484 (SH), 240 (LH) | |||||
| 05h46m13.14s | -00d06′04.69′′ | 12644096 | 12 (SL, LL) | 2005-03-24 | |
| V1735 Cyg (catalog ) | 21h47m20.6s | +47d32′00.7′′ | 3570944 | 12 (SL, SH, LH) | 2003-12-17 |
| V346 Nor (catalog ) | 16h32m32.1s | -44d55′28.6′′ | 3570688 | 12 (SL, SH, LH) | 2004-02-27 |
| HL Tau (catalog ) | 04h31m38.4s | +18d13′57.9′′ | 3531776 | 6 (SL, SH, LH) | 2004-03-04 |
| XZ Tau (catalog ) AB | 04h31m40.1s | +18d13′57.4′′ | 3531776 | 6 (SL, SH, LH) | 2004-03-04 |
| Object | Instrument | H2O (ice) | H2CO(?)/HCOOH(?)/ | H2O (gas) | CH3OH(?)/ | silicates | CO2 (ice) | PAHaaAny significant emission at 6.2 or 7.7 m (C-H modes), 8.6, 11.3 or 12.7 m (C-C modes) or at 8.2 m (origin not clear yet). |
|---|---|---|---|---|---|---|---|---|
| H2O (ice) | NH(?) | |||||||
| 3.08m | 5.85 / 6.0 m | 5.8 / 6.8m | 6.85m | 10.0m | 15.2m | |||
| OO Ser | ISO-SWS | - | - | - | - | abs | abs | - |
| V346 Nor | ISO-SWS | abs | abs | - | - | abs | - | - |
| Spitzer IRS | - | abs | - | abs | abs | abs | - | |
| Z CMa | ISO-SWS | - | - | - | - | abs | - | - |
| Reipurth 50 | ISO-SWS | abs | abs | - | abs | abs | - | - |
| L1551 IRS 5 | ISO-SWS | abs | abs | - | abs | abs | abs | - |
| Spitzer IRS | - | abs | - | abs | abs | abs | - | |
| RNO 1B | ISO-SWS | abs | - | - | - | flat | - | - |
| RNO 1B | Spitzer IRS | - | abs | - | abs | abs | abs | - |
| RNO 1C | Spitzer IRS | - | abs | - | abs | abs | abs | - |
| V1735 Cyg | ISO-SWS | abs | abs? | - | - | flat | - | - |
| Spitzer IRS | - | - | - | - | abs | abs? | - | |
| Parsamian 21 | Spitzer IRS | - | - | - | - | em | - | em |
| Bran 76 (BBW 76) | Spitzer IRS | - | - | abs | - | em | - | - |
| V1057 Cyg | Spitzer IRS | - | - | abs | - | em | abs (gas) | - |
| V1515 Cyg | Spitzer IRS | - | - | abs | - | em | - | - |
| V1647 Ori | Spitzer IRS | - | abs | - | abs | em | abs | - |
| FU Ori | Spitzer IRS | - | - | abs | - | em | - | - |
| V883 OribbObservations from Schütz et al. (2005). | ESO Timmi2 | - | - | - | - | abs | - | - |
| XZ Tau AB | Spitzer IRS | - | - | - | - | em | - | - |
| HL Tau | Spitzer IRS | - | abs | - | abs | abs | abs | - |
| Component | T [K] | Exponent |
|---|---|---|
| Inner disk rim | 2246 | -0.84 |
| Disk surface | 1128 | -0.49 |
| Disk midplane | 865 | -0.11 |
| Species | 0.1 m | 1.5 m | 6.0 m | Total |
|---|---|---|---|---|
| Amorphous olivine | 0.16 | 0.20 | 0.21 | 0.57 |
| Amorphous pyroxene | 0.00 | 0.00 | 0.43 | 0.43 |
| Crystalline forsterite | 0.01 | 0.00 | 0.00 | 0.01 |
| Crystalline enstatite | 0.00 | 0.00 | 0.00 | 0.00 |
| Silica | 0.00 | 0.00 | 0.00 | 0.00 |
| Amorphous carbon | 0.00 | 0.00 | 0.00 | 0.00 |
| Total | 0.16 | 0.20 | 0.64 |
| Object | [m] | [mag] | [mag] | [mag] | |
|---|---|---|---|---|---|
| L1551 IRS 5 | 1.330.03 | 9.44 | 1.440.03 | 21.83 4.70 | 19-20aaSnell & Schloerb (1985), 30bbSmith et al. (1987), 150ccCampbell et al. (1988) |
| V346 Nor | 0.320.01 | 9.68 | 0.350.01 | 4.98 0.86 | 6.2ddGraham & Frogel (1985), assuming E(B-V)=2.0 |
| V1735 Cyg | 0.290.03 | 9.52 | 0.310.03 | 4.60 0.91 | 10.0e,e,footnotemark: ffLevreault (1988) |
| RNO 1B | 0.240.01 | 9.30 | 0.270.01 | 4.15 1.03 | 9.2ggStaude & Neckel (1991), based on optical data and assuming spectral type. |
| RNO 1C | 0.630.01 | 9.58 | 0.690.01 | 10.11 1.87 | 12ggStaude & Neckel (1991), based on optical data and assuming spectral type. |
| HL Tau | 0.470.01 | 9.61 | 0.510.01 | 7.38 1.32 | 24.0h,h,footnotemark: iiClose et al. (1997), 38jjMen’shchikov et al. (1999), derived from radiative transfer model. |
| Z CMa | 0.310.06 | 9.48 | 0.340.20 | 5.05 1.04 | 2.80.1kkCohen & Kuhi (1979), based on optical data and assuming spectral type. |
| Reipurth 50 | 1.680.34 | 9.68 | 1.820.20 | 26.18 4.34 | 50llCasali (1991), based on NIR colors, assumed intrinsic color temperatures and strength of additional ice absorption features. |
| Object | |||
|---|---|---|---|
| L1551 IRS 5 | 0.510.01 | 0.470.01 | 0.540.05 |
| V346 Nor | 0.050.01 | 0.060.01 | 0.120.02 |
| V1735 Cyg | 0.050.02 | 0.090.01 | 0.3 |
| RNO 1B | 0.200.01 | 0.180.01 | 0.320.04 |
| RNO 1C | 0.350.01 | 0.260.01 | 0.410.02 |
| HL Tau | 0.100.01 | 0.070.01 | 0.130.06 |
| V1647 Ori | 0.070.01 | 0.060.01 | 0.200.02 |
| V1647 Ori 2 | 0.100.01 | 0.080.01 | 0.190.02 |
| V1647 Ori 3 | 0.090.01 | 0.070.01 | -aaonly low-resolution data |
| Date | Flux density | Flux density | Flux density | Slope [Jy/] |
|---|---|---|---|---|
| at 8 m [Jy] | at 20 m [Jy] | at 30 m [Jy] | ||
| OO Ser | ||||
| 1996-04-14 | 16.51.8 | 43.02.3 | 2.650.04 | |
| 1996-10-24 | 15.22.1 | 41.22.6 | 2.610.05 | |
| 1997-03-08 | 12.81.2 | 32.51.5 | 1.980.03 | |
| 1997-04-12 | 11.91.5 | 31.11.8 | 1.920.04 | |
| 1997-09-22 | 8.81.2 | 23.91.4 | 1.520.03 | |
| V1647 Ori | ||||
| 2004-10-20 | 3.950.02 | 11.560.16 | 16.520.51 | |
| 2005-03-11 | 2.490.01 | 7.210.20 | 10.350.24 | |
| 2005-03-24 | 3.040.01 | 7.820.17aalow-resolution data | 10.620.05aalow-resolution data | |