Triggering Mechanism for the Filament Eruption on 2005 September 13 in Active Region NOAA 10808
Abstract
On 2005 September 13 a filament eruption accompanied by a halo CME occurred in the most flare-productive active region NOAA 10808 in Solar Cycle 23. Using multi-wavelength observations before the filament eruption on Sep. 13th, we investigate the processes leading to the catastrophic eruption. We find that the filament slowly ascended at a speed of over two days before the eruption. During slow ascending, many small flares were observed close to the footpoints of the filament, where new magnetic elements were emerging. On the basis of the observational facts we discuss the triggering mechanism leading to the filament eruption. We suggest the process toward the eruption as follows: First, a series of small flares played a role in changing the topology of the loops overlying the filament. Second, the small flares gradually changed the equilibrium state of the filament and caused the filament to ascend slowly over two days. Finally, a C2.9 flare that occurred when the filament was close to the critical point for loss of equilibrium directly led to the catastrophic filament eruption right after itself.
1 Introduction
Investigating the triggering mechanism of filament eruption is one of the most important subjects in the field of space weather, because such ejections of plasma and magnetic fields from the sun lead to a significant disturbance of the magnetosphere and affect human life. It is widely accepted that flares, filament eruptions and coronal mass ejections (CMEs) are different aspects of the same physical process including plasma ejection and magnetic energy release (see Shibata et al. 1995; Forbes 2000). Several precursor signatures were reported (Martin, 1980). However, what directly triggers such catastrophic eruptive events is not yet understood. Many theoretical models were proposed so far (e.g., Moore & Roumeliotis 1992, Antiochos et al. 1999) As a catastrophe model for CMEs, Forbes (1990) and Forbes & Isenberg (1991) proposed the loss of equilibrium. Using a two-dimensional numerical simulation, Forbes (1990) confirmed that when the filament current exceeds a critical value, the stable configuration containing the filament loses equilibrium. When equilibrium is lost, the filament is magnetically driven upward and may evolve into a CME. Chen & Shibata (2000) and Lin et al. (2001) proposed the emerging flux triggering mechanism for filament eruptions and CMEs, motivated by the observed correlation between reconnection-favored emerging flux and CMEs (e.g. Feynman & Martin 1995, Wang & Sheeley 1999).
From the observational point of view, however, conclusions reported in literatures have not converged yet in that which model is the best as the triggering mechanism of eruptive events. Therefore, accumulation of detailed analyses of individual events is still necessary to understand the physical mechanisms of solar eruptions as well as to construct empirical models toward space weather forecast. In order to extract the essential physics and to compare with the existing theories, those events whose magnetic configuration is as simple as possible may be suitable. On the other hand, flare-productive active regions usually have very complex magnetic structures. From the viewpoint of space weather, we wish to understand and predict the eruptions from such complex active regions.
Therefore, in this paper we focus on the eruptive events in active region NOAA 10808 which appeared in September 2005 and showed the most furious flare activity during the current solar cycle (cycle 23). To have a clear view of the mechanism of the filament eruption in this region, we examined extensively the observational signatures that may lead to the filament eruption using various available data. We find several interesting features that might help to understand the physical mechanism of the eruption. One of those is that the filament that erupted on Sep. 13th gradually deviated from the magnetic neutral line over two days. The speed of this ascending motion is approximately . Another feature is the sites where C- and M-class flares occurred during the period of ascending motion. In these sites magnetic elements emerged and moved markedly. We discuss a plausible triggering mechanism of the eruption, considering these features as the clues. Independent analyses of this filament eruption were carried out by Chifor et al. (2007) and Wang et al. (2007).
2 Overview of the active region
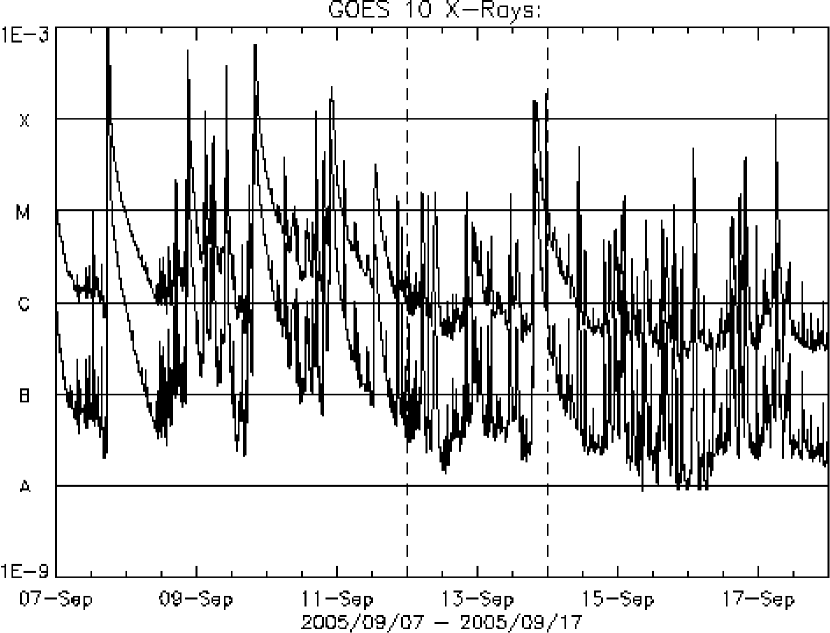
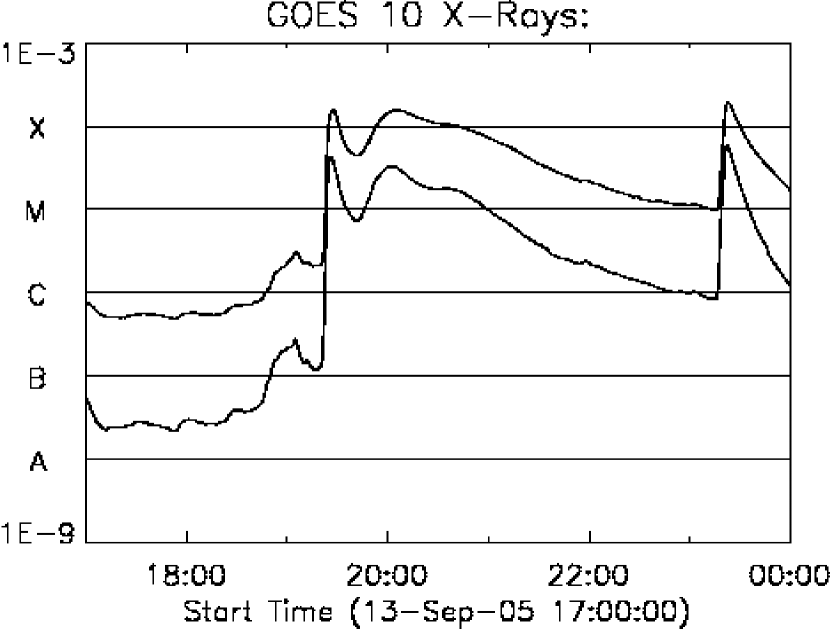
In September 2005, a flare-productive active region appeared on the solar disk. Active Region NOAA 10808 appeared over the east limb on 2005 September 7 and produced at least 10 X-class and 25 M-class flares until it disappeared behind the disk. Figure 1 shows the GOES soft X-ray lightcurve of the period when this active region was on the disk. Since no other strong active region was on the disk during this period, almost all the flares shown in this figure were attributed to this active region. This is the most intense flare activity during Solar Cycle 23 despite in the declining phase of the cycle. After crossing the meridian the active region seemed to decay remarkably and most of the X-class flares occurred in the eastern hemisphere. Some flares were accompanied by CMEs; however, they were not so geoeffective. (See Wang et al. 2006.)
It should be noted that this active region was the return of active region NOAA 10798 of the previous month. The active region NOAA 10798 emerged into a coronal hole near the disk center and formed a sea-anemone-type active region (Shibata et al., 1994). By the time it rotated over the limb, two M-class flares accompanied with halo CMEs occurred and caused a large geomagnetic storm with the minimum Dst index of (Asai et al., 2006).
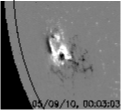
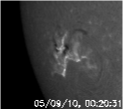
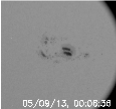
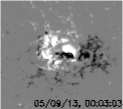
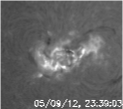
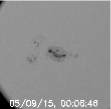
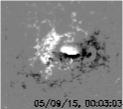
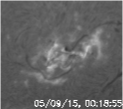
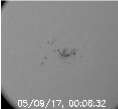
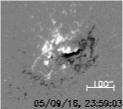
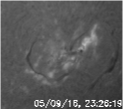
In Figure 2, four sets of images show the evolution of the active region. Each set has white-light image, photospheric magnetogram, and H image co-aligned with each other. The white-light images were taken by Transition Region And Coronal Explorer (TRACE; Handy et al. 1999). The magnetograms are those from Michelson Doppler Imager (MDI; Scherrer et al. 1995) onboard the Solar and Heliospheric Observatory (SOHO). The H images were clipped from the full-disk images obtained by Solar Magnetic Activity Research Telescope (SMART; UeNo et al. 2004) at Hida Observatory, Kyoto University.
At the center of the active region there was a delta-type sunspot which has two umbrae with different magnetic polarities packed tightly within a single penumbra. It showed a counter-clockwise rotational motion. The direction of the motion was such that the orientation of the two polarities of the delta-type spot approaches the so-called “Hale’s polarity law” (Hale et al., 1919). According to Hale’s law, in southern hemisphere the leading and following spots have negative and positive polarities, respectively, during Solar Cycle 23. The delta-type spot is surrounded by more diffuse magnetic field that satisfies Hale’s law. Running through the delta-type sunspot, there was an S-shaped neutral line in this active region (see Figure 2; details are given in §3). Along the neutral line dark filaments were seen in H images in Figure 2. We find that when halo CMEs occurred on Sep. 9th, 11th, and 13th, the east part of the filaments erupted. Although the other halo CME occurred on Sep. 10th, we cannot identify the source region of the CME due to lack of EUV and H data. Among these events, we focus on the filament eruption that occurred on Sep. 13th to understand the mechanism of flares and their relationship to the processes of eruptive events in this active region.
3 Filament eruption on 2005 September 13
On 2005 September 13, an X1.5 class flare occurred near the disk center in the super active region NOAA 10808. This flare was accompanied by filament eruptions and a halo CME. A chronological description of the event is summarized in Table 1. Hereafter, this event is referred as “the X1.5 event”.
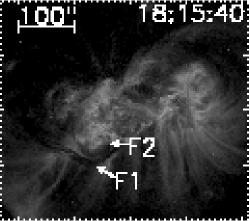
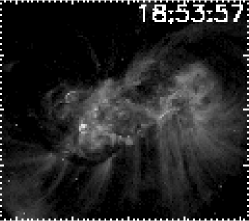
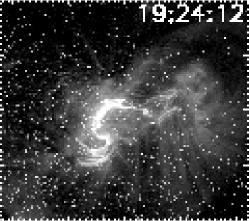
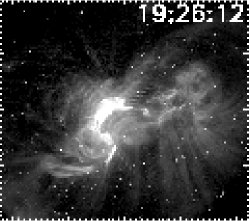
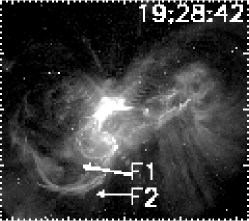
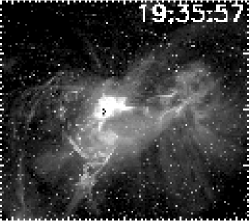
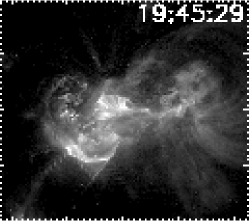
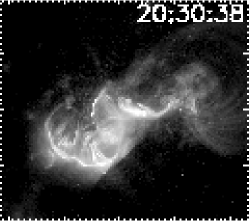
Figure 3 shows GOES soft X-ray light curves during this event. The GOES 1-8Å flux began to increase at 19:19 and attained its peak at 19:27. At the time of GOES flux peak, two filaments erupted: the inner one (hereafter referred as filament 2) brightened and erupted, the outer one (referred as filament 1) remained dark and seemed to ascend following filament 2. Figure 4 describes the motion of the filaments as they appeared in 195 Å images taken by TRACE.
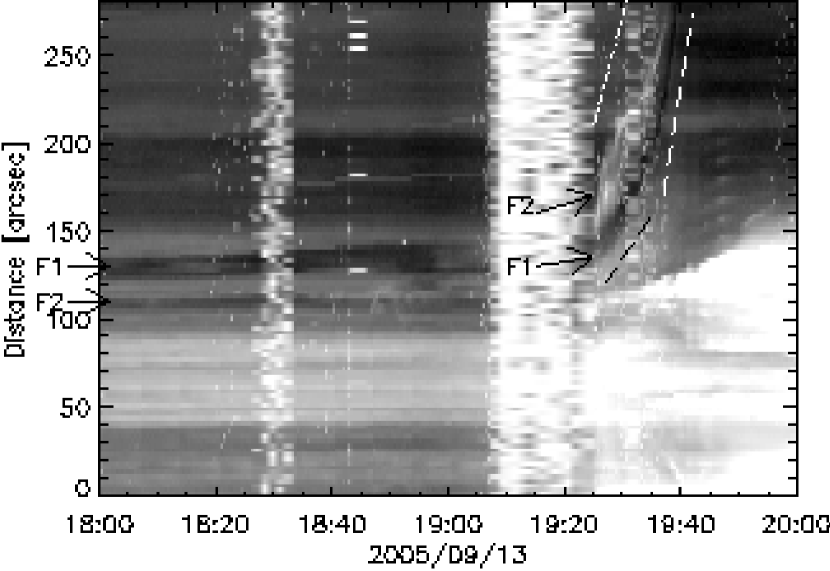
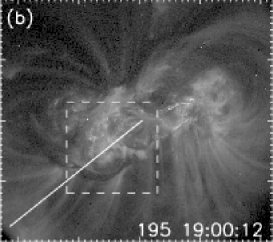
Figure 5 shows the height-time profile for the erupting filaments along the slit shown in Figure 6b as observed from TRACE 195 Å images. This height-time profile shows filament 2 brightened and rapidly erupted at a velocity of (white dot-dashed line). Filament 1 remained dark and seemed to follow bright filament 2 at a speed of (black dashed line); the upward velocity increased up to (white dashed line). Such motions of the filaments are also recognizable in Figure 4.
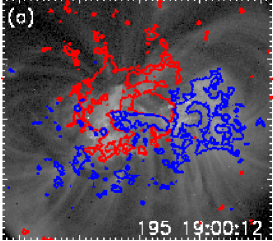
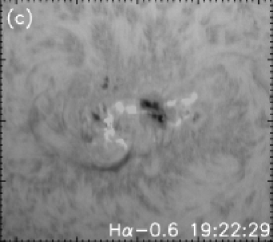
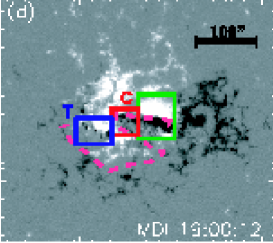
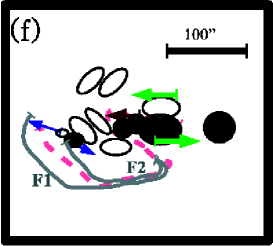
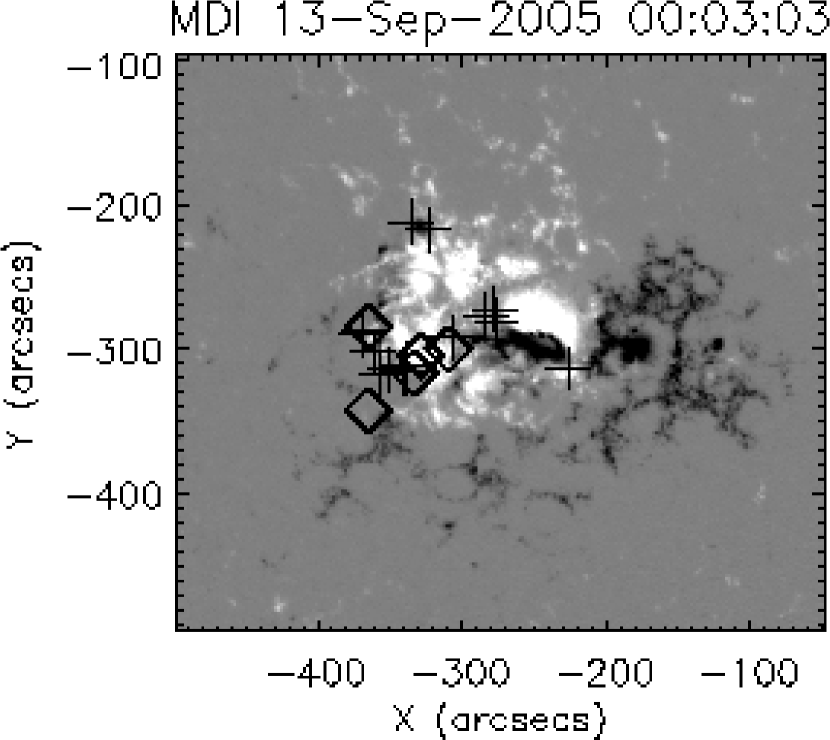
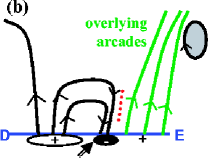
Figure 6 explains the magnetic structure of the active region and the locations of the filaments and the flares. Figure 6a shows the SOHO MDI magnetogram overlaid on the TRACE 195 Å image before the eruption. In this region, there was an S-shaped neutral line running through the delta-type sunspot as shown in Figure 6d. The filament eruption occurred along all the southeast part of this neutral line. At the same time of the eruption the flare core brightened in EUV on the east side of the delta-type sunspot along the neutral line; this region is labeled as region C (see Figure 6d). Region C is characterized by several small negative-polarity magnetic elements moving one after another from the negative-polarity umbra in the delta-type spot (see Figure 12 and §5.2 for detail). Another characteristic site in the magnetograms is on the opposite side of the neutral line from region C. In this region, hereafter referred as region T, many magnetic elements flowed out near the neutral line (See Figure 12 and §5.3 for detail). As discussed in §5, many small (C- and M-class) flares occurred in regions C and T before the X1.5 event. These characteristic magnetic regions are summarized in Figure 6f with their characteristic motions indicated by arrows. In this panel, filaments are indicated by gray lines: Filament 1 (F1) originally appeared above the S-shaped neutral line and gradually deviated southeastward, while filament 2 (F2) appeared above the neutral line by the time the X1. 5 event occurred.
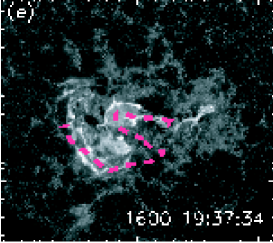
Although the initiation of the filament eruption was unclear in EUV because TRACE satellite was in the South Atlantic Anomaly (SAA) during the period, the first flare brightening in H blue wing (H Å) was observed right before the eruption of filaments 1 and 2. Figure 6c shows an H wing (H Å) image taken at the Big Bear Solar Observatory (BBSO). The brightening began from region C as shown in Figure 6c, and expanded southeastward along the S-shaped neutral line. After the filament eruption, flare ribbons formed along the S-shaped neutral line which are shown in TRACE 1600 Å images in Figure 6e.
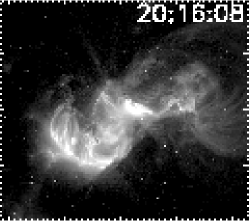
After the filament eruption mentioned above, a more faint eruptive event occurred in the south part of the active region at around 20:00 UT, i.e., at the second peak of GOES flux. Footpoints of this erupting filament were located on the west of the delta-type sunspot and close to the post flare loops in the southeast of the active region.
These erupting events seemed to evolve into a white-light halo CME. According to CME catalogue111http://cdaw.gsfc.nsa.gov/CME_list (Yashiro et al., 2004), this event is recognized as a halo CME with the projected speed of . In SOHO LASCO C2 images, two blobs were observed; the second bright core is thought to be related to the second eruption at 20:00 UT, because its launch time is estimated at around that time on the basis of the linear extrapolation of its track.
4 Long-time evolution of filaments
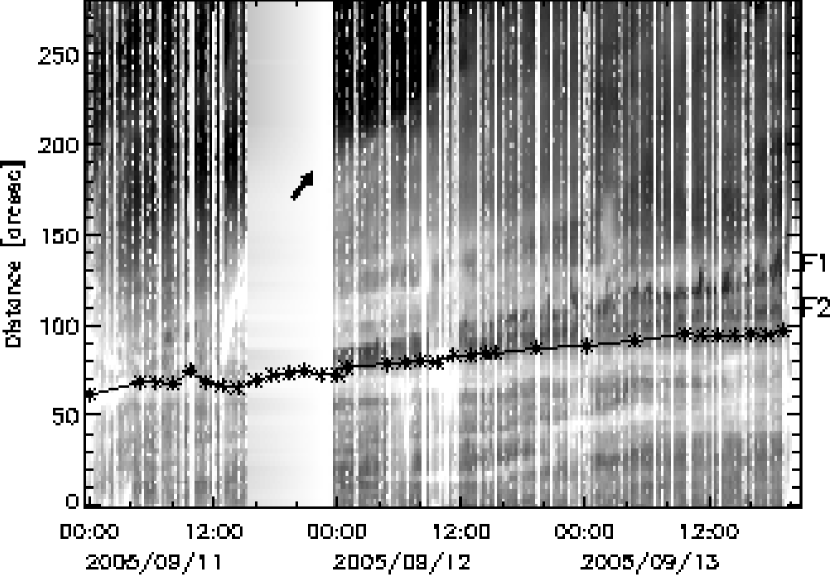
Before Sep. 13th eruption (the X1.5 event), we can see two filaments in the southeast part of the active region: The outer one (filament 1) and the inner one (filament 2). They formed after another filament eruption on Sep. 11th. We concentrate on the evolution of these filaments after the eruption on Sep. 11th. We find that filament 1 continuously deviated from the neutral line from 11th to 13th. Figure 7 shows the time evolution of EUV intensity along the slit shown in Figure 6b. Asterisked line indicates the position of the magnetic neutral line. This figure shows that the filament seemed to separate from the neutral line at a nearly constant speed of over more than 40 hours, while the filament accelerated to when it erupted as mentioned in §3. Although we see only the plane-of-sky motion of the filament separating from the neutral line, we can interpret it as an ascending motion by taking into account the projection effect. Such a slow and long-lasting ascending motion is probably different from so-called slow-rise phase of the erupting filaments, such as those reported by Ohyama & Shibata (1997) (see also Kahler et al. 1988, Rompolt 1990, Zhang et al. 2001, Sterling & Moore 2004). Chifor et al. (2006) reported the early evolution of a prominence eruption observed on 2005 July 27. Slow-rise at a speed of was observed over 30 minutes prior to the fast-rise phase during which the filament accelerated up to . Since the slow ascending motion continues much longer than those in the previously reported events, we believe the physical mechanism is different. Isobe & Tripathi (2006) and Isobe et al. (2007) reported an observation of slow rising motion () of a polar crown filament that last for more than 10 hours before it finally erupted. They found a large amplitude oscillation of the filament during the slow rising, and hence concluded that the filament retained a stable equilibrium and the rising motion is a quasi-static evolution. This may be the same phenomenon as our long-lasting slow rise. Existence of such long-term slow rise has been also pointed out by S. Martin (private communication).
It should be noted that filament 1 showed active motion along its axis in TRACE EUV images and SMART H images during its slowly ascending, i.e., over two days (e.g., Martin 1980).
5 Preflare brightenings on Sep. 12th and 13th
5.1 All M- and C-class flares
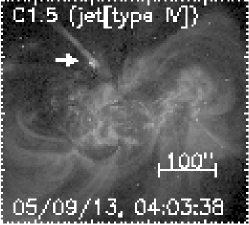
During the slow rise of the filament, several M- and C-class flares and small brightenings in EUV occurred in this active region. As shown between the dashed lines in Figure 1, 5 M-class and 18 C-class flares occurred since 00:00 UT on Sep. 12th until the X1.5 flare on Sep. 13th. All of these flares are listed in Table 2 and the locations on the magnetogram are shown in Figure 8. These flares can be categorized into four groups: (I) eruptive events along the S-shaped neutral line (the X1.5 event), (II) brightenings around filaments on the east side of the delta-type spot (region C), (III) local events in the emerging flux region (region T), (IV) small jets in the northeast part of the active region. Since small jets (group IV) were localized events and were not attributed to the S-shaped neutral line, we consider that these events did not have direct influence on the X1.5 event. TRACE 195 Å images of groups II, III, and IV are shown in Figure 9.
Group I is the filament eruption during the X1.5 event on Sep. 13th itself. We consider the other smaller events (groups II and III) which occurred along the S-shaped neutral line as a key to find out the triggering mechanism of the X1.5 event. First, we focus on the events occurred in region C (group II) to consider the eruptive process of the X1.5 event. Next, we consider the last local event (group III) right before the X1.5 event to consider the direct triggering mechanism of the X1.5 event.
5.2 Filaments in region C and M1.5 and M6.1 flares on Sep. 12th
One of the puzzling points in the X1.5 event is that although the flare ribbon extended throughout the S-shaped neutral line, the filament was visible only in the southeast part of the neutral line. We suggest that an eruptive process did occur in region C as well, even though we did not observe an filament during the X1.5 event. The magnetic topology may be either a flux rope (e.g., Priest et al. 1989; Low 1996) or a sheared arcade (e.g., Antiochos et al. 1994).
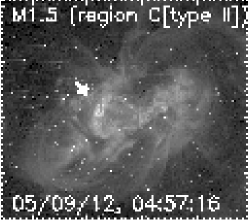
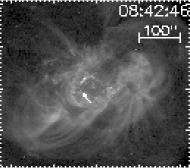
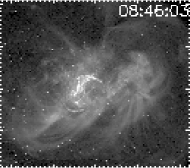
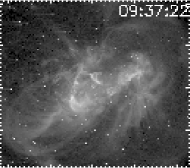
A filament was actually visible in region C sometimes during Sep. 12th and 13th. An M1.5 flare occurred in region C at 5:05 UT on 12th. An EUV brightening seemed to be located under a dark filament in region C. Neither eruption nor a CME was observed during this event. Some loops overlying the dark filament brightened after the main phase. Four hours after the M1.5 flare, an M6.1 class flare occurred at 9:03 UT. Figure 10 shows TRACE 195 Å images of this event. In this event, brightening in EUV started from region C. A thin dark filament in region C was lifted up and seemed to erupt at 8:46 UT, i.e., the first peak of the GOES soft X-ray flux. The thin dark filament twined around the brightening loop. When the brightening loop expanded the dark filament erupted. Although the dark filament could not be identified clearly after its eruption, according to CME catalog (Yashiro et al., 2004), a narrow CME was observed by SOHO LASCO right after this event. A little thin lump of bright coronal emission first appeared in LASCO/C2 field of view at 9:12 UT and was recognized as a CME with the projected speed of , which is consistent with the assumption that the filament erupted at around 8:46 UT and evolved into a CME.
After these flares, a dark filament existed in region C. This filament could be seen in SMART H wing (H) images taken at around 3:00 UT on 13th. We observed ceaseless mass flow along the filament in region C. This is similar to the active motion of the filament 1 along its axis that is mentioned in §4.
On the basis of the observational features of the small dark filament in region C, we speculate that there was a flux rope or sheared field in region C. Owing to the nonsteady mass flow along the filament in region C, the filament itself was sometimes visible and, another time, was invisible. However, the magnetic field that supported the filament should have existed all the time. Considering the fact that during the X1.5 event the brightening in H started from region C and extended to the southeast part, we suppose that this eruptive process in region C was the initiation of the X1.5 event even though the filament in region C was invisible at the time of the event. Those observations described in this section support that a flux rope (or whatever plays the role of a filament) did exist in region C even at the time of the X1.5 event on 13th.
5.3 Possible direct trigger for the X1.5 event: C2.9 flare on Sep. 13th
A small brightening in EUV close to the footpoint of filament 2 was observed 40 minutes before the filament eruption. It was recorded as a GOES C2.9 class flare at 19:05 UT (see Figure 3). We consider this event as the final trigger of the X1.5 event.
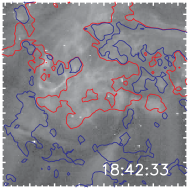
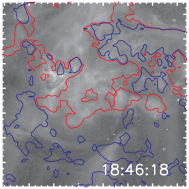
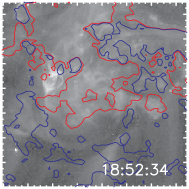
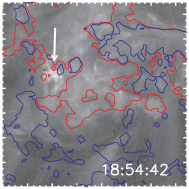
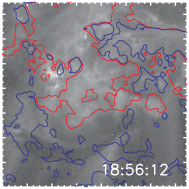
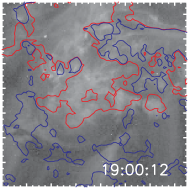
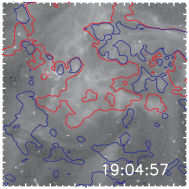
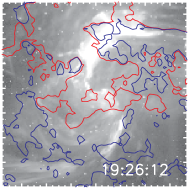
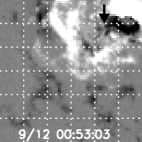
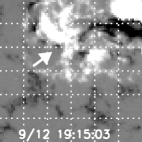
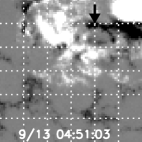
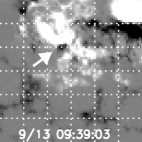
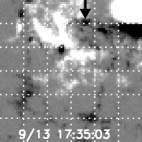
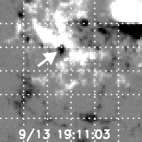
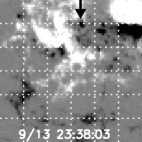
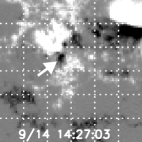
At the site of the C2.9 flare, successive appearances of small magnetic elements were seen in magnetograms. Figure 11 shows a series of TRACE 195 Å images during this event. SOHO MDI magnetogram contours are overlaid; red and blue contours indicate . At around the center of each panel, a small brightening in EUV appeared and jet-like features pointed by the white arrow were observed to the east of the bright loops. These dark jet-like features are also seen in BBSO H wing (H) images. These jets and loops moved eastward gradually and the jets also showed a whip-like motion. Moreover, on the left side of bright jet-like features, dark backward flows were observed when we check a TRACE 195 Å movie of this event (see mpeg animation of Figure 4). Figure 12 shows a series of MDI magnetograms mainly taken on September 12th and 13th. From the tail part of the S-shaped neutral line, lots of small magnetic elements were flowing out. Although region T was dominated by the negative polarity, patchy magnetic elements with both polarities were emerging. Over the two days before the filament eruption, similar small brightenings in EUV which were identified as C- or sub-C-class flares by GOES occurred in the similar locations (Figure 8); C-class events were listed in Table 2. Taking a closer look at the sites of small brightenings, they slightly moved southward with time, but corresponded to the source region of the emerging mixed polarities.
It is noteworthy that an element of negative polarity which first appeared in the frame taken at 19:15 UT on Sep 12th (see the second panel in the first row in Figure 12) moved southwestward along the neutral line. It weakened the positive region so that the positive region divided into parts after the X1.5 event (see the magnetogram image taken at 14:27 on Sep. 14th in Figure 12). This negative element was located at the footpoint of the brightening loop during the C2.9 event at 19:05 UT on Sep. 13th. We examine the motion of the negative element and it yields valuable clues to understand the triggering mechanism of the X1.5 event (see §6).
It should be noted that small brightenings in EUV 195 Å were also found just before the X1.5 event on the west side of the delta-type spot. In H wing (H) images taken at BBSO, the only data taken simultaneously during this period, we cannot identify corresponding brightenings. Although this event occurred in the same period as the C2.9 event we consider that this west-part event did not have a direct influence in triggering the X1.5 event. The reasons are as follows: (1)In this region similar brightenings in EUV were also observed one hour before this event. (2)The dark filament in this region seemed not to be affected by the X1.5 event, and remained as it were after the X1.5 event. (3)Although it located close to the footpoint of the second eruption at around 20:00 UT, the magnetic field lines in this region did not seem to directly connect with those which were involved in the X1.5 event. Another brightening was observed to the northeast of the tail of the S-shaped neutral line (See the center panel in the first row of Figure 4). We consider that this event was not directly related to the X1.5 event because of similar reasons.
6 Discussion: Triggering Mechanism of the X1.5 Event
On the basis of the multi-wavelength observations, we discuss the triggering mechanism of the X1.5 event. As mentioned in the previous section, we considered M- and C-class flares on Sep. 12th and 13th as a key to find out the triggering mechanism of the X1.5 event.
A filament eruption occurred at 13:12 on Sep. 11th accompanying an M3.0 flare. At least ten hours after this filament eruption, another filament was re-formed along the S-shaped neutral line. After that several M- and C-class flares and small brightenings in EUV occurred in region C and region T. We consider that these small flares played a role in lengthening the magnetic arcades overlying the filaments.
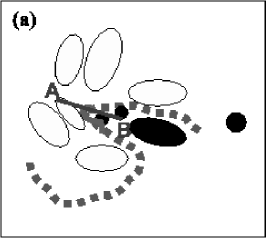
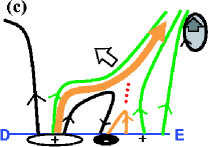
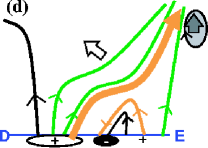
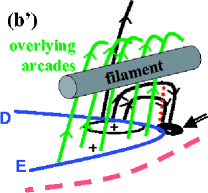
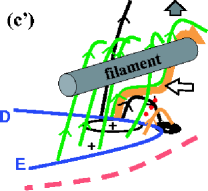
In region C, the negative elements flowed out from the negative part of the delta-type spot during 12th and 13th. When small flares occurred in region C, such as the M1.5 flare at 05:05 UT on Sep. 12th and the M6.1 flare at 09:03 UT on Sep. 12th, the magnetic field lines connecting to these negative elements reconnected to the loops overlying the filaments in region C; a schematic illustration is shown in Figure 13. Note that the positive element on the left side of the pointed negative element shown in Figures 13b, c, and d was not on line AB shown in Figures 13a in reality; we consider that it was located in the positive side of the delta-type spot. During the events in region C, bright loops crossing over the dark filament were observed. It is the evidence that the loops overlying the filament were involved in the reconnection process as shown in Figure 13. As mentioned in §5.2, no eruption was observed during all but the M6.1 flare at 09:03 on Sep. 12th; the M6.1 flare was associated with a small filament eruption in region C which appeared to evolve into a CME. We consider that most events only changed the equilibrium state of the filament in region C, while the perturbation at the time of the M6.1 flare was strong enough to trigger the eruption of the filament. However, we consider that all these flares in region C (group II events) occurred in essentially the same way as the mechanism shown in Figure 13.
As for the flares in region T (group III events), we interpret also in a similar way. Although group II and group III were apparently independent events, they were located along a single magnetic neutral line (the S-shaped neutral line; see Figure 6f) in the active region. Moreover, during the X1.5 event, throughout the east part of the S-shaped neutral line flare ribbons were observed. Therefore, we suppose that these filaments were different parts of one flux rope or sheared field along the S-shaped neutral line, and similar mechanisms for small flares along the neutral line (group II and III events) are suggested.
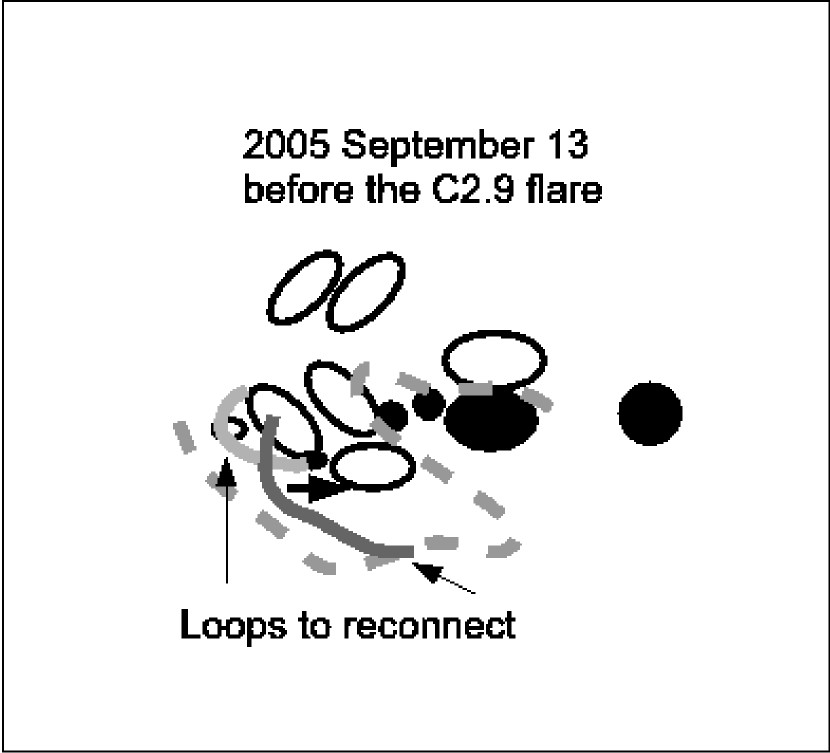
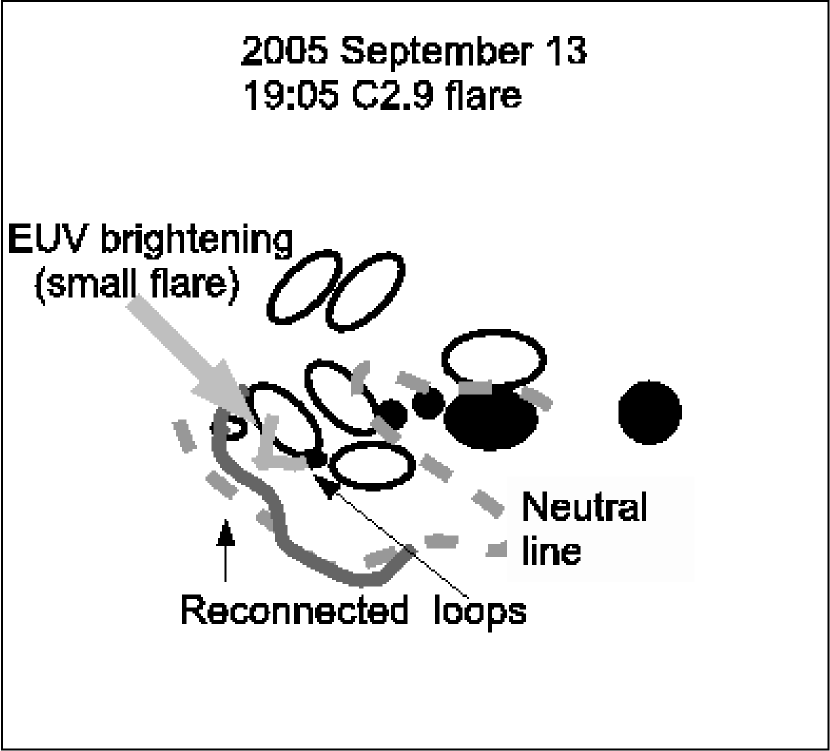
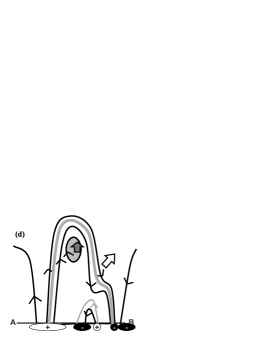
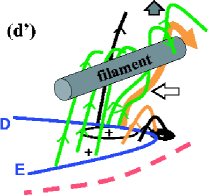
As the reconnection associated with these small flares lengthened overlying loops, the filaments changed its equilibrium state and appeared to deviate from the neutral line. Finally, the filaments erupted after the C2.9 flare that occurred at 19:05 UT on Sep. 13th in region T. We suppose that this small flare was a direct trigger of the filament eruption (the X1.5 event). At that time the filaments were probably very close to the critical point for loss of equilibrium, and were caused by the C2.9 flare to erupt. Magnetic configuration of the C2.9 flare on Sep. 13th is shown in Figure 14. The emerging flux whose footpoint located on the flowing negative element interacted with the loops overlying filament 2. The reconnected loop brightened and a jet-like feature crossing over the filament was observed. This jet-like feature showed a whip-like motion as the magnetic reconnection proceeded.
The characteristic features observed during Sep. 12th and 13th are summarized as follows: (1) Filament 1 continuously ascended slowly. (2) Lots of M- and C-class flares occurred at around the footpoints of filaments; however, no eruption was observed during all but the M6.1 flare in region C on Sep. 12th. (3) Although the C2.9 flare on 13th showed the similar magnetic structure to the preceding M- and C-class events and was not a strong event in particular, it seemed to trigger the catastrophic eruption (the X1.5 event). We suggest that a series of small flares triggered the filament eruption through the process of lengthening the overlying arcade by magnetic reconnection. This is consistent with the emerging flux triggering mechanism suggested by Chen & Shibata (2000) in that magnetic reconnection that occurred in a filament channel triggers a filament eruption. Note that Wang & Shi (1993) also suggested two-step magnetic reconnection: The first step of reconnection is a slow reconnection in the lower atmosphere that is observed as flux cancellation, while the flare energy release comes directly from the second step reconnection that is the fast reconnection higher in the corona. However, the fact that lots of small flares occurred around the footpoints of filaments but no eruption was observed except the M6.1 flare on Sep. 12th (feature (2) described above) indicates that magnetic reconnection at the footpoints of filaments is not a sufficient condition for the eruption. In order to trigger the eruption, such reconnection must occur when the filament is close to the critical point for loss of equilibrium; that is why the relatively small (C2.9) flare could trigger the eruption. Since in the initial condition of the simulation of Chen & Shibata (2000), the flux rope was already set in an equilibrium state very close to instability or loss of equilibrium, once magnetic flux emerges the flux rope can erupt immediately. A loss of equilibrium model was proposed by Forbes (1990) and Forbes & Isenberg (1991). Forbes (1990) confirmed by a numerical simulation that when the filament current exceeds a critical value, the stable configuration containing the filament loses equilibrium and the filament may erupt. We suggest the slow and long-lasting ascending motion of the filament presented in this paper corresponds to the change of the equilibrium height of the filament; the filament approaches to the critical point from initially stable equilibrium, as described in the loss of equilibrium model. For our X1.5 event, such change was due to the series of small flares involving the overlying arcade of the filament.
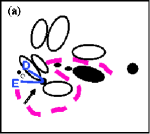
It has to be mentioned that we can interpret these processes in another way. In Figure 15, we show the structure of the C2.9 flare that occurred right before the X1.5 event. In this scenario, we consider the moving magnetic elements played the key role in triggering the filament eruption; at the footpoint of the flux rope labeled as filament 2 reconnection occurred and it made the flux rope itself lengthen directly. Then filament 2 erupted and filament 1 that was already approaching certain critical point also erupted in a consequence of eruption of filament 2.
Another interesting feature to be noted here is a rising motion of bright structure during the slow rise of the filament indicated by an arrow in the time slice shown in Figure 7. This rising structure corresponds to an apparently swelling loop in TRACE image. This may be related to ‘bugle’, which was reported by Hundhausen (1993). Bugles were observed as brightening and swelling of the bright belt of coronal streamers several days before a CME, and they suddenly disappeared as the CMEs occurred. They were named so because the shape looks like a bugle on synoptic maps at a given height in the corona. The timescale of bugles is the same order as the slow swelling motion in the corona found in our event, although the size of bugle is much larger. Perhaps the swelling motion is the lower coronal counterpart of a bugle. One of the bugles reported by Hundhausen (1993) was investigated by Feynman & Martin (1995). During the development of the bugle, a new magnetic flux was observed to emerge below the large-scale arcades. As Chen & Shibata (2000) suggested, an emerging flux can trigger filament eruptions through the reconnection with the magnetic field lines around the filament. In our event, we found systematic motions of magnetic elements below the filament. Such moving magnetic elements may or may not be related to newly emerging fluxes, but they also can induce the magnetic reconnection that changes the equilibrium state of the filament and triggers its eruption. Therefore, we suggest that (1) both emerging fluxes and moving magnetic elements in the vicinity of filament neutral line can lead a filament to approach the loss of equilibrium, and (2) both the bugles in the high corona and the swelling loops in the low corona are the manifestations of the evolution of coronal field that is approaching to the loss of equilibrium (eruption).
Using multi-wavelength data of these events, such as TRACE EUV 195 Å and 1600 Å data, MDI magnetograms, and BBSO and SMART H data, we tried to investigate extensively what happened in the active region before the filament eruption. Although we find several interesting features, we cannot find definitive conclusion of what directly triggers such flares in the active region, since the magnetic structure of flares were extremely complex in this region. It is not clear whether one can know the equilibrium properties of a filament (flux rope) from a “snap shot” of the active region by, e.g., non-linear force free extrapolation of a photospheric magnetogram. Such approaches may work, but possibly one needs the evolutionary history of the active region for an accurate diagnostics. Comparison of coronal observations and the numerical models of coronal field calculated from observed magnetograms have been done extensively (e.g.,Yan & Sakurai 1997). We stress the importance of studying the long-term (namely more than a few days) temporal evolution of the photospheric and coronal magnetic field that eventually produces an eruption. The Solar Optical Telescope onboard Hinode satellite obtains accurate vector magnetograms with uninterrupted observation, and therefore will provide ideal data sets for this purpose.
7 Conclusion
Active region NOAA 10808 appeared in September 2005 and exhibited extraordinary flare activity which was the most active in Solar Cycle 23. Using EUV, H, and magnetogram data taken before and during eruptive events accompanied by an X1.5 flare (the X1.5 event), we investigate the processes leading to the catastrophic eruption. We find several interesting features to understand the physical mechanism of the X1.5 event. The main points are as follows:
-
•
The filament which erupted during the X1.5 event slowly ascended over two days before its eruption. The speed of the ascending motion is approximately .
-
•
While the filament was ascending slowly, lots of M- and C-class flares were observed close to the footpoints of the filament. At the sites where the flares frequently occurred, magnetic elements emerged and moved distinctively.
On the basis of these observational facts, we discuss the triggering mechanism of the filament eruption on 2005 September 13. We suggest that many small flares that occurred in the vicinity of the filament played a role in changing the topology of the magnetic field lines overlying the filament through small scale reconnection. Over two days, they changed its equilibrium state gradually and allowed the filament to ascend slowly. In the end, a C2.9 flare that occurred just before the X1.5 event was considered to lead to the catastrophic filament eruption directly.
References
- Antiochos et al. (1994) Antiochos, S. K., Dahlburg, R. B., & Klimchuk, J. A. 1994, ApJ, 420, L41
- Antiochos et al. (1999) Antiochos, S. K., DeVore, C. R., & Klimchuk, J. A. 1999, ApJ, 510, 485
- Asai et al. (2006) Asai, A., Ishii, T. T., Shibata, K., & Gopalswamy, N. 2006, Solar Active Regions and 3D Magnetic Structure, 26th meeting of the IAU, Joint Discussion 3, 16-17 August, 2006, Prague, Czech Republic, JD03, #72, 3,
- Chen & Shibata (2000) Chen, P. F., & Shibata, K. 2000, ApJ, 545, 524
- Chifor et al. (2006) Chifor, C., Mason, H. E., Tripathi, D., Isobe, H., & Asai, A. 2006, A&A, 458, 965
- Chifor et al. (2007) Chifor, C., Tripathi, D., Mason, H. E., & Dennis, B. R. 2007, submitted to A&A
- Feynman & Martin (1995) Feynman, J., & Martin, S. F. 1995, J. Geophys. Res., 100, 3355
- Forbes (1990) Forbes, T. G. 1990, J. Geophys. Res., 95, 11919
- Forbes (2000) Forbes, T. G. 2000, J. Geophys. Res., 105, 23153
- Forbes & Isenberg (1991) Forbes, T. G., & Isenberg, P. A. 1991, ApJ, 373, 294
- Hale et al. (1919) Hale, G. E., Ellerman, F., Nicholson, S. B., & Joy, A. H. 1919, ApJ, 49, 153
- Hundhausen (1993) Hundhausen, A. J. 1993, J. Geophys. Res., 98, 13177
- Handy et al. (1999) Handy, B. N., et al. 1999, Sol. Phys., 187, 229
- Isobe & Tripathi (2006) Isobe, H., & Tripathi, D. 2006, A&A, 449, L17
- Isobe et al. (2007) Isobe, H., Tripathi, D., Asai, A., & Jain, R. 2007, Sol. Phys., submitted
- Kahler et al. (1988) Kahler, S. W., Moore, R. L., Kane, S. R., & Zirin, H. 1988, ApJ, 328, 824
- Lin et al. (2001) Lin, J., Forbes, T. G., & Isenberg, P. A. 2001, J. Geophys. Res., 106, 25053
- Low (1996) Low, B. C. 1996, Sol. Phys., 167, 217
- Martin (1980) Martin, S. F. 1980, Sol. Phys., 68, 217
- Moore & Roumeliotis (1992) Moore, R. L., & Roumeliotis, G. 1992, LNP Vol. 399: IAU Colloq. 133: Eruptive Solar Flares, 399, 69
- Ohyama & Shibata (1997) Ohyama, M., & Shibata, K. 1997, PASJ, 49, 249
- Priest et al. (1989) Priest, E. R., Hood, A. W., & Anzer, U. 1989, ApJ, 344, 1010
- Rompolt (1990) Rompolt, B. 1990, Hvar Observatory Bulletin, 14, 37
- Scherrer et al. (1995) Scherrer, P. H., et al. 1995, Sol. Phys., 162, 129
- Shibata et al. (1995) Shibata, K., Masuda, S., Shimojo, M., Hara, H., Yokoyama, T., Tsuneta, S., Kosugi, T., & Ogawara, Y. 1995, ApJ, 451, L83
- Shibata et al. (1994) Shibata, K., Nitta, N., Strong, K. T., Matsumoto, R., Yokoyama, T., Hirayama, T., Hudson, H., & Ogawara, Y. 1994, ApJ, 431, L51
- Sterling & Moore (2004) Sterling, A. C., & Moore, R. L. 2004, ApJ, 613, 1221
- UeNo et al. (2004) UeNo, S., Nagata, S., Kitai, R., & Kurokawa, H. 2004, The Solar-B Mission and the Forefront of Solar Physics, 325, 319
- Wang et al. (2007) Wang, H., Liu, C., Jing, J., & Yurchyshyn, V. 2007, submitted to ApJ
- Wang et al. (2006) Wang, Y., Xue, X., Shen, C., Ye, P., Wang, S., & Zhang, J. 2006, ApJ, 646, 625
- Wang & Shi (1993) Wang, J., & Shi, Z. 1993, Sol. Phys., 143, 119
- Wang & Sheeley (1999) Wang, Y.-M., & Sheeley, Jr., N. R. 1999, ApJ, 510, L157
- Yan & Sakurai (1997) Yan, Y., & Sakurai, T. 1997, Sol. Phys., 174, 65
- Yashiro et al. (2004) Yashiro, S., Gopalswamy, N., Michalek, G., St. Cyr, O. C., Plunkett, S. P., Rich, N. B., & Howard, R. A. 2004, J. Geophys. Res., 109, 7105
- Zhang et al. (2001) Zhang, J., Dere, K. P., Howard, R. A., Kundu, M. R., & White, S. M. 2001, ApJ, 559, 452
| Time(UT) | Event |
|---|---|
| 18:40 | Brightening in region T begins. (195 Å) |
| 19:05 | GOES Soft X-Ray flux peak at C2.9aaWe consider this event as a direct trigger of the filament eruption; see text. |
| 19:22 | Brightening in region C (HÅ) |
| 19:24 | Filament 1 begins to rise (H Å) |
| 19:24 | Filament 2 begins to brighten and rise (195 Å) |
| 19:27 | GOES Soft X-Ray flux first peak at X1.5 |
| 20:00 | GOES second peak, faint eruption (195 Å) |
| 20:00 | Halo CME with the speed of (LASCO C2) |
| timeaaThe timescale of flares are based on the data of GOES X-ray flux. See http://www.ngdc.noaa.gov/stp/SOLAR/ftpsolarflares.html | ||||||
|---|---|---|---|---|---|---|
| date | start | peak | end | GOES class | CME | location [group] |
| Sep. 12th | 00:45 | 00:49 | 00:53 | C3.3 | None | region C [group II] |
| 02:42 | 02:48 | 02:53 | C2.0 | None | region C [group II] | |
| 04:49 | 05:05 | 05:27 | M1.5 | None | region C [group II] | |
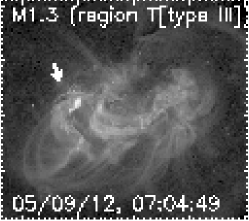
| 06:56 | 07:01 | 07:05 | M1.3 | None | region T (failed eruption) [group III] | |
| 08:37 | 09:03 | 09:20 | M6.1 | CME | region C (eruption) [group II] | |
| 15:33 | 15:37 | 15:42 | C1.1 | None | region C [group II] | |
| 16:29 | 16:33 | 16:35 | C1.1 | None | region T [group III] | |
| 16:35 | 16:38 | 16:40 | C1.2 | None | region T [group III] | |
| 19:28 | 19:40 | 19:42 | C3.2 | None | jet [group IV] | |
| 20:05 | 20:09 | 20:11 | M1.5 | None | region T [group III] | |
| 22:07 | 22:25 | 22:42 | C7.2 | None | region C [group II] | |
| 22:57 | 23:01 | 23:03 | C5.6 | None | to the southwest of delta-type spot | |
| 23:12 | 23:17 | 23:23 | C5.5 | None | region T [group III] | |
| Sep. 13th | 00:53 | 00:58 | 01:02 | C4.3 | None | region T [group III] |
| 03:21 | 03:27 | 03:31 | C3.4 | None | region T [group III] | |
| 03:57 | 04:00 | 04:02 | C1.5 | None | jet [group IV] | |
| 04:15 | 04:18 | 04:20 | C1.9 | None | region T [group III] | |
| 04:37 | 04:45 | 04:54 | C5.1 | None | region T [group III] | |
| 06:31 | 06:35 | 06:37 | C1.2 | None | region T [group III] | |
| 08:24 | 08:28 | 08:31 | C1.8 | None | region T? [group III?] | |
| 10:41 | 11:21 | 11:24 | M1.3 | None | region C [group II] | |
| 13:11 | 13:43 | 13:53 | C4.5 | None | region C [group II] | |
| 18:49 | 19:05 | 19:15 | C2.9 | None | region T [group III] | |
| 19:19 | 19:27 | 20:57 | X1.5 | halo CME | filament eruption along NL [group I] | |
| 23:15 | 23:22 | 23:30 | X1.7bbIn this study, we do not refer to this event. | CME | above the delta-type spot | |
 |
 |
 |
 |
 |
 |
 |
 |
 |
 |
 |
 |
 |
 |
 |
 |
 |
 |
 |
 |
 |
 |
 |
 |
 |
 |
 |
 |
 |
 |
|
 |
 |
 |
 |
 |
 |
 |
 |
 |
 |
 |
 |
 |
 |
 |
 |
 |
 |
 |
||
 |
 |
 |
 |
 |
 |
 |
 |
 |
 |