The Disk and Extraplanar Regions of NGC 2403 11affiliation: Based on observations obtained with the MegaPrime/MegaCam, a joint project of the CFHT and CEA/DAPNIA, at the Canada-France-Hawaii Telescope (CFHT), which is operated by the National Research Council (NRC) of Canada, the Institut National des Sciences de l’Univers of the Centre National de la Recherche Scientifique (CNRS) of France, and the University of Hawaii 22affiliation: Visiting astronomer, Canada-France-Hawaii Telescope (CFHT), which is operated by the National Research Council (NRC) of Canada, the Institut National des Sciences de l’Univers of the Centre National de la Recherche Scientifique (CNRS) of France, and the University of Hawaii 33affiliation: This publication makes use of data products from the Two Micron All Sky Survey, which is a joint project of the University of Massachusetts and the Infrared Processing and Analysis Center/California Institute of Technology, funded by the National Aeronautics and Space Administration and the National Science Foundation.
Abstract
Wide field images obtained with WIRCam and MegaCam on the Canada-France-Hawaii Telescope are used to probe the spatial distribution of young stars in the Sc galaxy NGC 2403. Bright main sequence stars and blue supergiants are detected out to projected galactocentric distances of kpc ( disk scale lengths) along the major axis. The star formation rate (SFR) in the disk of NGC 2403 during the past 10 Myr has been 1 M⊙ year-1 based on the number of bright main sequence stars. The radially-averaged number density of red supergiants (RSGs) per unit band surface brightness is constant throughout the disk, indicating that (1) RSGs follow the integrated band light, and (2) the SFR per unit mass has been constant with radius when averaged over time scales of a few tens of millions of years. The mean color of RSGs varies with galactocentric distance, suggesting that there is a metallicity gradient among recently formed stars. A comparison of the radially-averaged number density of bright main sequence stars also indicates that the SFR per unit stellar mass in NGC 2403 has been higher than in NGC 247 during recent epochs, and this is in rough agreement with what would be predicted from the far infrared fluxes of these galaxies. Finally, the data are used to investigate the extraplanar regions of NGC 2403. A population of M giants with peak brightness M is detected at projected distances between 12 and 14 kpc above the disk plane, and six new globular cluster candidates are identified.
1 INTRODUCTION
Galaxies with disk-like morphologies appear to be common at high redshift (e.g. Marleau & Simard 1998; Labbe et al. 2003), and these objects have almost certainly experienced significant evolution to the present day. It is likely that many of these systems have been consumed in the formation of larger galaxies, including spiral galaxies in the nearby Universe. While the frequency of merger activity that forms Milky-Way sized objects is predicted to have peaked Gyr in the past (Zentner & Bullock 2003; Bullock & Johnson 2005), significant merger activity likely continues to the present day. Indeed, based on the frequency of infrared luminous galaxies at intermediate redshifts, Hammer et al. (2005) argue that of intermediate mass spiral galaxies experienced a major merger in the past 8 Gyr. Simulations suggest that such large mergers may not destroy the disk of the dominant galaxy, but may simply provide material for disk growth (Volker & Hernquist 2005; Robertson et al. 2006).
If disk assembly continues to recent epochs then evidence of this activity might be found in nearby spiral galaxies, including the large scale properties of the disks themselves. As time progresses it is likely that objects with progressively higher angular momentum will be accreted. Disks will then grow from the inside out, and there will be two observational consequences. First, the assimilation of material with high angular momentum will cause disks to evolve to larger sizes, and so distant disks will be physically smaller than nearby objects. Unfortunately, the measurement of disk size is not a straight-forward task. Narayan & Jog (2003) point out that the measurement of disk size from surface brightness measurements is complicated by photometric depth effects, and argues that this has lead to the underestimation of disk sizes in previous studies. Our understanding of how to gauge disk size may also be uncertain, as deep photometric studies of moderately large samples of galaxies reveal a diversity in characteristic light profiles at large galactocentric radii, with some systems showing truncated disk light profiles, while others show no evidence of disk truncation, and even the onset of structures that are structurally distinct and more extended than the inner disks (Erwin, Beckman, & Pohlen 2005). Still, Trujillo & Aguerri (2004) and Trujillo & Pohlen (2005) find that the characteristic scale lengths of disks near redshift are smaller than those of nearby systems, indicating evolution in disk size (but see also Lilly et al. 1998).
The second observational consequence of inside-out disk formation is that the stellar content of the outer and inner disks may differ. Gas accreted from satellites will almost certainly have experienced a chemical enrichment history that differs from that of the larger seed disk. Stars that form from material with only modest chemical enrichment will have a distinct chemical signature, and might produce a break in underlying abundance trends that were set in place earlier, although the radial mixing of disk material due to viscosity or tidal stirring will blur such trends. An age gradient may also be present if the outer regions of the disk have recently accreted gas-rich systems, which may cause the outer disk to have a younger mean age than the inner regions.
The study of the distribution of stars perpendicular to the disk plane also provides clues into disk evolution. Deep imaging studies of the extraplanar regions of disk-dominated galaxies reveal a moderately metal-poor extraplanar component (Davidge 2003; Davidge 2005; Davidge 2006a; Seth, Dalcanton, & de Jong 2005), the presence of which was orginally detected in integrated light studies (e.g. Dalcanton & Bernstein 2002). The metallicity and spatial distribution of the extraplanar stars is suggestive of a disk origin, and Seth et al. (2005) interpret the distribution of stars in their sample as the result of heating by spiral density waves and/or scattering by molecular clouds, although the accretion of companion systems is another possible mechanism (e.g. Yoachim & Dalcanton 2006; Bensby et al. 2005).
As one of the closest ensembles of late-type galaxies, the M81 group is an important laboratory for probing disk evolution. The Sc galaxy NGC 2403 is an interesting member of this group as its integrated brightness, morphology, and environment do not differ greatly from those of the Local Group Sc galaxy M33, which is a benchmark for understanding late-type spiral galaxies. NGC 2403 has a modest entourage of four dwarf irregular galaxies and one dwarf spheroidal galaxy. The crossing time of the NGC 2403 mini-system is Gyr; hence, the system is not yet virialized (Karachentsev et al. 2002). NGC 2403 is close enough that its brightest stars can easily be resolved with ground-based facilities, and it is viewed at an oblique angle, permitting the distribution of stars both on and off the disk plane to be investigated.
There have only been a few previous investigations of the stellar content of NGC 2403, and these examined a modest fraction of the total galaxy. The innermost regions of NGC 2403 harbour a nucleus that is bluer than that in M33 (Davidge & Courteau 2002), suggesting that nuclear star formation occured more recently in NGC 2403. Still, when considering the properties of the brightest resolved red supergiants (RSGs) and asymptotic giant branch (AGB) stars near the nucleus, Davidge & Courteau (2002) conclude that – when averaged over Gyr timescales – the star-forming histories of the central regions of NGC 2403 and M33 have been similar.
Davidge (2003) used deep GMOS images to study the stellar content along the minor axis of NGC 2403. Projected distances between 5 and 11 kpc on the plane of the sky were covered, and a mix of disk and halo stars were found. Young stars in these data are restricted to projected galactocentric distances kpc along the disk plane. As for older stars, the mean color of the red giant branch (RGB) changes across the field. This is almost certainly a metallicity effect, such that [Fe/H] closest to the center of the galaxy and [Fe/H] in the outermost portion of the field. The latter metallicity is suggestive of a halo component with no disk contribution, while the former is consistent with a disk population. A number of bright AGB stars were also identified throughout the field, suggesting that an intermediate age population is present.
With the advent of visible and near-infrared imagers that cover large angular fields it is now possible to survey the disk of NGC 2403 in its entirety, and conduct a comprehensive census of its brightest stars. In the current study, wide-field near-infrared and visible wavelength observations of NGC 2403 obtained with WIRCam and MegaCam on the Canada-France-Hawaii Telescope (CFHT) are used to chart the spatial distribution of stars at various stages of evolution. The goals of this study are (1) to investigate the spatial distribution of the brightest stars with respect to the integrated light, with particular emphasis on the outer regions of the disk, (2) to search for possible systematic stellar population gradients throughout the disk, (3) to further investigate the nature of the extraplanar AGB stars detected by Davidge (2003), and (4) to search for globular clusters.
The distance modulus measured from Cepheids by Freedman & Madore (1988) is adopted throughout this study, as is the foreground extinction from the Schlegel, Finkbeiner, & Davis (1998) maps, which is A. The correction for internal extinction in NGC 2403 is expected to be signficant, given that the galaxy is actively forming stars and is observed at an oblique angle. To account for this, the internal extinction computed by Pierce & Tully (1992), as deduced from the model of Fouqué & Tully (1985), is applied to all CMDs and LFs in §§4 and 5.
The paper is structured as follows. Details of the observations and the data reduction procedures can be found in §2, while the photometric measurements and the CMDs are discussed in §3. The spatial distributions of disk stars at various evolutionary stages are examined in §4, while the properties of stars and candidate globular clusters in the extraplanar regions are explored in §5. A summary and discussion of the results follows in §6.
2 OBSERVATIONS AND DATA REDUCTION
2.1 MegaCam Data
Deep , and images of NGC 2403 were obtained with the CFHT MegaCam during the night of November 22, 2003. MegaCam is a mosaic of thirty six pixel2 CCDs that are deployed in a configuration. There is a 13 arcsec gap between adjacent CCDs. Each pixel samples 0.19 arcsec on a side, and a degree2 area is covered with each exposure. A more detailed description of MegaCam has been given by Boulade et al. (2003).
The data were recorded as a series of 200 sec exposures with NGC 2403 positioned near the center of the detector mosaic. Eight such exposures were recorded in , five in , and six in . The initial processing of the MegaCam data was done with the Elixir pipeline at CFHT, and this consisted of bias subtraction and flat-fielding. A calibration frame to suppress interference fringes was also subtracted from the data.
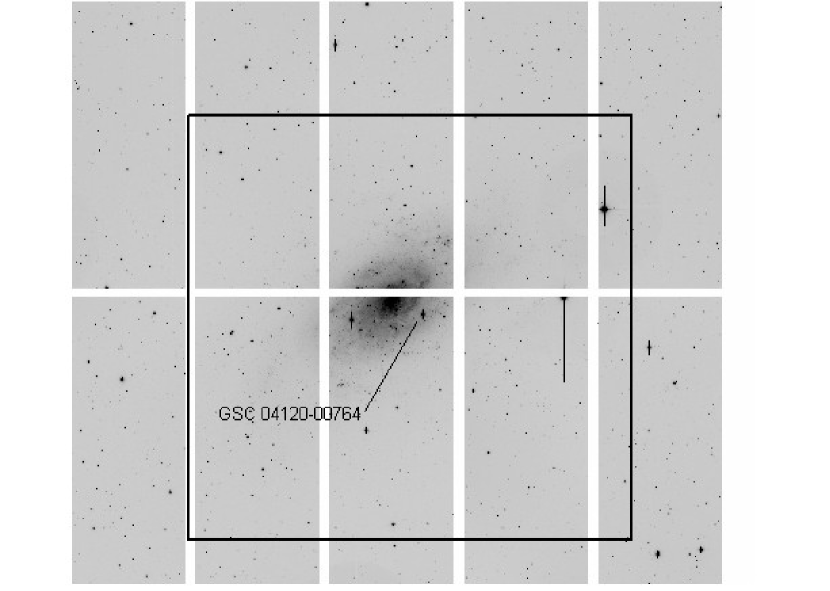
Additional processing was done at HIA Victoria. The Elixir-processed images were spatially registered and then median-combined. The results were trimmed, such that each CCD samples the area that is common to all exposures. Stars in the processed data have FWHMs of 1.2 arcsec in , 1.1 arcsec in , and 1.0 arcsec in . The final images of the ten MegaCam CCDs that sample the disk and inner halo of NGC 2403 are displayed in Figure 1.
2.2 WIRCam Data
Moderately deep , and images of NGC 2403 were recorded with the CFHT WIRCam during the nights of November 19 and 20, 2005. The detector in WIRCam is a mosaic of four pixel2 HgCdTe arrays that are deployed in a layout. There is a 45 arcsec gap between adjacent arrays. Each pixel subtends 0.3 arcsec on a side, and a arcmin2 field is covered in a single exposure. Puget et al. (2004) give a more detailed description of WIRCam.
The data were recorded as a series of short exposures distributed over a six point dither pattern. The total exposure times were 2640 sec in , 1680 sec in , and 2400 sec in . The data were processed with a standard pipeline for near-infrared imaging that includes (1) dark subtraction, (2) flat-fielding, (3) the removal of interference fringes and thermal emission artifacts from warm objects along the light path, and (4) the subtraction of a DC sky level from each image. The calibration frames used in the third step were constructed from observations of a background field. The processed images were spatially registered, median-combined, and then trimmed to the area common to all exposures. Stars in the processed data have FWHMs of 0.9 arcsec in , and 0.8 arcsec in and . The region covered by the WIRCam data is marked in Figure 1.
2.3 CFHT Adaptive Optics Data
Deep and images were obtained of a field in the disk of NGC 2403 with the CFHT Adaptive Optics Bonnette (AOB) and KIR imager on the night of March 9, 2001. The AOB is a natural guide star system, and a detailed description is given by Rigaut et al. (1998). The disk field is centered on the star GSC 04120–00764, which was the reference source for AO correction; the star is labelled in Figure 1. The sky conditions were not photometric, as thin clouds were present when these data were obtained.
The KIR camera contains a pixel HgCdTe array with 0.034 arcsec pixels; therefore, a arcsec 2 field is covered with each exposure. The data were recorded as a series of 60 second exposures, with a total exposure time of 1200 sec filter-1. The data were processed with the same pipeline for near-infrared imaging that was described in §2.2. The seeing was poor when these data were recorded, and the image quality of the final data ranges from 0.2 arcsec in to 0.4 arcsec in . Still, the angular resolution of these data is superior to that obtained with WIRCAM, and so they can be used to assess the effects of crowding at the faint end of the WIRCam observations.
Observations of the center of NGC 2403, which were obtained with the AOB and were used previously by Davidge & Courteau (2002), are also considered in this study. These data have an angular resolution of 0.15 – 0.20 arcsec FWHM, depending on the filter. Additional details of the observations and their reduction can be found in Davidge & Courteau (2002).
3 RESULTS
3.1 Photometric Measurements
The photometric measurements were made with the point spread function (PSF) fitting routine ALLSTAR (Stetson & Harris 1988). The target lists, preliminary brightnesses, and PSFs that serve as the input to ALLSTAR were obtained from routines in the DAOPHOT (Stetson 1987) package. Photometry of sources in the WIRCam and MegaCam data was done on an array-by-array basis. While this is more labour intensive than measuring brightnesses from a single mosaiced image, as a single PSF must be constructed for each array, this process better accounts for variations in image quality and optical distortions across the (wide) science fields of both instruments.
It is standard procedure for a Landolt (1992) standard star field to be observed at the beginning of every clear night of MegaCam queue observing. The standard star observations from various nights are then used to establish a single zeropoint for each run, and the results are inserted into image headers during Elixor processing. These zeropoints were used to calibrate the MegaCam observations of NGC 2403.
The WIRCam observations were calibrated using objects in the 2MASS Point Source Catalogue (Cutri et al. 2003). Only sources with were considered, as the uncertainties in the band 2MASS photometry are smaller than magnitudes in this brightness range. The uncertainty in the zeropoints are typically magnitudes filter-1 array-1. The individual arrays have measurably different zeropoints that differ by magnitude, depending on the filter.
The CFHT AOB observations were calibrated using the brightnesses of GSC 04120 – 00764 in the 2MASS Point Source Catalogue; no other sources in the AOB field are bright enough to serve as an independent calibrator. The use of a single object to define the photometric calibration introduces obvious uncertainties. However, it is demonstrated in §3.4 that the brightnesses and colors of stellar sequences in the AOB data are broadly consistent with those in other datasets. Anisoplanicity, which causes the shape of the PSF to vary with distance from the AO guide star, is another potential source of uncertainty in photometric measurements made from AO-corrected data. However, previous experience with the AOB indicates that anisoplanicity is typically not significant over the field imaged with KIR, even in data recorded when atmospheric conditions are such that low Strehl ratios are delivered (e.g. Davidge 2001).
Artificial star experiments were run to assess completeness and estimate the scatter in the photometry due to photon noise and crowding. The artificial stars were assigned brightnesses and colors that are typical of objects in NGC 2403. The results depend on the distance from the center of the galaxy, although the 50% completeness limit throughout most of the NGC 2403 disk occurs near and . The predicted color dispersions at are typically magnitudes and magnitudes throughout most of the disk, while for the WIRCAM data the predicted color dispersions at are typically magnitudes and magnitudes.
Background galaxies are a significant source of contamination near the faint limit of these data, and efforts to identify extended objects will be beneficial. The number of background galaxies can be estimated from published surveys. McCracken et al. (2000) summarize band galaxy counts from a number of studies, and the data in their Figure 1 indicates that there are galaxies deg-2 when . This implies that galaxies with might be present in the WIRCam science field. The veracity of this estimate is affected by cosmic dispersion, and the GalaxyCount (Ellis & Bland-Hawthorn 2007) routine suggests that there is a uncertainty in the number of galaxies.
In an effort to reject obviously extended objects from the MegaCam and WIRCam data, a threshold value of the DAOPHOT sharp parameter, which measures the compactness of a source, was computed from the artificial star experiments. The ability to reject extended objects at the faint end is complicated by (1) noise, which hinders the calculation of reliable shape statistics for individual objects, and (2) image quality, which smears the signal for small objects. Still, the application of even a relatively conservative threshold allows objects that have obviously non-stellar light profiles to be culled from the data.
3.2 The MegaCam Data
The and CMDs of sources in four selected MegaCam CCDs are shown in Figure 2. The CMDs of these particular CCDs are shown because they illustrate the colors and brightnesses of key features that will be used throughout this study. Data from a larger number of CCDs, which sample the entire disk of NGC 2403 and its surroundings, are considered in §4.
The left hand panels of Figure 2 show the CMDs of control regions that are distinct from the disk of NGC 2403. The bright end of the control region CMD is dominated by the blue and red foreground star sequences that are predicted by Galactic structure models (Fan 1999). The blue sequence is made up of stars near the main sequence turn off (MSTO) in the Galactic halo, while the red sequence is made up of lower mass main sequence stars in the Galactic disk. The blue sequence in the MegaCam data is less well defined than the red sequence, in qualitative agreement with the Fan (1999) simulations. The North Galactic Pole (NGP) model considered by Fan (1999) predicts a characteristic color for the blue sequence at , while for the red sequence . NGC 2403 is not near the NGP; still, when the blue foreground sequence in the control field CMD has , while for the red sequence .
The right hand panels of Figure 2 show the CMDs of stars in the disk of NGC 2403. There is a broad blue plume in both the and CMDs that is made up of blue supergiants (BSGs) and high mass main sequence stars. This sequence falls to the left of the blue foreground star plume, thereby simplifying the task of detecting BSGs and massive main sequence stars in regions of NGC 2403 that have low stellar density.
Red supergiants (RSGs) dominate the red portions of the NGC 2403 and CMDs. The brightest RSGs form a finger-like sequence in the CMD, that peaks near , and has . Stars evolving on the AGB are found in the CMDs when and ; the faint limit of the data is such that the brightest AGB stars are not sampled in the CMDs.
3.3 The WIRCam Data
The CMDs of sources in two quadrants of the WIRCam array that sample the major and minor axes of NGC 2403 are shown in the top row of Figure 3; the CMDs are not shown as they are very similar to the CMDs. The CMDs are dominated by stars in the Galactic disk when , and foreground stars account for the vast majority of objects with . Low mass stars in the Galactic disk populate the sequence with , the color of which is indicative of M dwarfs (Bessell & Brett 1988).
Contamination from background galaxies is significant at faint magnitudes. This being said, the observed near-infrared spectral-energy distributions (SEDs) of background objects differ significantly from those of the majority of stars in NGC 2403. The mean redshift of galaxies with is (Cowie et al. 1996). Applying the k-corrections from Mannucci et al. (2001), a normal galaxy will have and ; in fact, a clump of objects with and can be seen in the minor axis CMD. For comparison, M giants have and (Bessell & Brett 1988). The comparatively red colors of intermediate redshift galaxies are a consequence of the first overtone CO bands, which are amongst the strongest absorption features in the spectra of normal galaxies, being red shifted out of the bandpass of the filter. Even though intermediate redshift galaxies have infrared SEDs that differ from the majority of evolved stars in NGC 2403, it was decided not to cull the WIRCam data by applying a color threshold to avoid deleting the reddest stars in NGC 2403. Still, the reader should keep in mind that the majority of the reddest objects are probably background galaxies.
The objects detected in the WIRCam data that belong to NGC 2403 are RSGs and AGB stars. RSGs form a plume in the CMD that is slightly redder than the foreground star sequence, while objects that are evolving on the upper AGB form a tangle of red stars with and . The RSG sequence in NGC 2403 peaks near M, while the AGB sequence peaks near . These peak brightnesses are similar to those seen in other nearby spiral galaxies (e.g. Davidge 2005; 2006a,b).
The MegaCam and WIRCam data have been combined to create a data set with broad wavelength coverage, and therefore increased sensitivity to metallicity and age. The WIRCam and MegaCam data have different pixel sampling, and this could introduce systematic effects in the photometry, especially in crowded fields. In an effort to reduce such systematic effects, the images from the MegaCam CCDs that overlap with the WIRCam data were re-sampled to the 0.3 arcsec pixel spacing of the WIRCAM data, and DAOPHOT was run on the result. Whereas combining the and data would offer even greater wavelength leverage, the number of objects that are common to both the and observations is modest, and it was decided that combining the and data would serve as a suitable compromise between wavelength coverage and sample size.
The CMDs constructed from these data are shown in the bottom row of Figure 3. The number of objects in these CMDs is relatively modest when compared with the WIRCam or MegaCam datasets alone since (1) the gaps between the individual detectors in the WIRCam and MegaCam arrays do not overlap, with the result that sky coverage is reduced, and (2) only the brightest and most highly evolved stars in NGC 2403 are sampled when observations spanning such a wide wavelength range are combined. Indeed, the main sequence, which is prominent in the and CMDs, is abscent in the lower panels of Figure 3 because of the faint limit of the band observations; consequently, the spray of objects with is made up of foreground stars.
RSGs and AGB stars dominate the CMD when ; the majority of RSGs have , whereas the AGB stars have . The red cut-off in the lower panels of Figure 3 is defined by the faint limit of the observations, and the intrinsically reddest evolved stars in the NGC 2403 disk are probably missing from these CMDs. Indeed, the reddest stars in the CMDs have colors that suggest that the latest M giants are not sampled. Fukugita et al. (1996) give a transformation equation relating and , and this can be used to compute colors if a relation between and is also adopted. For the current work it is assumed that , based on the properties of solar neighborhood M giants (Bessell & Brett 1988). The reddest objects in the CMDs are then found to have , which is appropriate for giants of spectral type M6 (Bessell & Brett 1988). For comparison, giants with later spectral-types are expected in NGC 2403 (§4.1), and it is likely that these stars fall below the faint limit of the data.
3.4 Data
The and CMDs obtained from the AOB KIR images are shown in the upper row of Figure 4. The stars in the CMDs are evolving on the AGB; the absence of bright RSGs in these data is a consequence of the small area sampled with KIR, coupled with the modest spatial density of these objects in this portion of NGC 2403. It should be emphasized that the peak AGB brightness in these data is highly uncertain, not only because the photometric calibration is based on only one object (§3.1), but also because of photometric variability and stochastic effects. Still, the peak brightness in the upper row of Figure 4 is , which corresponds to M, and is consistent with the AGB-tip brightness predicted by models (Girardi et al. 2002).
The AOB disk field falls in a gap between WIRCam arrays, and so it is not possible to make a direct comparison with the WIRCam photometry. However, the central field observed by Davidge & Courteau (2002) is in the WIRCam images; thus, a direct comparison can be made between the AOBKIR photometry from Davidge & Courteau (2002) and the WIRCam photometry. This is a rigorous test of the WIRCam photometry, as the central arcsec of NGC 2403 is a crowded environment. Unlike the disk AO field, the central AO field was observed during photometric conditions. The photometric calibration of these data is based on observations of UKIRT faint standards (Hawarden et al. 2001), and the uncertainty in the photometric zeropoints is magnitudes.
The and CMDs of the central field from Davidge & Courteau (2002) are shown in the middle row of Figure 4, while the CMDs of the same region extracted from the WIRCam data are shown in the bottom row. The peak brightnesses in the AOB and WIRCam central field data sets are in excellent agreement. While there is more scatter in the WIRCam data, the mean colors of the sequences in the two data sets are also in reasonable agreement. An object-by-object comparison of the band brightnesses of sources with between 16 and 17.5 gives a difference magnitudes, where the difference is in the sense WIRCam – AOB and the error is the standard uncertainty in the mean. It thus appears that crowding does not greatly bias the photometric properties of the brightest stars in the WIRCam observations, even near the center of NGC 2403. This is because the AGB and RSG sequences on near-infrared CMDs are more extended along the magnitude axis than at visible wavelengths, leading to a greater degree of contrast with respect to the main body of fainter stars.
4 THE SPATIAL DISTRIBUTION OF STARS IN THE DISK OF NGC 2403
4.1 General Trends and Comparisons with Models
The CMDs of stars in 2 kpc-wide annular intervals are shown in Figures 5 - 8. The computation of RGC for each star assumes that the sources are in the disk plane, which in turn is inclined to the line of sight by 53o (Pierce & Tully 1992). The CMDs are not shown because they provide information that is similar to the CMDs.
The CMDs of the kpc and kpc intervals do not go as deep as those at larger RGC owing to the higher stellar density near the center of NGC 2403. This being said, the inner annuli sample relatively small areas on the sky, and so there is only modest contamination from foreground stars and background galaxies. The foreground star sequence becomes more pronounced in the CMDs as RGC increases as progressively larger areas on the sky are sampled.
The plume of main sequence stars and BSGs that is a prominent feature in the CMDs has been used to probe interstellar extinction associated with young stars throughout the disk of NGC 2403. To do this, the mean color and width of the main sequence in the CMDs were computed for stars with . The dispersion about the mean color for these stars is remarkably constant with radius, with magnitudes. This is more than a factor of two larger than the width expected solely from observational errors. In addition to differential reddening, it is likely that stellar evolution, binarity, and photometric variability also contribute to broadening the main sequence; nevertheless, adopting the plausible assumption that these other sources of broadening are fixed throughout the NGC 2403 disk, then the detection of a uniform main sequence width suggests that the amount of differential reddening does not change throughout the disk of NGC 2403.
The mean color of the blue sequence varies with radius in NGC 2403, with between 0 and 4 kpc, and between 6 and 10 kpc. This change in mean color suggests that there is a radial gradient in the mean extinction associated with young stars in the disk of NGC 2403, such that in the central 4 kpc is 0.1 magnitudes higher than at larger radii. Using the model of Tully & Fouqué (1985), Pierce & Tully (1998) estimate that the internal extinction in NGC 2403 is A, which corresponds to using the relations in Appendix C of Schlegel, Finkbeiner, & Davis (1998). This internal extinction is adopted for R kpc throughout this study, while is adopted for R kpc. It should be kept in mind that the higher internal reddening found when R kpc is based on only the youngest stars in the disk, some of which are almost certainly still embedded in natal dust and gas, and that the internal extinction for older populations may be lower.
Young stars are detected out to R kpc in the NGC 2403 disk. Indeed, the main sequence can be seen in the CMD of the kpc interval, while a population of objects with main sequence-like colors is also seen in the kpc interval. The brightest blue objects in the 12 - 14 kpc interval have , which corresponds to M. This is the approximate peak brightness expected for main sequence stars (Humphreys & McElroy 1984), and so it appears that star formation is on-going in the outer regions of the NGC 2403 disk.
RSGs form a distinct finger that peaks near in the CMDs of stars with RGC between 6 and 10 kpc. Models that trace stellar evolution predict that the color of the RSG sequence at a fixed age is sensitive to metallicity. In Figure 9 the CMDs in the 2 – 4 and 8 – 10 kpc intervals are compared with Z = 0.008 and Z = 0.019 isochrones from Girardi et al. (2004). The locus of the RSG sequence in the outer interval is roughly matched by the Z = 0.008 models, and a similar metallicity was estimated for RSGs at intermediate radii in NGC 247. The comparisons in Figure 9 further suggest that the stars that populate the RSG plume have log(t) between 7.0 and 7.5.
The RSG sequence in the kpc interval is broader than at larger radii, and extends to redder colors. Models with metallicities between Z = 0.008 and Z = 0.019 roughly bracket the range of RSG colors in the kpc interval. The broad range in RSG colors is likely not due to patches of locally high internal reddening, given that the width of the main sequence in this interval is comparable to that at larger radii. Rather, the comparisons in Figure 9 suggest that RSGs in NGC 2403 have a similar metallicity when kpc, but that at smaller radii the RSGs span a range of metallicities.
How do the metallicities estimated for RSGs in NGC 2403 compare with abundance estimates for HII regions? Garnett et al. (1997) investigate the chemical compositions of HII regions throughout the disk of NGC 2403, and find radial gradients in the abundances of various elements. Consider those HII regions in the inner disk of NGC 2403. The sample of HII regions observed by Garnett et al. (1997) with R kpc typically have log[O/H] , which is within dex of solar. There is also a dispersion in oxygen abundances in this region, with two HII regions having [O/H] dex lower than average. Based on these observations one might expect to find (1) a population of RSGs with moderately high metallicities, and (2) RSGs spanning a range of metallicities. These expectations are consistent with the range in metallicities of RSGs with R kpc inferred from Figure 9.
Keeping in mind that [O/Fe] depends on star-forming history, there is reasonable agreement between the metallicities of RSGs and HII regions at larger RGC as well. At distances in excess of 6 kpc from the center of NGC 2403 the HII regions tend to have log[O/H] , or roughly one quarter solar. While based on only one point, located at R kpc, Figure 6 of Garnett et al. (1997) is consistent with a constant [O/H] when R kpc.
The CMDs of stars in the kpc and kpc intervals are compared with Z = 0.008 and Z = 0.019 models from Girardi et al. (2002) in Figure 10. The color of RSGs is less sensitive to metallicity than is , and the Z = 0.008 and Z = 0.019 sequences have characteristic colors that differ by only magnitude. This has an impact on the width of the RSG sequence; unlike what is seen in the CMD, the RSG plume in the kpc interval in Figure 10 is comparatively well-defined, peaking near . The RSG plume is bracketed by the Z = 0.008 and Z = 0.019 models, and is matched best by models with ages Myr, in agreement with what is seen in the CMDs. While RSGs are present in the kpc interval, the detection and characterization of individual RSGs at these RGC in the infrared is complicated by contamination from foreground stars, the majority of which have colors that are similar to RSGs.
The comparisons in Figure 10 underline the importance of observations at wavelengths longward of m for probing the AGB content of galaxies. Whereas AGB-tip stars with ages of at least 1 Gyr are detected in the CMDs, the comparisons in Figure 9 indicate that only the most luminous AGB stars, which have ages that are considerably less than 1 Gyr, are detected in the CMDs. It should also be recalled that the comparisons discussed in §3.4 indicate that the infrared photometric properties of bright AGB stars are not affected greatly by crowding.
The CMDs of the and kpc intervals are compared with Z = 0.008 and Z = 0.019 isochrones from Girardi et al. (2002) in Figure 11. Girardi et al. (2002) do not tabulate brightnesses, and so these were computed from the and band entries using the transformation relation from Fukugita et al. (1996). An important caveat is that this transformation relation was calculated from blue objects, and so the transformation becomes progressively more uncertain towards redder colors.
The RSG sequence in the CMD of stars in the kpc interval is not well-defined, as might be expected given the range of RSG colors in the CMD of the same radial interval. Indeed, as in Figure 9 the Z = 0.019 models in Figure 11 match the colors of the reddest objects, while the Z = 0.008 models match the blue envelope of RSGs in this radial interval. The RSG sequence is better defined in the CMD of objects in the kpc interval. The RSG plume has , and the red locus of the Z = 0.008 models is better able to match the RSG sequence than the Z = 0.019 models. In summary, the CMDs support the conclusions obtained from the CMDs regarding the metallicities of the brightest RSGs in the disk of NGC 2403.
4.2 Radial Trends and the Specific Frequencies of Stars in the Disk
Physical processes during disk formation and subsequent disk evolution may cause population gradients that will affect the properties of stars on spatial scales spanning much of the disk. Evidence for such trends have already been discussed; in §4.1 it was shown that the RSGs in the inner regions of NGC 2403 have a range of metallicities, whereas RSGs at larger radii have Z = 0.008. This suggests that the interstellar material from which these objects formed does not have a uniform metallicity; rather, there is metal-rich gas at small RGC that is not present at large RGC.
In addition to metallicity, mean age might also be expected to vary in the disk of NGC 2403. For example, if the central regions of the galaxy have been stoked with gas during recent epochs, then there might be an elevated density of young stars per unit mass in this portion of the galaxy. If high angular momentum gas has been accreted into the outer disk then there might be a higher density of young stars at large RGC. To investigate the spatial distribution of objects in NGC 2403, two samples of stars with differing ages were identified using their locations on CMDs. Main sequence stars and BSGs were identified from the CMDs, while RSGs were selected using the CMDs. The portions of the CMDs used to identify these stars are indicated in Figure 12, which shows the CMDs of stars in the kpc interval for illustrative purposes.
The spatial distributions of the blue and red stars are examined in Figure 13, where the projected (top row) and de-projected (lower row) locations of stars in each sample are compared. The blue stars trace the spiral structure of NGC 2403, and pockets of star-forming activity are seen. In contrast, the RSGs are more uniformly distributed; while a hint of spiral structure is evident, the knots of star-forming activity that are seen in the blue star distribution are absent. The relative behaviour of the two stellar types is consistent with stars being scattered from their place of birth as they age; similar behaviour has been documented in other galaxies (e.g. Thuan & Izotov 2005).
The comparisons in Figure 13 illustrate that while blue stars provide insight into the most recent episodes of star formation, as tracers of stellar content they may be prone to stochastic effects, especially in the outer regions of the disk. This is less of a concern for RSGs. Before proceeding to a more quantifiable means of assessing the distributions of the blue and red stars, it should be noted that the space velocities of RSGs in NGC 2403 can be estimated from the comparison in Figure 13 knowing (1) their approximate ages, and (2) the amount of spatial filtering that is required to suppress the appearance of distinct star-forming regions. Comparisons with stellar isochrones suggest that the main body of RSGs have ages million years. As for the second quantity, this can be estimated by applying gaussian filters to blue images of NGC 2403, and visually assessing when individual knots in the spiral arms can no longer be distinguished. It was found that smoothing with a gaussian kernel with a standard deviation kpc suppresses individual star-forming regions, and produces a diffuse disk like that seen in the right hand panel of Figure 13. Hence, the velocity dispersion of bright RSGs in the disk of NGC 2403 is km sec-1. While this is only an approximate quantity, with estimated uncertainties of , it is similar to the velocity dispersion of solar neighborhood Cepheids (Wielen 1974).
The light profile of NGC 2403 has been investigated at red wavelengths by Kent (1987), and in the remainder of this section we investigate the extent to which the radial distributions of RSGs and main sequence stars follow his light profile. In particular, the spatial distribution of young stars is traced by computing their specific frequencies. The specific frequency is a quantity that was originally developed by Harris & van den Bergh (1981) to measure the number of globular clusters per unit galaxy brightness. Here, this basic concept is extended to stars by calculating the number of stars in a given evolutionary stage per unit magnitude interval per unit integrated brightness. The specific frequency of main sequence stars or RSGs will change with radius in NGC 2403 if star-forming activity during the past few tens of millions of years has been concentrated in a given radial interval. This statistic is not sensitive to isolated pockets of star-forming activity, unless the localized SFR was of such intensity that the average annular SFR was significantly elevated.
The specific frequency measurements are based on the luminosity functions (LFs) of the blue and red stars within the color boundaries defined in Figure 12. The results, in which the number counts have been scaled as if each annulus samples a system with M using the band photometry from Kent (1987), are shown in Figures 14 and 15. The number counts have been corrected for light lost due to the gaps between detectors, as well as for contamination from foreground and background objects using the number counts of sources in the same color intervals in fields at large galactocentric distances along the minor axis of NGC 2403. The band surface brightness measurements used to compute the specific frequencies of stars with R kpc are those that are marked as ‘extended by hand’ in Kent’s Table II. The dashed line in each panel is the mean LF of stars located between 4 and 12 kpc from the galaxy center; this mean LF is shown to provide a benchmark to aid in determining if gradients are present. The error bars show Poisson uncertainties. The LFs of stars in the kpc interval are not shown, as crowding restricts the faint limit of these data, while the data for the kpc and kpc intervals have been combined to boost the signal-to-noise ratio.
The specific frequency measurements in Figure 14 suggest that the youngest stars in NGC 2403 are not uniformly distributed with radius. While there is reasonable agreement in the number density of blue stars with and RGC between 4 and 12 kpc, the specific frequency of blue stars in this magnitude range in the kpc interval exceeds that at intermediate galactocentric radii. There are also departures from the mean trend in the kpc interval when , although this is due to incompleteness at the faint end in the high density regions at small galactocentric radii.
The modest number of blue stars at large radii may affect the ability to search for population gradients in the outer disk. In fact, there is a net deficiency of stars with in the kpc interval in Figure 14, and this could arise if star formation in the outer disk has been more sporadic than at smaller radii. Such stochastic effects in star formation events are suppressed when longer time intervals are considered, such as is the case at the faint end of the LFs in Figure 14. It is thus significant that the specific frequency of blue stars at the faint end of the LF of the kpc interval matches that at intermediate radii.
The specific frequency of RSGs, as defined using the boundaries indicated in the right hand panel of Figure 12, is investigated in Figure 15. The specific frequency of RSGs varies when , although this may simply be due to flucuations in the numbers of the brightest and rarest RSGs. Indeed, the number density of RSGs with does not change throughout much of the disk of NGC 2403. Whereas there is evidence for an elevated specific frequency of blue stars in the kpc interval in Figure 14, the specific frequency of RSGs in this same interval is consistent with that at larger radii.
The RSGs used to construct the LFs in Figure 15 sample a larger range of ages than the BSGs and main sequence stars used to construct Figure 14. One consequence is that short timescale variations in the SFR should have a smaller impact on the LFs in Figure 15 than on the LFs in Figure 14. This is seen in the specific frequency measurements of RSGs in the kpc interval, which agree with the mean LF at all brightnesses; the gaps in star counts that are seen near the bright end of the kpc LF in Figure 14, are largely absent in Figure 15. The comparisons in Figure 15 indicate that RSGs in the disk of NGC 2403 follow the band light profile measured by Kent (1987). Thus, when averaged over time scales of a few tens of millions of years, the radially-averaged SFR throughout the disk of NGC 2403 has been uniformly distributed with respect to stellar mass in the disk.
5 THE EXTRAPLANAR REGIONS
5.1 AGB Stars in the Extraplanar Regions of NGC 2403
While the disk of NGC 2403 harbors the youngest, intrinsically brightest, stars in the galaxy, the extraplanar regions also contain stars that are bright enough to be detected with modest exposure times from ground-based telescopes. Davidge (2003) detected sources along the minor axis of NGC 2403 that are significantly brighter than the RGB-tip, and some of these are probably stars evolving on the AGB. The WIRCam data are of interest for identifying and characterizing such a component, as the contrast between the brightest AGB stars and any fainter underlying objects is greater in the near-infrared than at wavelengths shortward of m (§4.1). Moreover, the large field of view covered by WIRCam allows both legs of the minor axis (i.e. to the north east and south west of the galaxy) to be sampled with a single pointing.
The stellar content in two sub-fields of the WIRCam data that have identical projected areas on the sky and sample the north east and south west portions of the minor axis of NGC 2403, are examined to determine if a moderately bright AGB population is present. Stars in the outer regions of the NGC 2403 disk may be a significant source of contamination along the minor axis, and in §4 it was demonstrated that young disk stars can be traced out to kpc. In an effort to minimize contamination from stars in the outer disk, the minor axis fields considered in this paper are restricted to regions where R kpc along the disk plane, which corresponds to distances along the minor axis kpc. The fields, which will be referred to as NE and SW throughout the remainder of the paper, sample projected distances along the minor axis between 8.5 and 12.7 kpc from the disk plane. The NE field overlaps with the region investigated by Davidge (2003). These fields sample distances off the disk plane that exceed those probed by Seth et al (2005) in their sample of edge-on disk galaxies, but are similar to those examined by Mouhcine et al. (2005) in their study of nearby spirals.
The CMDs of the extraplanar fields are shown in Figure 16, and the CMDs of the NE and SW fields are very similar. The right hand panel of Figure 16 shows the CMD of a control field to the south and west of the SW field, which samples projected distances along the minor axis between 12.7 and 14.8 kpc and has an area that is comparable to that of each extraplanar field. The CMD of the control field is very similar to that of the NE and SW fields, despite sampling different distances off of the disk. It is evident that the vast majority of objects in the NE and SW fields are foreground stars or background galaxies.
In §3 it was argued that the majority of objects at the faint end of the WIRCam data are normal galaxies at intermediate redshift, which have , and so are redder than M giants in NGC 2403. It is then significant that the CMDs of the NE and SW fields contain a population of objects with and that is not present in the control field. The NE and SW fields contain comparable numbers of objects in this brightness and color interval, with 13 in the NE field, and 9 in the SW field; for comparison, only 3 objects are seen in the corresponding portion of the control field, and all of these are huddled close to . When the number of objects with in the NE and SW fields agree with that in the control field, indicating that the extraplanar fields contain a detectable number of objects only when M; while stars with M may be present in the extraplanar regions of NGC 2403, they do not occur in large enough numbers to allow them to be identified from number counts alone.
The RGB-tip in old systems has M (Ferraro et al. 2000), and so the stars detected in the NE and SW fields are evolving on the AGB. A crude age can be estimated from their peak brightness. Davidge (2003) measured the colors of bright RGB stars in the extraplanar regions of NGC 2403 and found that [Fe/H] outside of the disk. Assuming that the AGB stars have a similar low metallicity, then the isochrones tabulated by Girardi et al. (2002) predict that AGB stars with M have an age Gyr. There are significant uncertainties in such an age estimate, and these are discussed in §6.3.
5.2 Globular Clusters
The WIRCam data can be used to characterize globular clusters in NGC 2403. Indeed, if the globular cluster LF (GCLF) of NGC 2403 is like that in M31 (e.g. Barmby, Huchra, & Brodie 2001), then it will peak near M, which corresponds to at the assumed distance of NGC 2403. It can also be anticipated from the M31 GCLF that most of the globular clusters in NGC 2403 will have between 15.5 and 18.5, and so are well above the faint limit of the WIRCam data. In addition. all but the most compact globular clusters in NGC 2403 will appear as obvious non-stellar objects in the WIRCam data. Galactic globular clusters that belong to the old halo typically have half light radii parsecs, while young halo clusters may have even larger sizes (Mackey & van den Bergh 2005). Stars in the WIRCam data have FWHM arcsec, which corresponds to parsecs at the distance of NGC 2403. Hence, the majority of globular clusters in NGC 2403 will tend to have angular sizes that are at least a few tenths of an arcsec larger than stars in the WIRCam images.
Battistini et al. (1984) used photographic images to search for clusters in NGC 2403, and found 19 candidates. Five of the clusters marked in Figure 1 of Battistini et al. (1984) have been identified in the WIRCam data, and the near-infrared brightnesses and colors of these are listed in Table 1. These objects all have non-stellar light profiles, and the approximate characteristic size of each object, after accounting for the seeing disk, is listed in the last column of Table 1. The characteristic sizes of these objects tend to be larger than those of old halo Milky-Way globular clusters, and this is probably due to two reasons. First, in addition to bona fide globular clusters, the Battistini et al. (1984) sample also contains open clusters, stellar associations, and background galaxies. Second, while the image quality of the data used by Battistini et al. (1984) was not specified, it is probably poorer than that obtained with WIRCam, and this will skew the identification of cluster candidates to objects with larger sizes.
Also listed in Table 1 is a color computed from the and colors using Equation 23 of Fukugita et al. (1996). The Battistini et al. cluster candidates have a range of and colors. The majority of globular clusters in NGC 2403 would be expected to have if they are like the old clusters in the M31 cluster system. Three of the cluster candidates in Table 1 (F1, F46, and F16) have colors that are consistent with this prediction. However, two cluster candidates (F14 and F19) have the very red and colors that are characteristic of background galaxies (§3.3), rather than of globular clusters. Radial velocity measurements will provide a sure means of determining if F14 and F19 are galaxies at intermediate redshift, or clusters in NGC 2403 with large AGB populations, and hence red colors.
The WIRCam images were searched for additional globular cluster candidates using three screening criteria: (1) a non-stellar light profile, (2) , and (3) a location outside of the main body of the disk. Each of these criteria introduces biases. The first criterion biases against the detection of the smallest, most compact, clusters, although some of the candidates found here have characteristic sizes that are smaller than the peak of the size distribution of old Galactic halo clusters (e.g. Figure 4 of MacKey & van den Bergh 2005). The candidates were also inspected by eye to identify obvious non-cluster objects, such as the bulges of spiral galaxies. The second criterion introduces a bias against clusters that may contain a significant AGB population. AGB stars dominate the light output for systems with ages near Gyr (e.g. Maraston 1998), and clusters near this age will have very red colors. However, the absence of very luminous AGB-tip stars in the extraplanar regions suggests that such objects are likely not present in the fields we have surveyed. While clusters with ages Gyr may not be expected outside of the disk, the discovery of clusters with ages of Gyr may not be surprising, as some of the globular clusters in M33 appear not to be as old as those in the Milky-Way (e.g. Sarajedini et al. 1998). Finally, the third criterion, which was introduced to prevent contamination by old open clusters and asterisms, means that the portion of the galaxy where the density of globular clusters is expected to be greatest was not searched.
The locations and photometric properties of the six cluster candidates found in the WIRCam data are listed in Table 2. The co-ordinates are reliable to arcsec. If assumed to be at the distance of NGC 2403 then these objects have characteristic radii of a few parsecs, and so are comparable in size to the majority of Milky-Way globular clusters.
Combining the six objects found in the WIRCam data with the four clusters with in the Battistini et al. (1984) sample, then only likely cluster candidates have been identified so far in NGC 2403, and a number of others remain to be discovered. The number of globular clusters that might belong to NGC 2403 can be estimated by assuming that the cluster system is like that in M33, which is morphologically similar to NGC 2403. Christian & Schommer (1982) found 13 globular clusters in M33; the survey was not complete, and more clusters are likely present. Given that the MK of NGC 2403 is magnitudes brighter than M33 (Garrett et al. 2003), then the NGC 2403 cluster system should contain at least globular clusters. The majority of these will likely be at small RGC, where the cluster density is highest, and so will be projected against (or seen through) the disk. A problem searching for clusters in the disk is that there may be contamination from old disk clusters. There is also the potential for stellar asterisms to masquerade as young or intermediate age globular clusters, as has been found in M31 (Cohen, Matthews, & Cameron 2005). The secure detection of globular clusters in this environment will thus require images with high angular resolution.
6 SUMMARY AND DISCUSSION
Images obtained with WIRCam and MegaCam on the CFHT have been used to investigate the bright stellar content in the nearby Sc galaxy NGC 2403. The science fields of both instruments sample the entire disk and much of the halo of the galaxy in a single pointing. The result is an unprecedented census of the brightest main sequence stars, BSGs, RSGs, and AGB stars that spans the m wavelength interval. A new sample of globular cluster candidates is also identified. The data are used to search for large-scale radial trends in the spatial distribution of the youngest stars, with the goal of charting radial trends in the star-forming history during recent epochs, and determining the extent of the young stellar disk.
6.1 Star Formation in the Disk of NGC 2403 and Comparisons with NGC 247
The intensity of star-forming activity per unit stellar disk mass during the past 10 Myr appears to have varied with radius in NGC 2403. Evidence for this comes from the specific frequency measurements of bright main sequence stars BSGs in the kpc interval, which are higher than at larger radii. For comparison, the specific frequencies of RSGs, which sample a range of ages that exceeds that covered by the brightest main sequence stars, indicate that these objects tend to be uniformly distributed with older stars throughout the disk of NGC 2403. Thus, any increase in the SFR in the kpc interval must have occured on a timescale shorter than the onset of the RSG phase of evolution, which corresponds to Myr.
The recent galaxy-wide SFR in NGC 2403 can be estimated from the number of bright main sequence stars. To compute the recent SFR the mean specific frequency measurements of blue stars with between 20 and 22.5 in Figure 14 are used; while there is some radial variation in the mean specific frequency of these objects in the central few kpc, these are minor for the purposes of the computation of a global SFR. The Z = 0.008 models from Girardi et al. (2002) indicate that main sequence stars with masses between 19 () and 50 () M⊙ are sampled in this brightness interval. If it is assumed that all the stars in this brightness interval are evolving on the main sequence, then there are 5460 main sequence stars in NGC 2403 within this mass range. The Kroupa, Tout, & Gilmore (1993) mass function predicts that stars in this mass range account for 2.5% of all stars that form. A SFR during the past Myr of M⊙ year-1 then results.
How does the SFR computed from main sequence stars compare with that calculated from other indicators? The SFR computed from the far-infrared (FIR) flux measured by Condon et al. (1996) is 0.13 M⊙ year-1 using the Condon (1992) calibration. Dale et al. (2005) show that the ratio of 70m and 160m fluxes are correlated with SFR in galaxies. Combining the calibration in their Figure 15 with the fluxes given in their Table 1 predicts a mean star-forming density of M⊙ year-1 kpc-2 in NGC 2403, depending on the calibrating galaxy. With an effective aperture radius of 5.8 kpc (Garrett et al. 2003), then the predicted SFR in the disk of NGC 2403 based on 70 and 160m fluxes is M⊙ year-1, which agrees with that obtained above from main sequence star counts.
Davidge (2006a) probed the stellar content of NGC 247 with MegaCam. A direct comparison between the stellar contents of NGC 247 and NGC 2403 is of interest as these galaxies have similar morphologies and distances. In fact, the radial photometric properties of RSGs in NGC 247 and NGC 2403 show broad similarities. The dispersion in colors of bright RSGs suggests that stars with metallicities as high as solar are present in the central 6 kpc of NGC 2403, while at larger radii the RSGs have Z = 0.008. A similar trend is seen in the CMDs of NGC 247 in Figure 2 of Davidge (2006a). It thus appears that stars that formed recently near the centers of both galaxies did so from gas that had a range in chemical abundances, with the most chemically enriched material having a metallicity that was almost twice that at larger radii. Both of these results are consistent with the properties of HII regions in NGC 2403 (Garnett et al. 1997).
The specific frequencies of stars in NGC 247 and NGC 2403 can be used to compare the recent star-forming histories of these galaxies in a differential manner. Main sequence stars BSGs and RSGs in the radial intervals 2 – 6 kpc were identified in NGC 247 using the criteria defined in §4.2, and in Figure 17 the specific frequencies of these objects are compared with those in the corresponding portion of NGC 2403. Lacking band photometry for NGC 247, the specific frequencies were computed using band surface brightness measurements from Jarrett et al. (2003). The NGC 247 data have been shifted in brightness to match the distance modulus of NGC 2403, assuming a distance modulus of 27.9 for NGC 247, as computed from RGB-tip stars by Davidge (2006a). The impact on the NGC 247 data of adopting a distance modulus that is 0.5 magnitudes lower (i.e. ) is indicated by the arrow in each panel.
It can be seen from Figure 17 that the specific frequencies of blue and red stars in NGC 247 are systematically lower than those in NGC 2403. The difference is largest among the blue stars, where the density of objects per unit band brightness is dex lower in NGC 247 than in NGC 2403. The differences between the two galaxies are smaller when RSGs are considered, falling in the range dex in the lower panel of Figure 17. That the specific frequencies of RSGs are in better agreement than that of massive main sequence stars suggests that any difference between the SFRs of NGC 247 and NGC 2403 was smaller a few tens of millions of years in the past.
The comparisons in Figure 17 indicate that the density of young stars per unit stellar disk mass is higher in NGC 2403 than in NGC 247, and this is consistent with a higher recent SFR per unit stellar disk mass in NGC 2403. Such a result is consistent with the relative total FIR fluxes of these galaxies, which is an indicator of the recent SFR. Rice et al. (1988) give total FIR fluxes for both galaxies computed from IRAS observations. After correcting the NGC 247 flux to the distance of NGC 2403 and then scaling the NGC 247 flux upwards by 0.8 magnitudes to account for the difference in MK between the two galaxies, then the FIR flux in NGC 247 is roughly half that in NGC 2403, suggesting that the density of young stars should differ by dex. This is comparable to the difference between the NGC 247 and NGC 2403 curves in Figure 17.
6.2 An Extended Outer Disk in NGC 2403
A robust result of this study is that bright main sequence stars are traced out to R kpc in the plane of the disk of NGC 2403. The scale length of the NGC 2403 disk is kpc (Kent 1987), and so the young stellar disk extends out to at least scale lengths. This is consistent with other recent studies that have found that the stellar disks in nearby Sc galaxies typically extend out to 6 or more scale lengths. For example, Bland-Hawthorn et al. (2005) trace disk stars out to 14 kpc, or 10 scale lengths, in the Sc galaxy NGC 300, while Davidge (2003) and Tiede, Sarajedini, & Barker (2004) argue that the disk of M33 extends to at least R kpc, which corresponds to a distance in excess of 6 scale lengths. Davidge (2006a) trace main sequence stars in NGC 247 out to 18 kpc, or scale lengths. The brightest stars in the outer disk of NGC 247 and NGC 2403 have ages that are considerably less than the disk crossing time, suggesting that they formed in situ, and did not migrate into these regions. Signs of disk truncation are not seen in any of these studies, and so the disk sizes obtained from these data are lower limits.
Clues into the origin of the material from which the stars in the outer disk of NGC 2403 formed can be gleaned from studies of the stellar content. If the stars in the outer disk of NGC 2403 formed from gas that was accreted during early epochs, as might be expected from the Bullock & Johnson (2005) simulations, then it is likely that there would be a large population of old stars in the outer disk, which formed during episodes of star formation that span the time since the material was accreted. For comparison, if material that has only recently been accreted has an angular momentum that is higher than that of other material in the disk then there should not be an underlying substrate of very old stars in the outermost regions of the disk. Estimates of the mean age in the outer disk might then provide insight into the epoch of gas accretion.
The outer regions of NGC 247 and NGC 2403 have different relative ages when compared with the main body of their disks. Whereas bright main sequence stars with ages Myr are found in the outermost regions of the disk of NGC 2403, the youngest stars in the outermost portions of the NGC 247 disk have ages Myr (Davidge 2006b). In addition, the specific frequency of main sequence stars changes with radius in NGC 247, in the sense that main sequence stars contribute a higher fraction of the light in the outer disk than the inner disk (Davidge 2006b). Such a trend suggests that the outer disk has a younger photometrically-weighted age than the inner disk, as would be expected if the disk has grown from the inside out. For comparison, the specific frequency of main sequence stars in the outer disk of NGC 2403 appears to be lower than at intermediate radii, although the specific frequency measurements of RSGs suggests that this is likely a short-lived ( Myr) phenomenon, and that the photometrically weighted age does not change with radius. A potential source of uncertainty in the NGC 2403 specific frequency measurements is that they rely on the band photometry that was ‘extended by hand’ by Kent (1987) to large radii. This being said, a highly fortuitous error is required to produce specific frequency measurements that do not change with radius in the RSG data.
The chemical content of stars in the outer disk provides further insight into the origin of the material from which they formed. The narrow RSG plume in the CMD of NGC 2403 between R 6 and 12 kpc suggests that these stars formed from material that had a metallicity that was spatially uniform over distances of many kpc. Abadi et al. (2003) argue that disks are assembled in large part from disrupted satellites, which presumably have diverse chemical enrichment histories. Indeed, in their investigation of the extended disk of M31, Ibata et al. (2005) argue that chemical homogeneity such as that seen among RSGs in NGC 2403 is not consistent with the outer disk originating from the accretion of numerous structures that experienced independent chemical enrichment paths prior to accretion, although Yoachim & Dalcanton (2006) argue that such homogeneity might be expected if the majority of stars tend to come selectively from the largest satellites. Both arguments apply only to dry mergers, or to very recent gas-rich mergers. Indeed, if any structures accreted by NGC 2403 are gas dominated and were assimilated at an epoch that is much older than the crossing time of the disk, then the current generation of stars could form from chemically homogeneous material, as there will then be ample time for the gas to mix.
6.3 AGB Stars in the Extraplanar Regions of NGC 2403
The WIRCam data have been used to investigate the stellar content on the minor axis of NGC 2403 at a point where disk contamination is negigible, and a modest population of sources that are likely AGB stars is found. With a peak brightness M, isochrones suggest that these stars may belong to a population with an age of a few Gyr. However, there are uncertainties in this age estimate. AGB stars are highly evolved, and there are uncertainties in the physics used to create the models that form the basis for the age estimate. In addition, a core assumption is that the stars are metal-poor. This assumption seems secure, as Davidge (2003) found that RGB stars at the location of the NE field have [Fe/H] .
Another source of uncertainty in the age estimate is that a large fraction of AGB stars are photometric variables, and these variations smear the true AGB-tip brightness. Observations of LPVs in the Galaxy (e.g. Glass et al. 1995) and nearby galaxies (e.g. Davidge & Rigaut 2004) indicate that the amplitude of the photometric variations in are typically magnitudes. While variability will introduce systematic errors in age estimates, it may be possible to account for this using multi-epoch observations of the same field. Even then, when observing objects near the faint limit of a data set there is a bias to detect only those variables that are near the peak of their light curves, and this causes the AGB-tip brightness to be systematically overestimated and the age underestimated.
NGC 2403 is not unique among late-type disk galaxies in containing a population of intrinsically bright extraplanar AGB stars. Davidge (2006a) found a population of luminous AGB stars at a projected distance of 12 kpc above the disk of NGC 247. The peak brightness of these stars is consistent with an age Gyr, although this age estimate is prone to the same uncertainties discussed previously.
Seth et al. (2005) find an extraplanar component in edge-on disk systems that is moderately metal-poor and spans a range of ages, with the youngest stars closest to the disk and the oldest stars furthest from the disk. These stars likely belong to the thick disk. Seth et al. (2005) argue that at least some of these stars may have formed in the thin disk, but were scattered out of the disk plane by dynamical interactions. Yoachim & Dalcanton (2006) argue that the bulk of the stars were probably formed in pregalactic fragments, that were shredded during the early stages of disk formation. The bright AGB stars found in NGC 2403 and NGC 247 are located much further off of the disk plane than expected for thick disk stars; for example, in the Milky-Way the thick disk has a scale height of kpc (e.g. Gilmore, Wyse, & Kuijken 1989).
Mouhcine et al. (2005) probed the extraplanar regions of nearby spiral galaxies; NGC 2403 was not in their sample. They targeted fields on or near the minor axis, and sample extraplanar distances similar to those probed in NGC 2403 with WIRCam. One conclusion from the Mouhcine et al. (2005) study is that there is no evidence for an intermediate age population in their CMDs. However, the CMDs of NGC 253, NGC 3031, NGC 4258, and NGC 4945 shown in their Figures 2 and 3 have a substantial spray of stars that extend well above the RGB-tip in ; in the case of the last two galaxies the AGB appears to extend a magnitude or more above the RGB-tip. The presence of an extended AGB above the RGB-tip is not an ironclad signature of an intermediate age population, especially in systems that are metal-rich. Still, the colors of RGB stars in these systems suggest that [Fe/H] , and the models of Girardi et al. (2002) suggest that at least some of the galaxies in the Mouchine et al. (2005) sample may harbor an extraplanar component with an age Gyr.
We close this part of the discussion by noting that NGC 247 is in the sample of galaxies observed by Mouhcine et al. (2005), and their CMD of this galaxy shows no stars above the RGB-tip. While this is at odds with the conclusions reached by Davidge (2006a), Mouhcine et al. (2005) adopted a distance modulus that is 0.6 magnitudes lower than that measured from the RGB-tip by Davidge (2006a). If the RGB-tip distance modulus of Davidge (2006a) is adopted for NGC 247 then a population of AGB stars above the RGB-tip is present in the Mouchine et al. CMD.
| Name | r (pc) | ||||
|---|---|---|---|---|---|
| F1 | 16.78 | 0.64 | – | – | 5.0 |
| F14 | 17.90 | 1.51 | 5.44 | 6.34 | 4.0 |
| F16 | 16.44 | 0.63 | 2.54 | 2.89 | 2.7 |
| F19 | 17.94 | 1.80 | 4.61 | 5.36 | 8.6 |
| F46 | 18.82 | 0.42 | 2.01 | 2.27 | 10.4 |
| RA | Dec | r (pc) | ||
|---|---|---|---|---|
| 07:38:16.8 | 65:42:40.5 | 17.94 | 0.90 | 4.5 |
| 07:37:27.0 | 65:28:20.5 | 15.98 | 0.26 | 1.8 |
| 07:37:21.5 | 65:28:16.6 | 15.84 | 0.63 | 1.4 |
| 07:36:17.3 | 65:29:00.5 | 17.95 | 0.99 | 14.0 |
| 07:36:04.4 | 65:34:00.3 | 15.79 | 0.67 | 3.6 |
| 07:35:05.9 | 65:45:27.5 | 16.70 | 0.66 | 3.6 |
References
- (1)
- (2) Abadi, M. G., Navarro, J. F., Steinmetz, M., & Eke, V. R. 2003, ApJ, 597, 21
- (3)
- (4) Barmby, P., Huchra, J. P., & Brodie, J. P. 2001, AJ, 121, 1482
- (5)
- (6) Barmby, P., Huchra, J. P., Brodie, J. P., Forbes, D. A., Schroder, L., & Grillmair, C. J. 2000, AJ, 119, 727
- (7)
- (8) Battistini, P., Bonoli, F., Federici, L., Fusi Pecci, F., & Kron, R. G. 1984, A&A, 130, 162
- (9)
- (10) Bell, E. F., & de Jong, R. S. 2000, MNRAS, 312, 497
- (11)
- (12) Bellazzini, M., Cacciari, C., Federici, L., Fusi Pecci, F., Rich, M. 2003, A&A, 405, 867
- (13)
- (14) Bensby, T., Feltzing, S., Lundstrom, I., & Ilyin, I. 2005, A&A, 433, 185
- (15)
- (16) Bessell, M. S., & Brett, J. M. 1988, PASP, 100, 1134
- (17)
- (18) Bland-Hawthorn, J., Vlajic, M., Freeman, K. C., & Draine, B. T. 2005, ApJ, 629, 239
- (19)
- (20) Boulade, O. et al. 2003, SPIE, 4841, 72
- (21)
- (22) Brown, T. M., Ferguson, H. C., Smith, E., Kimble, R. A., Sweigart, A. V., Renzini, A., Rich, R. M., & VandenBerg, D. A. 2003, ApJ, 592, L17
- (23)
- (24) Bullock, J. S., & Johnson, K. V. 2005, ApJ, 635, 931
- (25)
- (26) Christian, C. A., & Schommer, R. A. 1982, ApJS, 49, 405
- (27)
- (28) Cohen, J. G., Matthews, K., & Cameron, P. B. 2005, ApJ, 634, L45
- (29)
- (30) Condon, J. J. 1992, ARA&A, 30, 575
- (31)
- (32) Condon, J. J., Helou, G., Sanders, D. B., & Soifer, B. T. 1996, ApJS, 103, 81
- (33)
- (34) Cowie, L. L., Songaila, A., Hu, E. M., & Cohen, J. G. 1996, AJ, 112, 839
- (35)
- (36) Cutri, R. M. et al. 2003, 2MASS All-Sky Catalogue of Point Sources (Amherst: University of Massachusetts Press).
- (37)
- (38) Dalcanton, J. J., & Bernstein, R. A. 2002, AJ, 124, 1328
- (39)
- (40) Dale, D. A. et al. 2005, ApJ, 633, 857
- (41)
- (42) Davidge, T. J. 2001, AJ, 121, 3100
- (43)
- (44) Davidge, T. J. 2003, AJ, 125, 3046
- (45)
- (46) Davidge, T. J. 2005, ApJ, 622, 279
- (47)
- (48) Davidge, T. J. 2006a, ApJ, 641, 822
- (49)
- (50) Davidge, T. J. 2006b, PASP, 118, 1626
- (51)
- (52) Davidge, T. J., & Courteau, S. 2002, AJ, 123, 1438
- (53)
- (54) Davidge, T. J., & Rigaut, F. 2004, ApJ, 607, L25
- (55)
- (56) de Grijs, R., Kregel, M., & Wesson, K. H. 2001, MNRAS, 324, 1074
- (57)
- (58) Ellis, S. C., & Bland-Hawthorn, J. 2006, astro-ph/0602573
- (59)
- (60) Erwin, P., Beckman, J. E., & Pohlen, M. 2005, ApJ, 626, L81
- (61)
- (62) Fan, X. 1999, AJ, 117, 2528
- (63)
- (64) Ferraro, F. R., Montegriffo, P., Origlia, L., & Fusi pecci, F. 2000, AJ, 119, 1281
- (65)
- (66) Freedman, W. L., & Madore, B. F. 1988, ApJ, 332, L63
- (67)
- (68) Fukugita, M., Ichikawa, T., Gunn, J. E., Doi, M., Shimasaku, K., & Schneider, D. P. 1996, AJ, 111, 1748
- (69)
- (70) Garnett, D. R., Shields, G. A., Skillman, E. D., Sagan, S. P., & Dufour, R. 1997, ApJ, 489, 63
- (71)
- (72) Gilmore, G., Wyse, R. F. G., & Kuijken, K. 1989, ARA&A, 27, 555
- (73)
- (74) Girardi, L., Bertelli, G., Bressan, A., Chiosi, C., Groenewegen, M. A. T., Marigo, P., Salasnich, B., & Weiss, A. 2002, A&A, 391, 195
- (75)
- (76) Girardi, L., Grebel, E. K., Odenkirchen, M., & Chiosi, C. 2004, A&A, 422, 205
- (77)
- (78) Glass, I. S., Whitelock, P. A., Catchpole, R. M., & Feast, M. W. 1995, MNRAS, 273, 383
- (79)
- (80) Hammer, F., Flores, H., Elbaz, D., Zheng, X. Z., Liang, Y. C., & Cesarsky, C. 2005, A&A, 430, 115
- (81)
- (82) Harris, W. E., & van den Bergh, S. 1981, AJ, 86, 1627
- (83)
- (84) Hawarden, T. G., Leggett, S. K., Letawsky, M. B., Ballantyne, D. R., & Casali, M. M. 2001, MNRAS, 325, 563
- (85)
- (86) Humphreys, R. M., & McElroy, D. B. 1984, ApJ, 284, 565
- (87)
- (88) Ibata, R., Chapman, S., Ferguson, A. M. N., Lewis, G., Irwin, M., & Tanvir, N. 2005, ApJ, 634, 287
- (89)
- (90) Jarrett, T. H., Chester, T., Cutri, R., Schneider, S., & Huchra, J. P. 2003, AJ, 125, 525
- (91)
- (92) Karachentsev et al. 2002, A&A, 383, 125
- (93)
- (94) Kent, S. M. 1987, AJ, 93, 816
- (95)
- (96) Kroupa, P., Tout, C. A., & Gilmore, G. 1993, MNRAS, 262, 545
- (97)
- (98) Labbe et al. 2003, ApJ, 591, L95
- (99)
- (100) Landolt, A. U. 1992, AJ, 104, 340
- (101)
- (102) Lilly, S. et al. 1998, ApJ, 500, 75
- (103)
- (104) Mackey, A. D., & van den Bergh, S. 2005, MNRAS, 360, 631
- (105)
- (106) Mannucci, F., Basile, F., Poggianti, B. M., Cimatti, A., Daddi, E., Pozzetti, L., & Vanzi, L. 2001, MNRAS, 326, 745
- (107)
- (108) Maraston, C. 1998, MNRAS, 300, 872
- (109)
- (110) Marleau, F. R., & Simard, L. 1998, ApJ, 507, 585
- (111)
- (112) McCracken, H. J., Metcalfe, N., Shanks, T., Campos, A., Gardner, J. P., & Fong, R. 2000, MNRAS, 311, 707
- (113)
- (114) Mouhcine, M., Rich, R. M., Ferguson, H. C., Brown, T. M., & Smith, T. E. 2005, ApJ, 633, 828
- (115)
- (116) Narayan, C. A., & Jog, C. J. 2003, A&A, 407, L59
- (117)
- (118) Pierce, M. J., & Tully, R. B. 1992, ApJ, 387, 47
- (119)
- (120) Puget, P. et al. 2004, SPIE, 5492, 978
- (121)
- (122) Rice, W., Lonsdale, C. J., Soifer, B. T., Neugebauer, G., Kopan, E. L., Lloyd, L. A., de Jong, T., & Habing, H. J. 1988, ApJS, 68, 91
- (123)
- (124) Rigaut, F. et al. 1998, PASP, 110, 152
- (125)
- (126) Robertson, B., Bullock, J. S., Cox, T. J., Di Matteo, T., Hernquist, L., Springel, V., & Yoshida, N. 2006, ApJ, 645, 986
- (127)
- (128) Sarajedini, A., Geisler, D., Harding, P., & Schommer, R. 1998, ApJ, 508, L37
- (129)
- (130) Schlegel, D. J., Finkbeiner, D. P., & Davis, M. 1998, ApJ, 500, 525
- (131)
- (132) Seth, A. C., Dalcanton, J. J., & de Jong, R. S. 2005, AJ, 130, 1574
- (133)
- (134) Stetson, P. B. 1987, PASP, 99, 191
- (135)
- (136) Stetson, P. B., & Harris, W. E. 1988, AJ, 96, 909
- (137)
- (138) Thuan, T. X., & Izotov, Y. I. 2005, ApJ, 627, 739
- (139)
- (140) Tiede, G. P., Sarajedini, A., & Barker, M. K. 2004, AJ, 128, 224
- (141)
- (142) Trujillo, I., & Aguerri, J. A. L. 2004, MNRAS, 355, 82
- (143)
- (144) Trujillo, I., & Pohlen, M. 2005, ApJ, 630, L17
- (145)
- (146) Tully, R. B., & Fouqué, P. 1985, ApJS, 58, 67
- (147)
- (148) van der Kruit, P. C., & Searle, L. 1981, A&A, 95, 105
- (149)
- (150) Volker, S., & Hernquist, L. 2005, ApJ, 622, L9
- (151)
- (152) Yoachim, P., & Dalcanton, J. J. 2006, AJ, 131, 226
- (153)
- (154) Zentner, A. R., & Bullock, J. S. 2003, ApJ, 598, 49
- (155)