The AGN nature of 11 out of 12 Swift/RXTE unidentified sources through optical and X-ray spectroscopy
Abstract
The Swift Burst Alert Telescope (BAT) is performing a high Galactic latitude survey in the 14–195 keV band at a flux limit of erg cm-2 s-1, leading to the discovery of new high energy sources, most of which have not so far been properly classified. A similar work has also been performed with the RXTE slew survey leading to the discovery of 68 sources detected above 8 keV, many of which are still unclassified. Follow-up observations with the Swift X-ray Telescope (XRT) provide, for many of these objects, source localization with a positional accuracy of few arcsec, thus allowing the search for optical counterparts to be more efficient and reliable. We present the results of optical/X-ray follow-up studies of 11 Swift BAT detections and one AGN detected in the RXTE Slew Survey, aimed at identifying their longer-wavelength counterparts and at assessing their nature. These data allowed, for the first time, the optical classification of 8 objects and a distance determination for 3 of them. For another object, a more refined optical classification than that available in the literature is also provided. For the remaining sources, optical spectroscopy provides a characterization of the source near in time to the X-ray measurement. The sample consists of 6 Seyfert 2 galaxies, 5 Seyferts of intermediate type 1.2–1.8, and one object of Galactic nature - an Intermediate Polar (i.e., magnetic) Cataclysmic Variable. Out of the 11 AGNs, 8 (70) including 2 Seyferts of type 1.2 and 1.5, are absorbed with cm-2. Up to 3 objects could be Compton thick (i.e. cm-2), but only in one case (Swift J0609.1–8636) does all the observational evidence strongly suggests this possibility. The present data demonstrate the capability of coordinated hard X-ray and optical observations to discover absorbed AGNs.
1 Introduction
Recently, significant progress has been made in surveying the extragalactic sky at photon energies above 10 keV. Observations at these energies are efficient for finding absorbed AGNs, as they probe heavily obscured regions/objects, i.e. those that could be missed in optical, UV and even soft X-ray surveys.
Quantifying the fraction of nearby absorbed AGNs, particularly those that have cm-2 (i.e. the ones in Compton thick regime), is necessary if one wants to understand the accretion history of the Universe and study a population of objects poorly explored so far. Furthermore, the distribution of column densities is a key parameter for estimating the contribution of AGNs to the X-ray cosmic diffuse background and for testing current unified theories. A number of surveys performed above 10 keV are now available and can be used to study absorption in AGNs.
The recent RXTE survey made in the 8–20 keV energy band using slew observations (Revnivtsev et al. 2004; Sazonov & Revnivtsev 2004) resulted in a list of 68 objects (above 3 level) down to a flux limit of about erg cm-2 s-1; 14 of these detections are still unidentified and so lack optical classification, which is the first step in any survey work (but see Bikmaev et al. 2006). Furthermore, no information on the X-ray spectral shape of the less known objects is available.
An even greater step forward has been provided by the Swift BAT survey, which is sensitive in the 15–195 keV band above a flux of erg cm-2 s-1 (Markwardt et al. 2005). Although primarily devoted to the study of Gamma-Ray Bursts, Swift observes the sky in survey mode when it is not responding to these events; with a large field of view of 2 sr, galactic and extragalactic X-/-ray sources can thus be serendipitously detected. Preliminary results from the first three months of observations provided a first sample of 66 objects: 12 were Galactic sources and 45 extragalactic objects (44 AGNs and the Coma cluster); the 9 remaining sources were not optically classified. After this initial work, a number of new detections have also been reported (Tueller et al. 2005; Kennea et al. 2005; Ajello et al. 2006a) and often the proposed counterpart is not optically classified or characterized in X-rays below 10 keV.
In parallel with our ongoing program of optical classification of INTEGRAL IBIS sources (Masetti et al. 2004, 2006a,b,c,d), we have included in our activities follow-up work on unclassified objects detected with Swift and RXTE. Here, we report on optical/X-ray follow-up observations of a sample of 11 Swift BAT detections (Tueller et al. 2005; Kennea et al. 2005; Ajello et al. 2006a,b; Grupe et al. 2006) plus of an AGN detected in the RXTE Slew Survey (Revnivtsev et al. 2006). Our optical spectroscopy allows for the first time the classification of 8 objects and a distance estimate for 3 of them; for another object a more refined optical classification than that available in the literature is also provided. Despite having already been classified in the literature, 3 more objects were re-observed in order to have information on their optical status closer in time to the X-ray measurements. Although for most, but not all, objects in the sample, X-ray spectroscopy was published in the form of Atels, we have repeated the analysis here in order to include more observations and to provide a more uniform data set. In some cases we find significant differences between the published results and our own analyses. In the case of Swift J0918.5+1618 we also retrieved and analyzed an archival ASCA observation in order to have more detailed information on the source X-ray spectrum and to solve the issues related to the possible Compton thick nature of this type 1 Seyfert (Ajello et al. 2006a).
The optical results presented in this paper and concerning the Swift sources supersede the preliminary and concise ones presented in the Atels by Masetti et al. (2006e) and Morelli et al. (2006).
2 X-ray observations and data analysis
In this Section we present X-ray observations acquired with the XRT (X-ray Telescope, 0.2–10 keV) on board the Swift satellite (Gehrels et al. 2004).
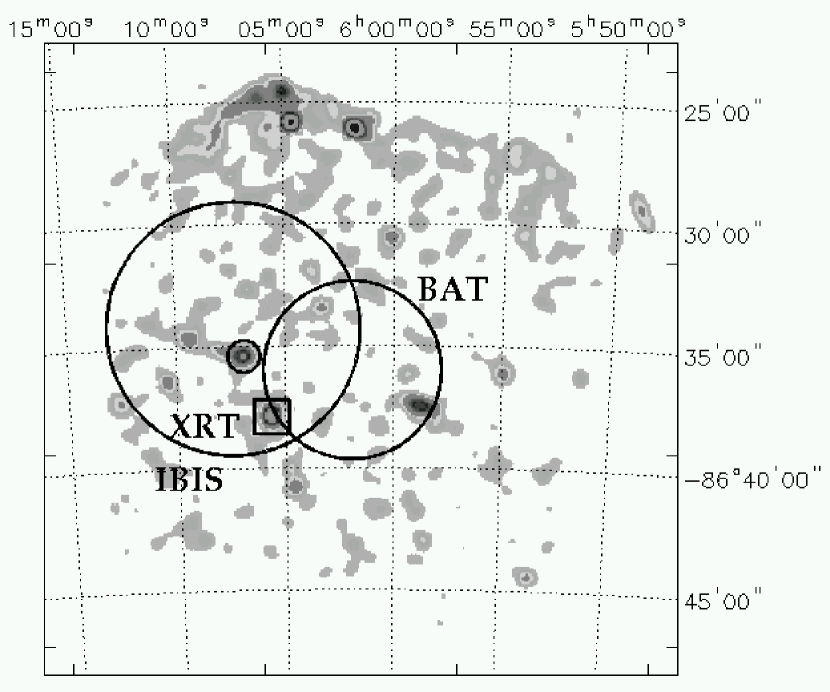
XRT data reduction was performed using the XRTDAS v. 1.8.0 standard data pipeline package (xrtpipeline v. 0.10.3), in order to produce screened event files. All data were extracted only in the Photon Counting (PC) mode (Hill et al. 2004), adopting the standard grade filtering (0–12 for PC) according to the XRT nomenclature. The log of all X-ray observations is given in Table LABEL:Tab1. For each measurement, we report the position of the XRT source associated with the high energy emitting object seen with Swift BAT or with RXTE PCA, its uncertainty at a 90% confidence level, the XRT observation date, the relative exposure time, the energy band adopted in the source spectral fitting (which may vary depending on the statistical quality of each exposure), and the corresponding source count rate. Images have been extracted in the 0.3–10 keV energy band and searched for significant excesses associated with the Swift BAT or RXTE PCA sources. In all cases, a single bright X-ray source was detected inside the BAT positional uncertainty; for the RXTE source, the bright object detected with XRT coincides with the proposed ROSAT counterpart (Revnivtsev et al. 2006). The only exception, Swift J0601.9–8636, was away from the BAT detection (Kennea et al. 2006), i.e. just marginally consistent with the BAT position. This source has recently been detected also by INTEGRAL IBIS and localized with a uncertainty by this instrument (Bird et al. 2007); the intersection of Swift BAT and INTEGRAL IBIS error boxes clearly indicates that only LEDA 18394 (also ESO 005–G004, box in Figure 1) is the counterpart of this high energy emitting object. The other possible counterpart (smaller circle in Figure 1) can be excluded as optical spectroscopy acquired with the same setup at the 1.5m CTIO telescope on February 19, 2007, shows that it is a star, likely of spectral type A, without any peculiar spectral characteristics, i.e. it is unlikely to emit X-rays above 10 keV.
Events for spectral and temporal analysis were extracted within a circular region of radius 20′′, centered on the source position, which encloses about 90% of the PSF at 1.5 keV (see Moretti et al. 2004). The background was taken from various source-free regions close to the X-ray source of interest, using both circular/annular regions with different radii in order to ensure an evenly sampled background. In all cases, the spectra were extracted from the corresponding event files using the XSELECT software and binned using grppha in an appropriate way, so that the statistic could be applied. We used the latest version (v.008) of the response matrices and create individual ancillary response files (ARF) using xrtmkarf. Spectral analyses have been performed using XSPEC version 12.2.1, while for temporal analyses we adopted the XRONOS package (version 5.21).
Each individual observation was inspected in order to assess the presence of short-term variability. In only three cases did we find significant short-term changes (Swift J0444.1+2813, Swift J0732.5–1331 and Swift J1200.8+0650 with a rms variability of 20–40%, 10–30% and 20%, respectively), but the low statistical quality of the data prevented any spectral analysis within segments of these observations.
For sources with more than one pointing 111In a few cases some observations have not been considered because their poor statistics did not allow us to perform a reliable spectral analysis., we first analysed individual spectra to search for variability, and then combined the data to improve the statistics.
In just a few cases (Swift J0918.5+1618, Swift J1009.3–4250 and Swift J1038.8–4942), we found significant changes in flux, but not in spectral shape, between different observing periods. To allow for these flux variations, fits to the combined data were performed with the power law normalization free to vary.
Due to the limited spectral signal often available, we first employed a simple model of a power law absorbed by both a Galactic (Dickey & Lockman 1990) and an intrinsic column density (our baseline). If this baseline model was not sufficient to fit the data, we then introduced extra spectral components as required.
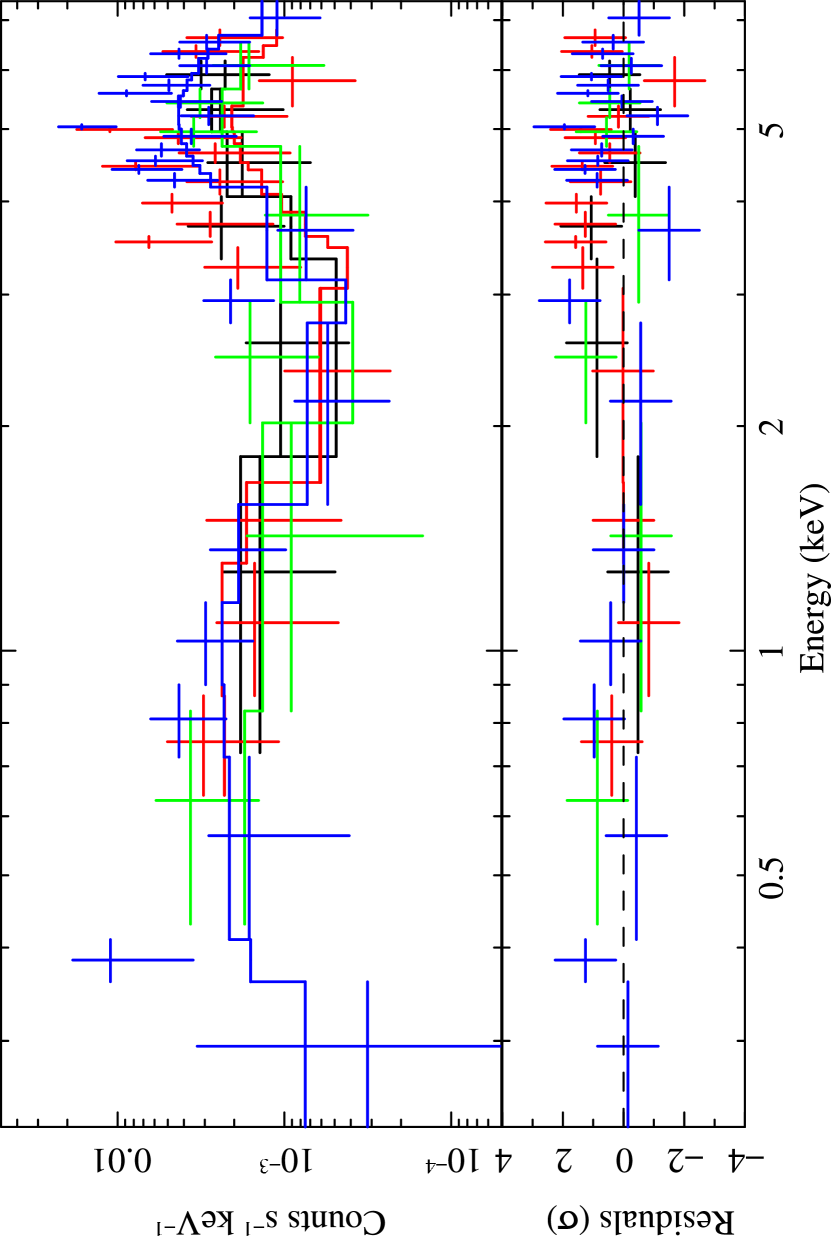
The results of the analysis of both single and combined observations are reported in Table 2 and Table 3 respectively, where we list: the Galactic absorption according to Dickey & Lockman (1990); the column density in excess to the Galactic value; the photon index; the 2–10 keV flux; the reduced of the best-fit model and the column density measured by fixing the spectral photon index to a canonical value for an AGN (). We also list in Table 3 the parameters relevant to any extra spectral features (e.g. soft excess component and iron line) required by the data in a few sources. In particular, we have added: an unabsorbed power law component having the same photon index of the primary continuum in 3 type 2 AGNs (Swift J0444.1+2813, Swift J1009.3–4250 and Swift J1930.5+3414); a thermal component in the only galactic source in the sample (Swift J0732.5–1331); and an iron line in two AGN (Swift J1238.9–2720 and XSS J12303–4232). The extra power law could be interpreted as scattered emission, which is a spectral component often found in type 2 Seyferts (Risaliti 2002). All quoted errors correspond to a 90 confidence level for a single parameter of interest ().
In one case (Swift J0918.5+1618), we also used archival
ASCA GIS (Gas Imaging Spectrometers, Ohashi et al. 1996) data to better
characterize the source spectrum. The relevant spectra and associated files were downloaded from
the TARTARUS database222available at
http://tartarus.gsfc.nasa.gov/ and analyzed with
the same XSPEC version used for the XRT data. For this particular case, the best-fit results are
presented in Table 4.
Figures 2 to 12 show, for those AGN in the sample with high signal-to-noise ratio, the results of this spectral analysis, which are discussed in more details in the subsections devoted to each individual object. The X-ray spectra of the only galactic source in the sample (Swift J0732.5–1331) are presented and discussed in the Appendix.
3 Optical observations and data analysis
Sources with Dec 20∘ were observed spectroscopically at the Bologna Astronomical Observatory in Loiano (Italy) with the 1.5-metre telescope “G.D. Cassini” equipped with the BFOSC instrument, which uses a 13001340 pixel EEV CCD. In all observations, Grism #4 and a slit width of were used, providing a 3500–8700 Å nominal spectral coverage. The use of this setup secured a final dispersion of 4.0 Å/pix for all these spectra. Spectroscopic observations of the remaining southern sources were secured with the 1.5-metre CTIO telescope of Cerro Tololo (Chile) equipped with the R-C spectrograph, which carries a 1274280 pixel Loral CCD. Data were acquired using Grating #13/I and with a slit width of 15, giving a nominal spectral coverage between 3300 and 10500 Å and a dispersion of 5.7 Å/pix. In one case (Swift J1009.3–4250 = ESO 263–13) we retrieved an archival optical spectrum, with dispersion 1.6 Å/pix, acquired with the 4-metre Anglo-Australian Telescope (AAT) within the 6dF Galaxy Survey (Jones et al. 2004); we refer the reader to this latter paper for observational details. The complete log of the observations is reported in Table 5.
After cosmic-ray rejection, the Loiano and CTIO spectra were reduced, background subtracted and optimally extracted (Horne 1986) using IRAF333IRAF is the Image Reduction and Analysis Facility made available to the astronomical community by the National Optical Astronomy Observatories, which are operated by AURA, Inc., under contract with the U.S. National Science Foundation. It is available at http://iraf.noao.edu/. Wavelength calibration was performed using He-Ar lamps acquired soon after each spectroscopic exposure; the Loiano spectra were then flux-calibrated using the spectrophotometric standard BD+25∘3941 (Stone 1977), whereas the CTIO spectra used the standard star LTT 7379 (Hamuy et al. 1992, 1994). Finally, and when applicable, different spectra of the same object were stacked together to increase the S/N ratio. The wavelength calibration uncertainty was 0.5 Å for all cases; this was checked using the positions of background night sky lines. Instrumental broadening of spectral features is (in terms of assuming a Gaussian description) 260 km s-1 and 300 km s-1 for the Loiano and CTIO spectra, respectively.
To flux calibrate the optical spectrum of Swift J1009.3–4250 (originally expressed in counts) we considered the and magnitudes of Winkler & Payne (1990), which were acquired on a 30′′ circular region centered on the source, and rescaled them to the 6dF optical fibre aperture (67 in diameter). This was done using the SuperCosmos (Hambly et al. 2001) digitized images and the conversions from the SuperCosmos to the Johnson-Cousins photometry system (Colless 2003). We then used these rescaled magnitudes to convert the spectrum counts into physical units. For the AGN classification, we used the criteria of Veilleux & Osterbrock (1987) and the line ratio diagnostics of Ho et al. (1993, 1997); moreover, for the subclass assignation of Seyfert 1 nuclei, we used the Hβ/[O iii]5007 line flux ratio criterion as in Winkler (1992).
The quoted optical magnitudes are extracted from the USNO-A2.0444available at
http://archive.eso.org/skycat/servers/usnoa/ catalog.
Table 6 reports the emission line fluxes of the most interesting
lines in each spectrum.
The line fluxes and absolute magnitudes from extragalactic sources
presented in this paper were dereddened for Galactic absorption along
their line of sight following the prescription for the computation of the
Galactic color excess (also reported in Table 6)
as in Schlegel et al. (1998) and assuming the Galactic extinction law of
Cardelli et al. (1989). For the intrinsic reddening calculations, we
assumed an intrinsic Hα/Hβ line ratio of 2.86 (Osterbrock
1989). The spectra of the galaxies shown here were not corrected for
starlight contamination (see, e.g., Ho et al. 1993, 1997) given their
limited S/N and resolution. We do not consider this to affect any of our
conclusions. We have also compared, in Table 6, the extinction obtained from the optical
() and X-ray data ().
When this is possible, we find that is generally smaller than ;
for AGN this is not a new result as it was first
noticed by Maccacaro et al. (1982). The cause of this discrepancy is not clear, but
could be due to the optical and X-ray absorption coming from different media/regions
(Weingartner Murray 2002)
or due to a dust to gas ratio or dust grain dimensions different than in our galaxy (Maiolino et al.
2001). Only in one case (Swift J0601.9–8636) do we find that is smaller than
, but this may be due a false estimate of the absorption column density
in the X-ray spectrum (see Section 5.2) and the likely Compton thick nature of this source
(see Section 5.2).
Figures 13 and 14 show the optical spectra of all AGN in the sample, while the optical spectrum of the galactic source Swift J0732.5–1331 is presented in the Appendix.
4 Diagnostic ratios
To further characterize our objects, we have used diagnostic diagrams to confirm the presence of an active nucleus and to discriminate between Compton thin and thick sources. It is in fact possible in some cases that the AGN component is so deeply absorbed that other components, such as a starburst, dominate in the optical spectrum (Masetti et al. 2006c). Since the IR emission is generally associated with star-forming activity while the [O iii] emission is mainly produced by photons generated in the active nucleus, we can employ the / ratio to discriminate between AGN and Starburst galaxies. Indeed, in the Ho et al. (1997) sample of nearby galaxies, 90 of those classified as starbursts have a value of / below 10-4, while 88 of the AGN have ratios above this value (Panessa and Bassani 2002).
Generally, indirect arguments are used to probe the Compton thick versus thin nature of a type 2 AGN, and these include the equivalent width of the iron line, and the ratio of anisotropic (i.e. modified by absorption such as the 2–10 keV emission) versus isotropic (i.e. not modified by absorption) luminosities. The [O iii]5007 ([O iii] hereafter) flux is considered as a good isotropic indicator because it is produced in the Narrow Line Regions, which are not strongly affected by absorption (Maiolino & Rieke 1995; Risaliti et al. 1999; Bassani et al. 1999). The / ratio has been studied in a large sample of Seyfert 2 galaxies; all Compton thin Seyfert (type 1 and 2) show ratios higher than 1, while Compton thick sources show / ratios below this value (Bassani et al. 1999).
Another isotropic indicator is the Far-Infrared (FIR) emission which is probably produced in even more external regions; typically, type 1 and Compton thin type 2 AGNs show / ratios around or above 0.1, while Compton thick type 2 objects show ratios lower than (David et al. 1992; Mulchaey et al. 1994; Risaliti et al. 1999). However, the validity of this diagnostic is less certain because many components besides the nuclear one (for example coming from star-burst activity and from the host galaxy) may contribute to the IR flux. These caveats should be kept in mind when dealing with this particular ratio.
Finally, emission above 20 keV can be used as an isotropic probe too as it is virtually unaffected by absorption as long as logNH is below 24.5; for higher column density even the emission above 20 keV is blocked and can only be seen indirectly. Using a sample of hard X-ray selected AGN, Malizia et al. (2007) found that the / ratio of type 1 AGN is typically around 0.7, decreasing progressively as the absorption increases; Compton thick objects are easily recognized for having negligible absorption and a ratio below 0.02.
In conclusion, these four ratios can provide an independent way to establish which is the dominant component between AGN and Starburst and, at the same time, they are a powerful tool in the detection of Compton thick sources when the X-ray spectral analysis is not sufficient to recognize them. Here, the optical spectra provide information on the [O iii] flux and the X-ray spectroscopy on the X-ray one. Hard X-ray fluxes in the 10–100 keV energy band are instead obtained from available Swift BAT observations (see references in Table 7). When possible, the [O iii] flux of each galaxy has been corrected for extinction assuming the absorption local to the narrow-line region as determined from the Hα/Hβ line ratio555, where (Bassani et al. 1999); the X-ray and hard X-ray fluxes are instead not corrected for absorption. IR fluxes have been estimated from IRAS data extracted from the NASA/IPAC Extragalactic Database666available at http://nedwww.ipac.caltech.edu/ (NED) archive or from the HEASARC archive. For this paper, we adopt the same definition used in Mulchaey et al. (1994) to estimate the IR flux: . The IR fluxes together with the hard X-ray fluxes estimated in this way, as well as the luminosity ratios used in the present study are all listed in Table 7.
Using these ratios, we can conclude that most AGN in the sample are dominated by an active nucleus rather than by starburst activity. Furthermore, they are mostly characterized by being in the Compton thin regime. Three objects could be Compton thick, but only in one case (Swift J0601.9+8336) does all the observational evidence strongly suggests this possibility.
5 Results on individual sources
bf In the following subsections, we present X-ray and optical results of all AGN analyzed in this paper. The only galactic source found is discussed separately in the Appendix. We have assumed a cosmology with = 65 km s-1 Mpc-1, = 0.7 and = 0.3.
5.1 Swift J0444.1+2813
This BAT source is identified with the 2MASS (Two Micron All Sky Survey, Skrutskie et al. 2006) extended object 2MASX J04440903+2813003 (Tueller et al. 2005), associated with an unclassified principal galaxy (PGC 86269 at ; Pantoja et al. 1997). It is listed in the NVSS (National Radio Astronomy Observatory [NRAO] Very Large Array [VLA] Sky Survey Catalog; Condon et al. 1998) with a 20 cm flux of mJy. The object is also an IRAS source and has never been detected at X-ray energies before. A preliminary analysis of the XRT data indicated heavy absorption ( cm-2), but did not provide any information on the source spectral shape (Tueller et al. 2005). The XRT spectra are all well fitted with two power laws having the same photon index but with only one intrinsically absorbed (see Table 3 and Figure 2). The addition of an unabsorbed power law component takes into account excess emission below 2 keV and is required by the data with a significance greater than the 99.73 confidence level in each observation ( 99.99 for the combined spectrum). The primary power law is flat and absorbed by an intrinsic column density of cm-2. The absorption is lower than the preliminary value reported by Tueller et al. (2005).
Optical spectroscopy of the object shows the presence of narrow Hα, [N ii], [S ii], [O i] and [O iii] emission lines, with Full Width at Half Maximum (FWHM) 800 km s-1 (Figure 13, upper left panel), superimposed on a reddened continuum. All features are at redshift , consistent with the 21 cm radio measurement of Pantoja et al. (1997). This corresponds to a luminosity distance = 51.2 Mpc and gives a luminosity of (3.1–3.8) erg s-1 in the 2–10 keV energy band. The narrowness of the lines and their relative strengths indicate that this is a Seyfert 2 galaxy. The 3 upper limit on the Balmer decrement ( 74) implies a dereddened [O iii] flux erg cm-2 s-1. The latter measurement, if compared with the X-ray flux, implies that this source is in the Compton thick regime (see Table 7); however, the and ratios are typical of Compton thin sources and the upper limit ( eV) on the 6.4 keV iron line, which can be obtained from the X-ray data, excludes a Compton thick object; also the short-term variability seen in the XRT data argues against a Compton thick nature.
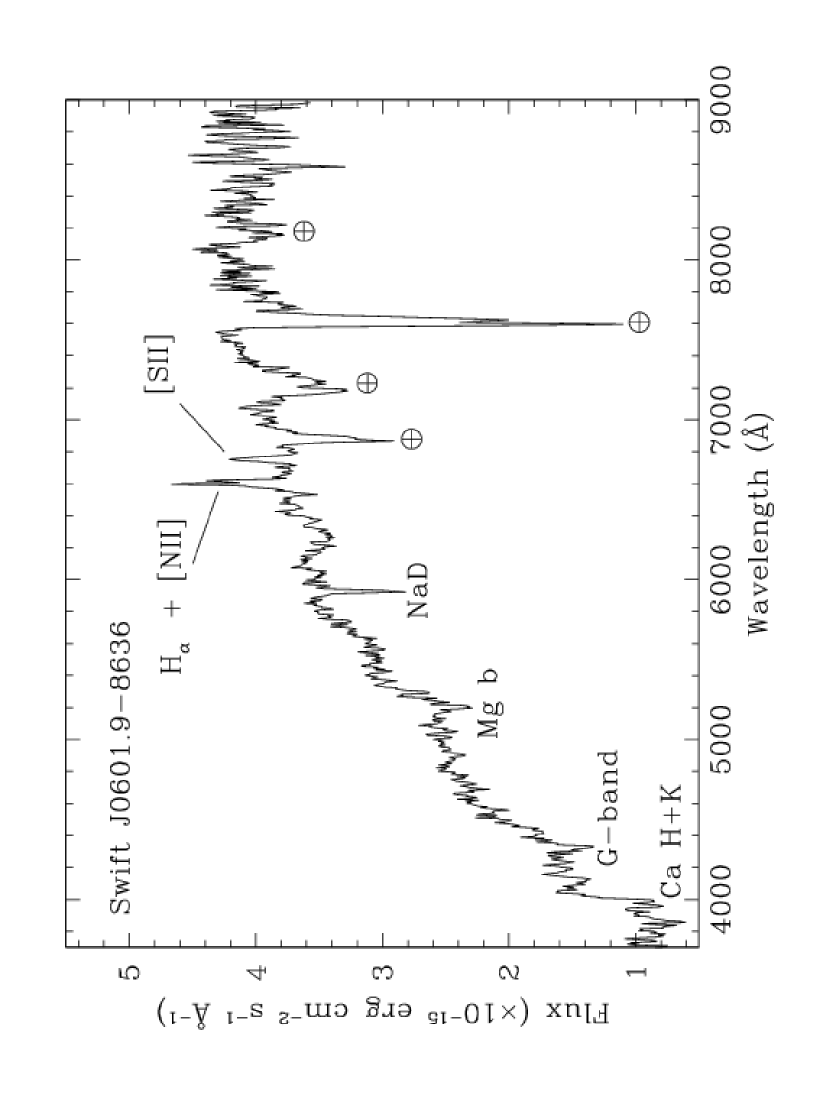
5.2 Swift J0601.9–8636
Despite being a principal galaxy, the optical counterpart of this Swift AGN (LEDA 18394 also ESO 005–G004), is still unclassified in the optical. The source is a radio emitter, being reported in the SUMSS (Sidney University Molonglo Sky Survey; Mauch et al. 2003) catalog with a 36 cm flux of mJy and as a Parkes source with a 4850 MHz flux of mJy; it is fairly bright and extended in the infrared, being listed both in the IRAS bright galaxy sample (Sanders et al. 2003) and in the extended 2MASS catalog. Up to now, no X-ray data have been reported from this object.
If we fit the XRT spectrum with an absorbed power law with , we do not find any evidence for extra absorption in excess of the Galactic value (see Table 2).
From the nucleus of this galaxy, we detect narrow (FWHM 650 km s-1) emission lines of Hα, [N ii] and [S ii] superimposed on a continuum resembling that typical of a spiral galaxy (Figure 13, upper right panel). The Hα/[N ii] flux ratio is consistent with that typical of Seyfert 2 galaxies, although this observable alone cannot be used to discriminate the nature of this source. However, the radio emission and the detection above 20 keV strongly suggest that we are dealing with an active galaxy. We are therefore led to conclude that Swift J0601.9–8636 is probably a hidden Seyfert 2 galaxy. The estimated redshift is , consistent with that measured by Fisher et al. (1995). This redshift corresponds to a luminosity distance = 29.7 Mpc, implying erg s-1. This luminosity is unusually low compared to that above 20 keV ( erg s-1), suggesting again extreme absorption.
The non-detection of Hβ implies a Hα/Hβ flux ratio 3 upper limit of 38.3, which in turn means 8.1 and a hydrogen column cm-2 local to the galaxy nucleus, which is somewhat at odds with the result of the (admittedly with low S/N) X-ray data, unless the source is in the Compton thick regime.
The non-detection of [O iii], together with the lower limit on the reddening local to the source makes the [O iii] flux value (or a limit thereof) unconstrained, and so are the / and / ratios. The observed / and / ratios are instead well constrained and their very small values are compatible with Swift J0601.9–8636 being a Compton thick AGN; although the small / value is also consistent with a starburst-powered galaxy, the optical spectrum provides a Hα/[N ii] ratio compatible with those of type 2 Seyfert galaxy. Indeed, a recent Suzaku observation of this source has confirmed its Compton thick nature (Ueda et al. 2007).
5.3 Swift J0823.4–0457
The XRT position of this BAT source (Ajello et al. 2006a) falls exactly on the galaxy Fairall 272 (also PGC 023515 and MCG–01–22–006), which belongs to a peculiar interacting system and is part of a medium-poor cluster of galaxies in the constellation Hydra (Fairall 1979). This galaxy (still optically unclassified) shows strong [O iii] 4959, 5007 as well as narrow Hβ emission lines, produced in a region wider than the galaxy core (maybe chaotic filaments). These emission lines, combined with the spectral features observed in the two other neighboring interacting galaxies (Fairall 271 and Fairall 273), suggest that Fairall 272 hosts an active nucleus of unknown class (the filaments could be associated with ejective or explosive processes).
Fairall 272 is also a radio emitter, detected in the NVSS catalog with a 20 cm flux of mJy; as none of the other nearby galaxies is detected at this frequency, it is likely that Fairall 272 is the most active galaxy of the group. An IRAS source (IRAS 08205–0446), located only 0′.6 away, is likely associated with Fairall 272.
A preliminary analysis of the XRT data indicate that the X-ray spectrum is either flat with negligible absorption, or a more canonical one (), but absorbed ( cm-2; Ajello et al. 2006a). The results of our spectral analysis confirm these previous findings: a flat ( 0.7) unabsorbed power law is a good description of the XRT data (, but since we cannot put any constraint on the photon index, we prefer to fix in the fitting procedure and estimate the absorption local to the source (see Table 2).
The optical spectrum of Fairall 272 shows narrow (FWHM 750 km s-1) Hα, Hβ, [N ii], [S ii], [Oi] and [O iii] emission lines over a flat continuum (Figure 13, central left panel). These features put the source at redshift , consistent with the measurement of Fouque et al. (1992), which implies a luminosity distance = 108 Mpc and a 2–10 keV luminosity of erg s-1. In this case also, the line shapes and ratios indicate that this is a Seyfert 2 galaxy. In view of the optical classification an absorbed power law is preferred to an unabsorbed flat spectrum.
The Hα/Hβ flux ratio of 6.1 provides a dereddened [O iii] flux of erg cm-2 s-1 and the diagnostic ratios indicate that this is a Compton thin AGN (see Table 7). This substantially confirms the X-ray characterization of the source as a not heavily absorbed AGN.
5.4 Swift J0918.5+1618
This Swift object coincides with the galaxy Mrk 704 ( = 0.029; e.g., Hewitt & Burbidge 1991), which has been detected earlier in X-rays by ROSAT (Schwope et al. 2000) and ASCA, and is listed in the RXTE Slew Survey (Revnivtsev et al. 2004). This galaxy is detected in the radio by the NVSS survey with a 20 cm flux of mJy; it is also an IRAS source and a 2MASS extended object.
The source has been classified in the literature as a Seyfert galaxy but of different types ranging from 1 to 1.5 (see for example a compendium in Nagao, Taniguchi & Murayama 2000); it is also considered a peculiar type of Seyfert 1 AGN (i.e. a “polar scattered” object) as it has spectropolarimetric properties consistent with those found in type 2 Seyfert galaxies despite its type 1 optical classification (Nagao, Taniguchi & Murayama 2000). According to recent modeling, “polar scattered” Seyfert 1 are those viewed at an inclination very close to 45∘, such that the line of sight passes through the outer layers of the torus whereas type 1 and 2 Seyfert galaxies have inclinations lower and greater than 45∘ respectively (Smith et al. 2004; Hoffman et al. 2005).
This latter fact seems to be more consistent with an intermediate optical classification: given that the Broad Line Region (BLR) is obscured by a dusty torus, the emission lines would appear with a composite profile consisting of both narrow and broad emissions.
The X-ray information on this object also suggests that we are dealing with a peculiar object. Ajello et al. (2006a) reported inconsistencies between the BAT and XRT spectra and further suggested, through the analysis of archival ASCA data, that the source might be in the Compton thick regime, in contrast with its optical classification as a type 1 AGN.
This prompted our optical follow-up observations in order to assess the spectral characteristics of this object relatively close in time to the Swift measurement.
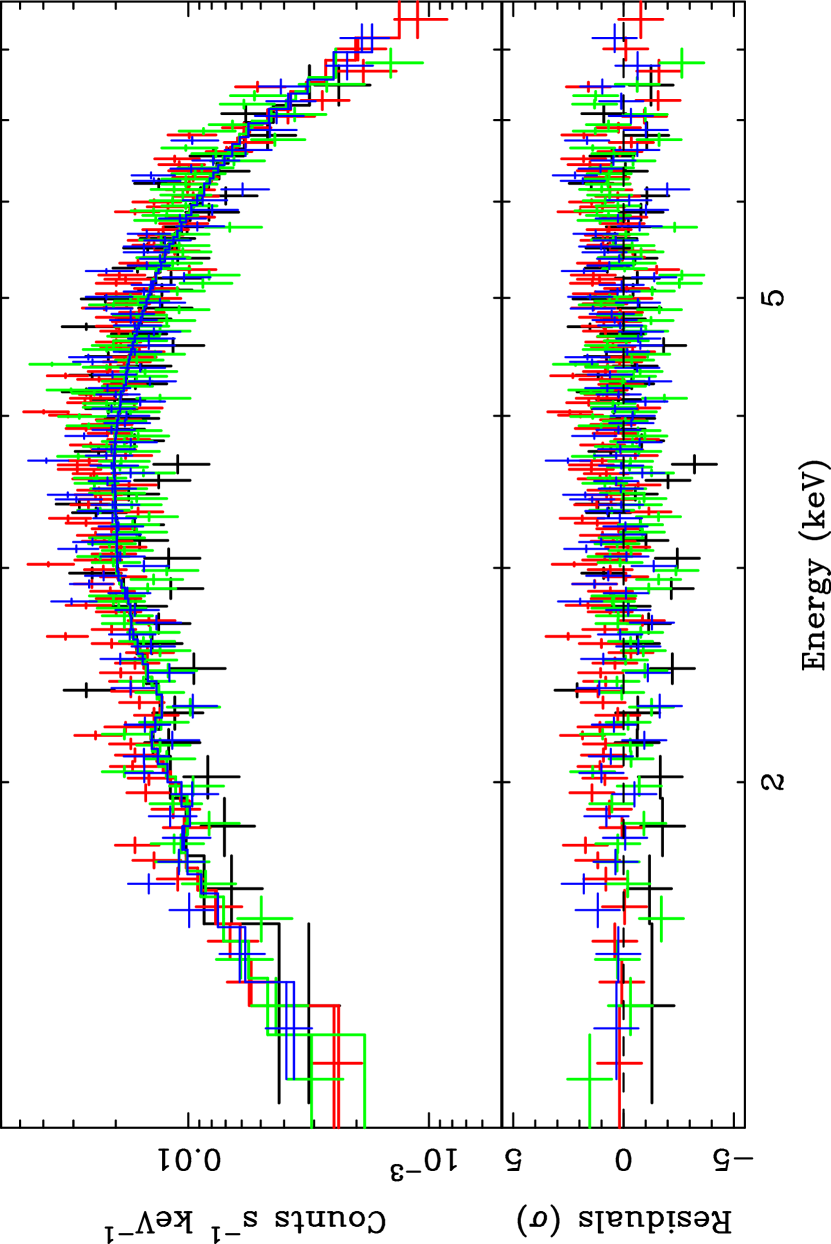
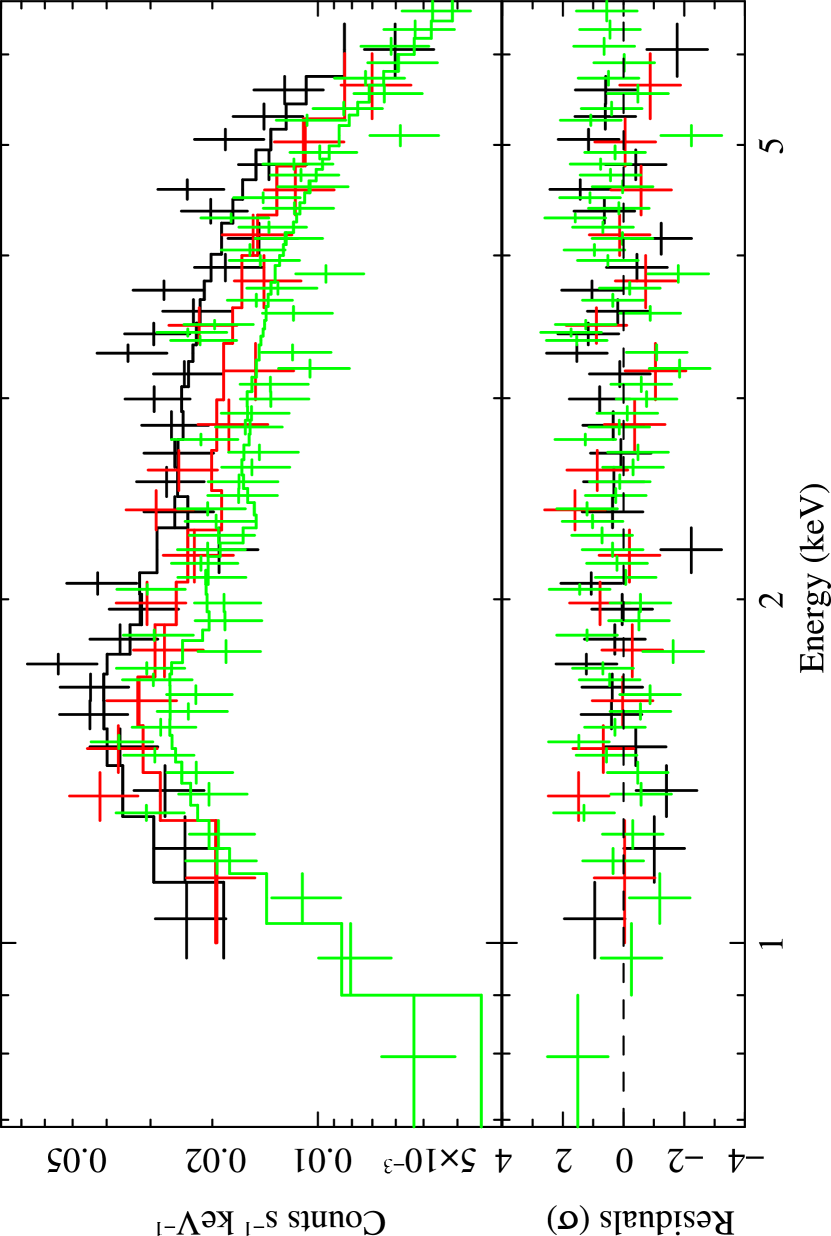
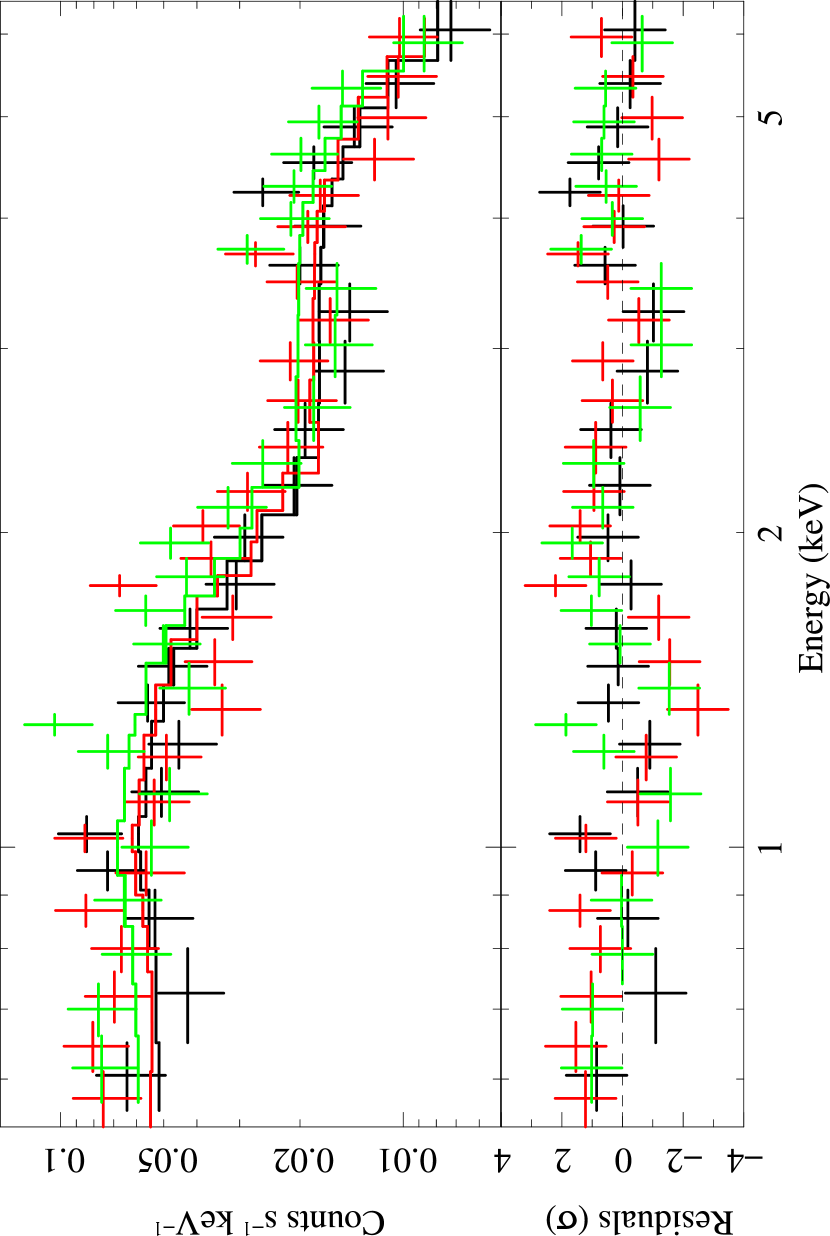
Due to the low statistical quality of the first XRT observation, only the last three measurements have been taken into account for the spectral analysis. All data sets are compatible with each other being well fitted with a steep ( 1.8–1.9) power law having mild absorption (see Table 2). There was a change in flux (60%) between the three XRT observations separated by a few months, but no variation within the individual measurements.
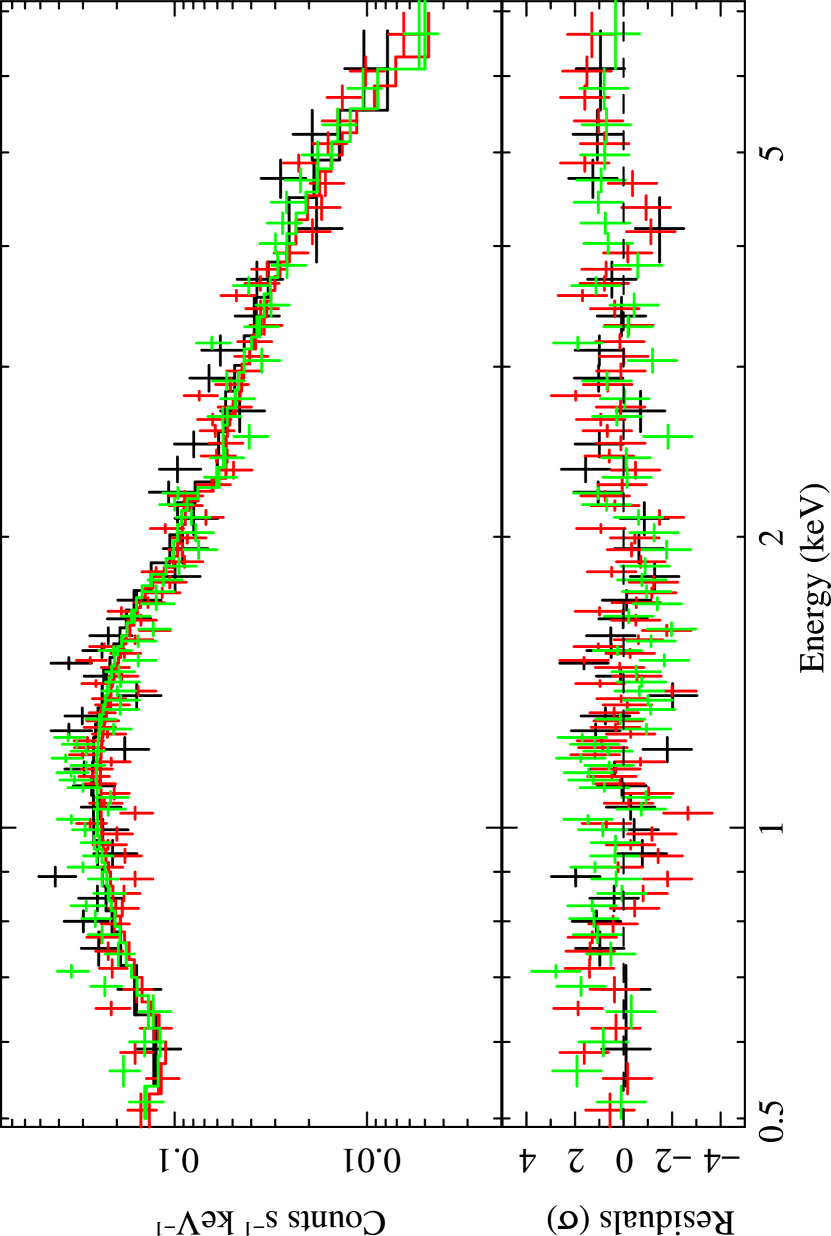
Broad He i, He ii, Fe i, and Balmer emissions at least up to Hζ (FWHM 5500 km s-1), as well as narrow Hα, Hβ, [N ii], [S ii], [O i], [O iii] and [Ne iii] emission lines are detected in the optical spectrum of Swift J0918.5+1618 (Figure 13, central right panel), which moreover shows a blue continuum. The spectrum, and a Hβ/[O iii] flux ratio of (2.3), together imply a Seyfert 1.2 AGN classification for this galaxy. From the observed wavelengths of narrow features, we determine a redshift , in agreement with previous measurements. This gives a luminosity distance = 131.9 Mpc to the source. At a redshift = 0.028, the 2–10 keV luminosity of Swift J0918.5+1618 was erg s-1 at the time of the XRT observation.
Clearly, our optical and X-ray results are at odds with the conclusions of Ajello et al. (2006a), suggesting the use of ASCA data to get a more detailed picture of the source X-ray spectrum.
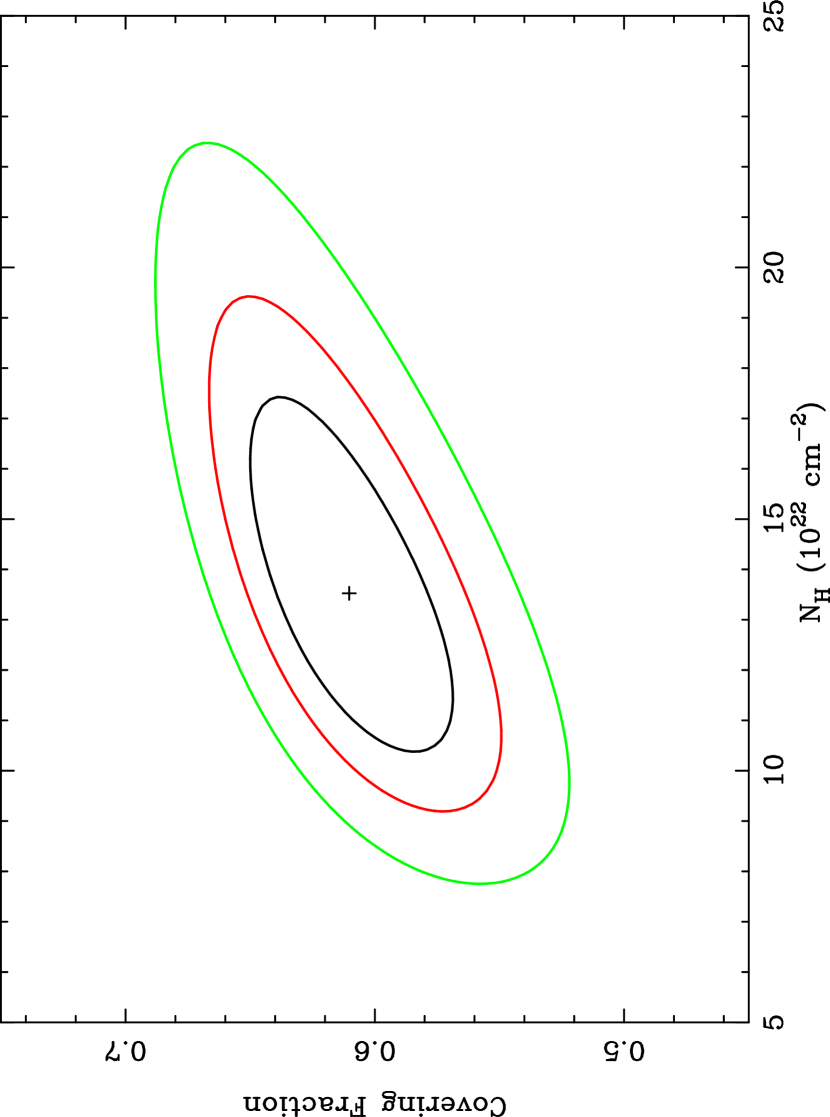
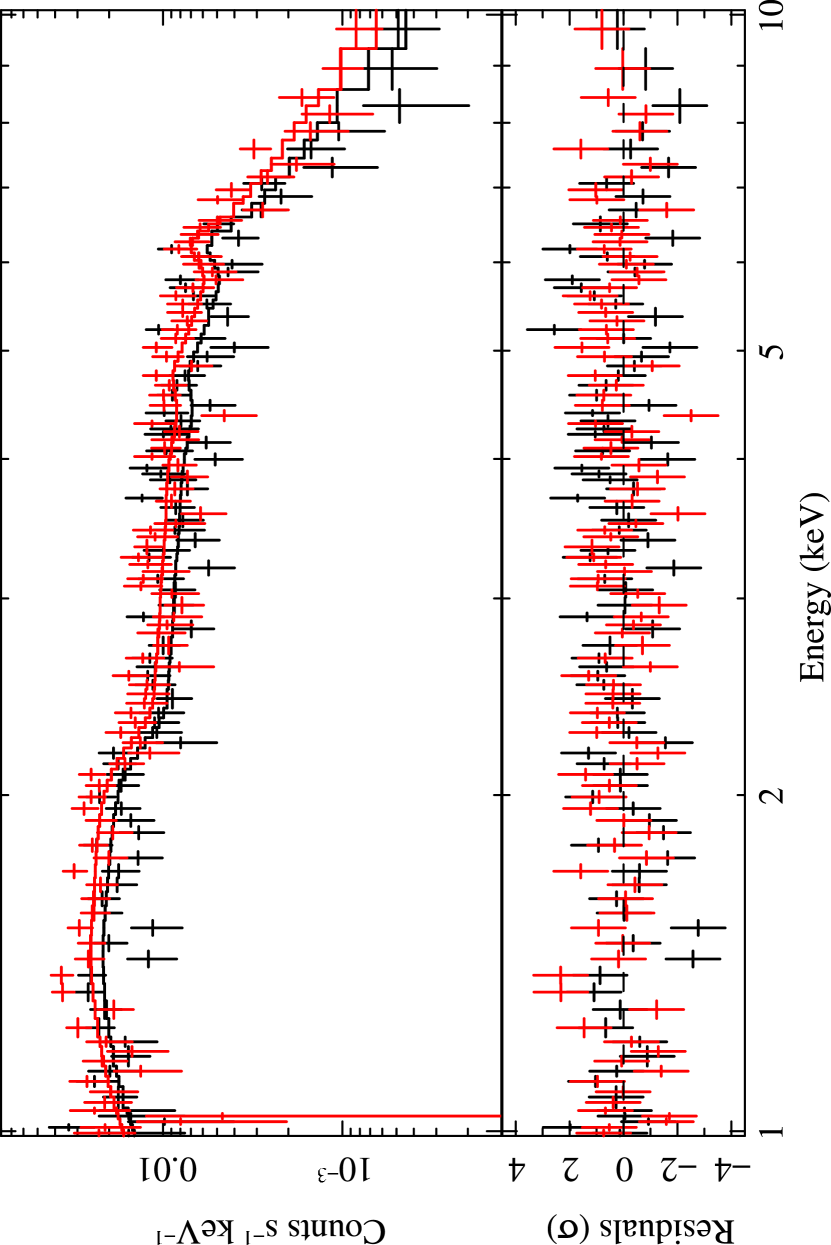
ASCA observed Swift J0918.5+1618 on May 12 1998 for an effective exposure time, for the GIS instrument, of 38 ks. A fit to the GIS spectra with a simple power law seen through Galactic absorption provides a poor fit to the data () and a flat photon index ( 1), suggesting the presence of more complex absorption. We therefore applied a partial covering model, as observed in other intermediate Seyfert galaxies like Mrk 6 (Malizia et al. 2003), Mrk 1152 (Quadrelli et al. 2003) and 4U 1344–60 (Piconcelli et al. 2006).
The addition of this component strongly improves the value, being significant at more than 99.99% confidence level ( for two degrees of freedom). Inspection of the residuals around the expected iron line position suggests the presence of such a feature. In fact, the inclusion of this extra component further improves the fit ( for two degrees of freedom) and gives a column density of cm-2 covering 61 of the source (see in Figure 3 and a narrow line at 6.4 keV with an of 233 eV, which is typical of Seyfert 1 galaxies (Turner et al. 1997). With this best-fit model (see Table 4 and Figure 4), the power law photon index is 1.5, similar to that observed in other AGN showing complex absorption. Extrapolation of the ASCA best-fit to the 10–100 keV energy band provides a flux consistent with the BAT one.
In order to search for consistency between the ASCA and XRT results, we re-fitted the whole XRT data set with the ASCA best-fit model, finding an equally acceptable fit (); however, in this case, the column density was much lower ( cm-2) while the covering fraction was compatible with the ASCA measurement. This is very similar to what has been observed in similar sources where the absorption changes but the covering fraction remains constant (see, for example, Malizia et al. 2003 for Mrk 6). It also explains why the 2–10 keV flux observed by Swift XRT, ASCA and RXTE (Revnivtsev et al. 2004) is highly variable, by about a factor of 2 on long (years) time-scales, with the XRT measurement being in the middle of the range of the observed values, (0.5–1.4) erg cm-2 s-1.
To conclude, it is important to stress that this source is not Compton thick, but more likely an absorbed intermediate Seyfert 1 galaxy, where the BLR is observed through the upper layers of the torus. This is further confirmed by our diagnostic ratios, which locate the object in a region populated by Compton thin Seyfert galaxies (see Table 7).
5.5 Swift J1009.3–4250
This Swift source (Ajello et al. 2006b) coincides in position with ESO 263–13 (= Fairall 427), a face-on spiral galaxy at redshift =0.03330.0003, classified as a Seyfert 2 galaxy (Fairall 1983); it is a peculiar source as it has a double nucleus (Gimeno et al. 2004) and it shows an extended ionized nebulosity (Durret 1989). This object is also a radio emitter, detected in the SUMSS catalog with a 36 cm flux of mJy, and it is listed in the extended 2MASS catalog.
According to Ajello et al. (2006b), a model including an absorbed power law plus a reflection component (pexrav model in XSPEC) provides a good description of the combined XRT/BAT spectra, yielding a photon index 2 and a lower limit for the absorbing column density of cm-2, again suggesting a Compton thick nature.
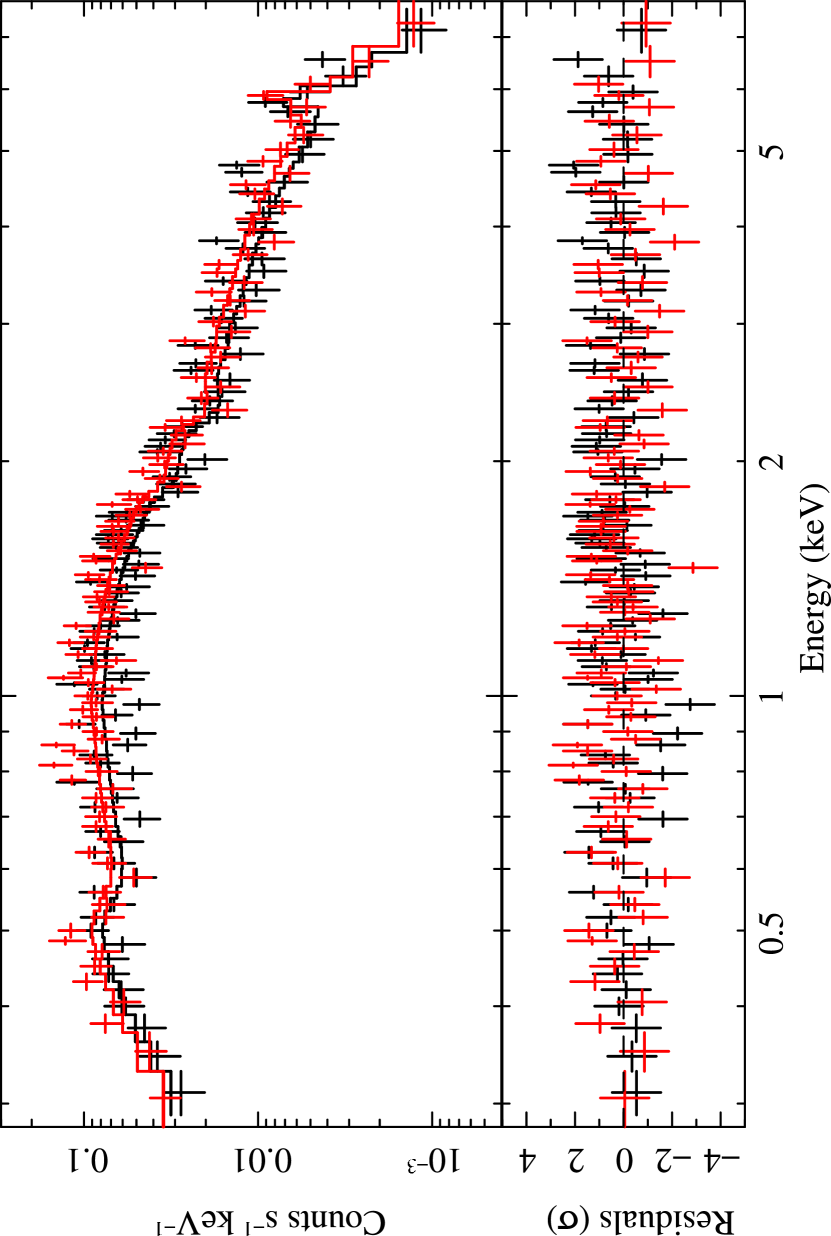
Our XRT data of Swift J1009.3–4250 are well described by our baseline model plus another power law, having the same photon index, but absorbed only by the Galactic column density; the extra power law component is required (at a confidence level 99.99% in the combined spectrum and in the range 95.4–99.99% in each single pointing) to account for excess emission observed below 2 keV (see Figure 5). The observed column density is 3–4 cm-2, well below the Compton thick regime. We also found a flux variation of 50 among the XRT observations, but no evidence for spectral changes.
The 6dF optical spectrum of ESO 263–13 shows a flat continuum with the presence of narrow Balmer, He ii, [N ii], [S ii], [O i], [O ii] and [O iii] emissions, with FWHM 600 km s-1 (Figure 13, lower left panel) and at a redshift (Jones et al. 2004), which is consistent with the result of Fairall (1983). This corresponds to a luminosity distance = 159 Mpc and gives a luminosity of (4.5–8.4) erg s-1 in the 2–10 keV energy band. The narrowness of the lines and their relative strengths as seen in the 6dF spectrum confirm the Seyfert 2 nature of this galaxy.
The Hα/Hβ flux ratio of 4.0 provides an optically dereddened [O iii] flux of erg cm-2 s-1 which, when compared with the 2–10 keV X-ray flux, implies an AGN in the Compton thin regime (see Table 7). This is confirmed by the / ratio, which, although low, is nevertheless compatible with the observed column density. We therefore rule out the Compton thick hypothesis put forward by Ajello et al. (2006b).
5.6 Swift J1038.8–4942
This source (Tueller et al. 2005) is likely associated with an extended 2MASS object (2MASX J10384520–4946531), which is identified with an unclassified galaxy. No redshift is known, and no radio emission has so far been reported from this object. The source is also listed in the ROSAT All Sky Survey Bright Source Catalog (Voges et al. 1999) and is associated with an IRAS object.
Preliminary analysis of the XRT data (Tueller et al. 2005) provided information only on the absorption ( 1022 cm-2). Our analysis indicates either a flat spectrum and lower absorption or a more canonical one with a similar column density (see Table 2 and Figure 6); furthermore, we detect variations in flux of 10–30 between observations.
Optical spectroscopy of this object shows broad Hα and Hβ emissions (FWHM 6700 km s-1) with a narrow component on top; moreover, narrow [N ii], [S ii], [Ne iii], [O i] [O ii] and [O iii] emission lines are detected on a relatively flat continuum (Figure 13, lower right panel). The Hβ/[O iii] flux ratio, 1.7, allows us to classify this galaxy as a Seyfert of type 1.5. From the observed wavelengths of narrow features, we determine for the first time a redshift for this galaxy, which means a luminosity distance = 289.3 Mpc. This corresponds to a 2–10 keV luminosity range (7.8–11.7)1043 erg s-1 and, assuming a magnitude 16.1 and no local absorption in the optical, an absolute -band magnitude MB 23.2.
Given its optical classification, this object is obviously Compton thin, as confirmed by our diagnostic ratios; it is, however, another interesting case of an intermediate Seyfert with intrinsic absorption.
5.7 Swift J1200.8+0650
This BAT source (Kennea et al. 2005) has been associated with PGC 037894 (also CGCG 041–020 and LEDA 37894), a principal galaxy at redshift , which has not been optically classified yet. The source is a weak radio emitter detected in the NVSS and FIRST (Faint Images of the Radio Sky at Twenty-centimeters, White et al. 1997) surveys with a 20 cm flux in the range 5–6 mJy; like other AGNs of our sample, it is an IRAS faint source and a 2MASS extended object.
In this case, no X-ray emission has so far been reported. Individual or combined X-ray data provide an acceptable fit with an absorbed power law having a column density of (6–8) cm-2 and a photon index in the range 1.3–1.8 (see Table 2 and Figure 7).
The addition of a narrow Gaussian Fe K line in the XRT spectrum of the first observation (thicker crosses in Figure 7) does not significantly improve the quality of the fit ( for 2 degrees of freedom or 95.4% confidence level), but returns a line energy of E 6.3 keV and an of 266 eV, much in line with other AGN measurements of this feature. It is likely that a longer dedicated exposure could provide further insight on the presence of this feature.
The optical spectrum of PGC 037894 shows Hα, Hβ, [N ii], [S ii] and [O iii] narrow (FWHM 850 km s-1) emission lines over a flat continuum (Figure 14, upper left panel). The features are at redshift , consistent with Grogin, Geller & Huchra (1998), which corresponds to a luminosity distance = 165.8 Mpc and gives a erg s-1 2–10 keV luminosity for this source. Again, the line shapes and ratios indicate that this is a Seyfert 2 galaxy.
The Hα/Hβ flux ratio 3 upper limit ( 4.7) implies a dereddened [O iii] flux erg cm-2 s-1. The diagnostic ratios, and also the possible iron line value, place this source well in the Compton thin regime, indicating that is a classical type 2 AGN.
5.8 Swift J1238.9–2720
This source (Tueller et al. 2005) is associated with the optically unclassified galaxy ESO 506–G027, at (Da Costa et al. 1998). This is a radio emitter with a 20 cm flux of mJy in the NVSS survey. This galaxy is also an IRAS faint source and it is an extended 2MASS object.
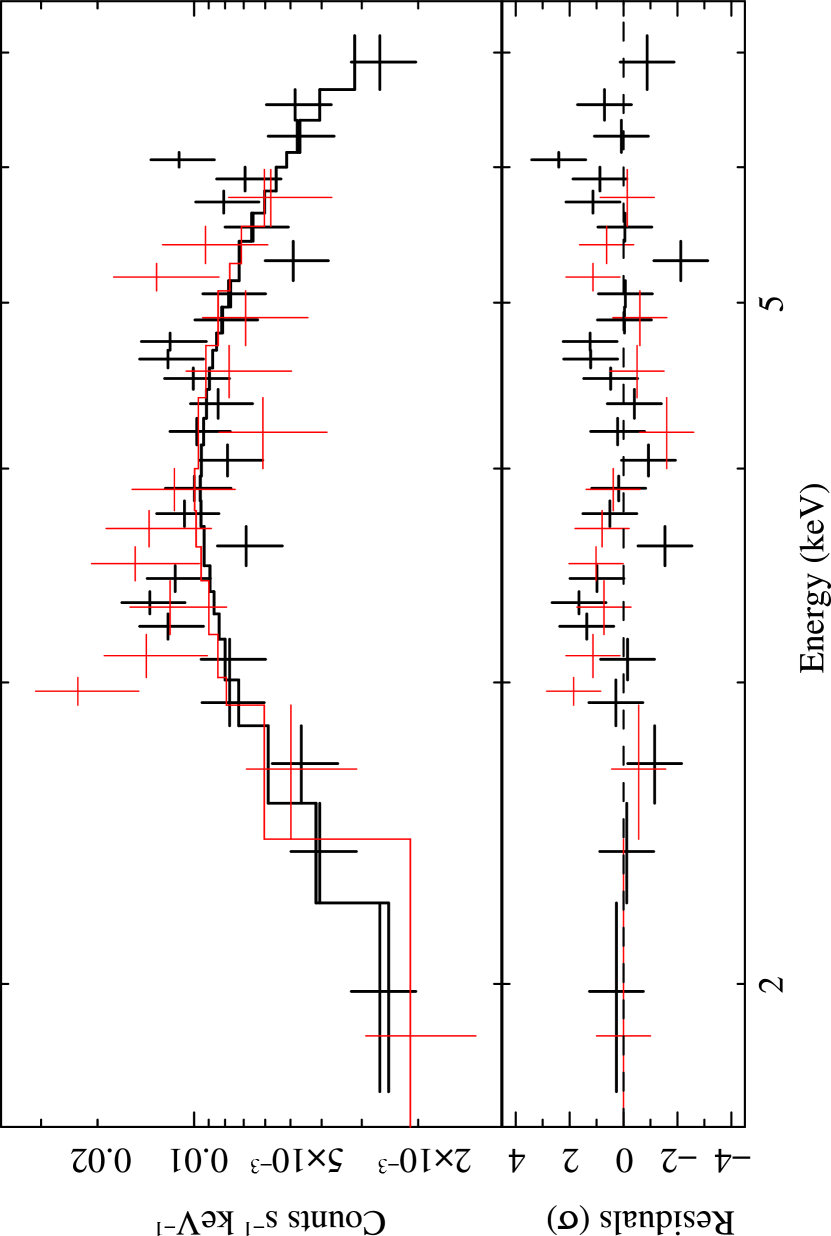
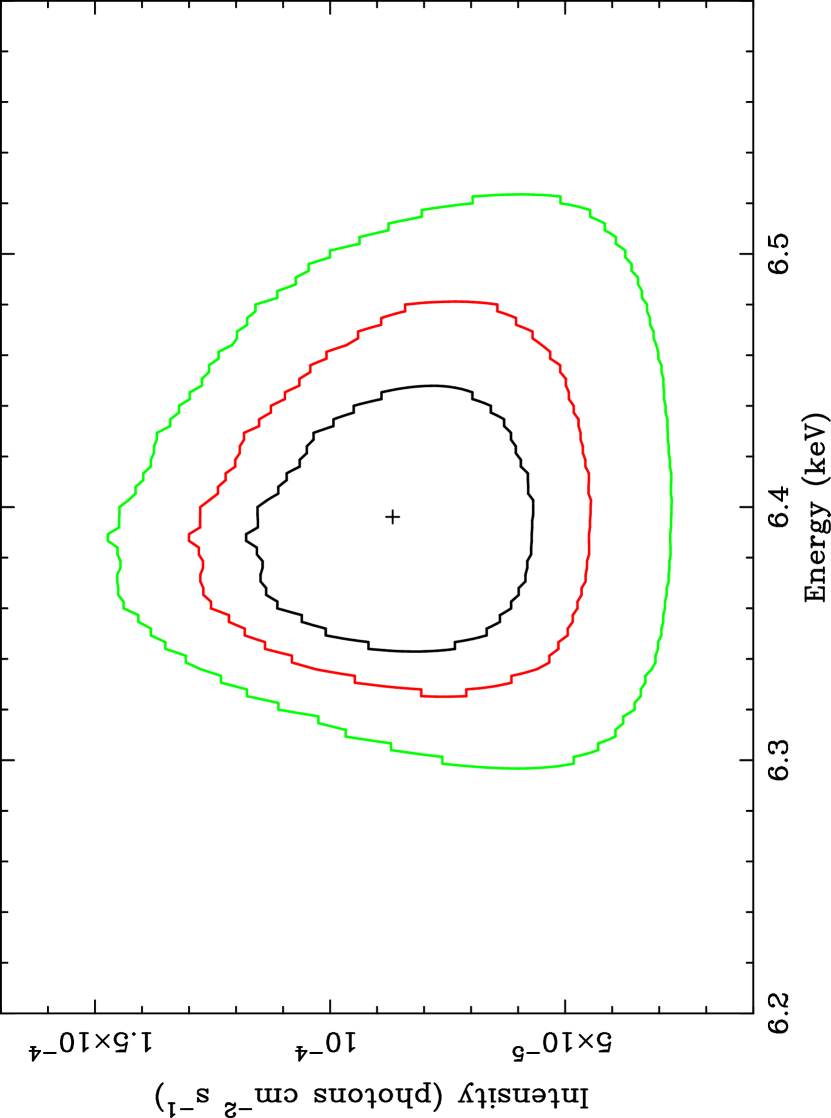
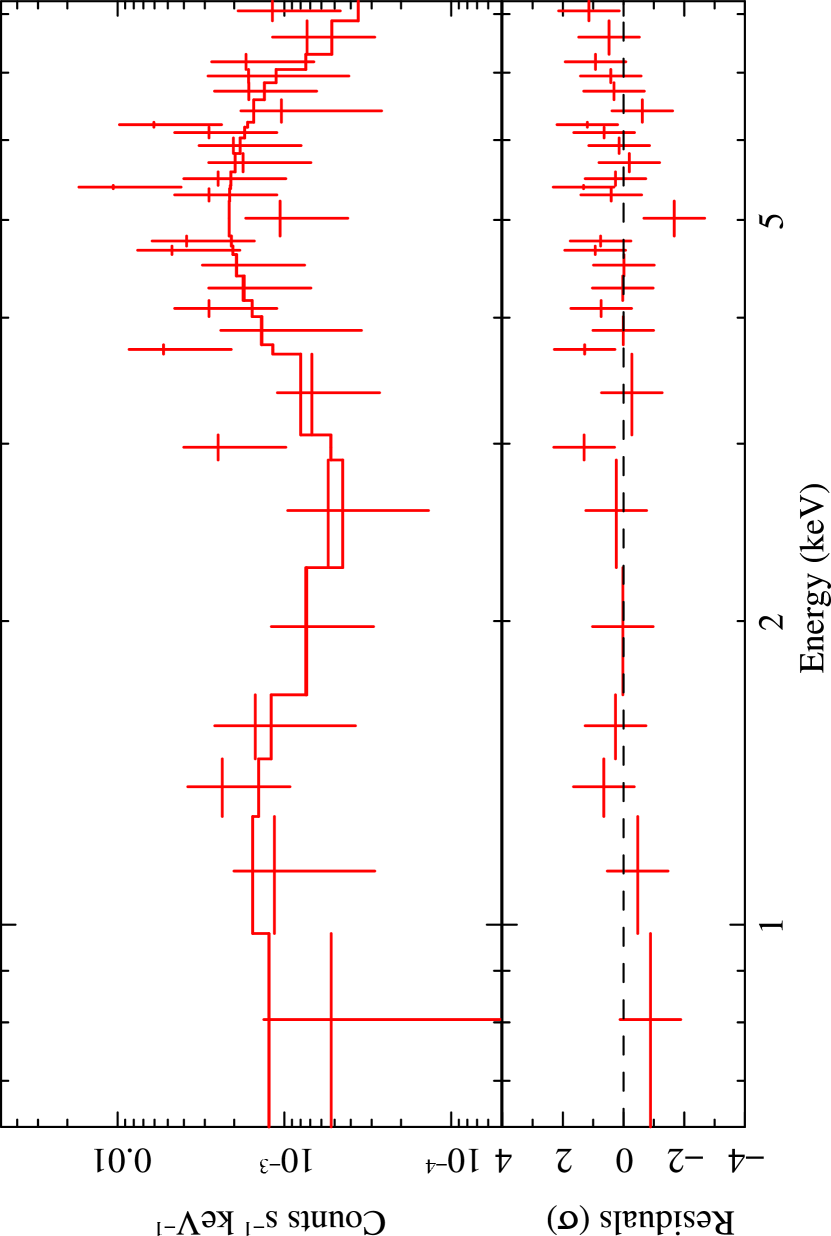
A preliminary analysis of the XRT data indicated that it might be a Compton thick object showing strong absorption ( 1023 cm-2) and an iron line with of about 500 eV (Tueller et al. 2005). The data indicate a change in flux (20%) between the first and second observations on a time-scale of a few months (see Table 3); this evidence casts some doubts on the Compton thick nature of the source as the reflection component, if due to the torus, is expected to provide flux changes on longer time-scales. Individual and combined spectra are not of sufficient quality to allow a constraint on the photon index which was therefore fixed to the canonical value of 1.8; the observed column density is 1023 cm-2 and a narrow iron line is detected with 99.73% confidence ( for 5 degrees of freedom) (see Figure 8). The two-dimensional iso– contour plot of line intensity versus energy is shown in Figure 9. The line has an of 500 eV which does not necessarily imply that we are dealing with a Compton thick AGN, as a similar value is also compatible with the observed column density (Turner et al. 1997).
The optical spectrum (Figure 14, upper right panel) of this source may help in assessing its Compton nature. The presence of Hα, Hβ, [N ii] and [O iii] narrow (FWHM 1000 km s-1) emission lines detected on a spiral galaxy continuum and the overall spectral appearance indicate that this source is most likely a Seyfert 2 galaxy. All emission features are at redshift , consistent with Da Costa et al. (1998). This implies a luminosity distance = 112.7 Mpc and a (6.4–8.2)1042 erg s-1 2–10 keV luminosity range for this galaxy.
The Hα/Hβ flux ratio 3 upper limit of 23, gives a dereddened [O iii] flux greater than erg.
The flux ratios provide contradictory results as the / indicates a Compton thick nature, while the / and / provide evidence for a thin behavior. However, the observed column density is sufficient to explain the low values of the first ratio: very likely, this is a borderline object in between the thin and thick Compton regimes.
5.9 Swift J1930.5+3414
This source has a counterpart classified as a galaxy in the 2MASS extended catalog (2MASX J19301380+3410495) (Kennea et al. 2005). The source is possibly detected as a radio source located away (NVSS J193013+341047) by the NVSS survey, with a 20 cm flux of mJy and it is also likely an IRAS source. It has recently been classified as a Seyfert 1 galaxy at a redshift (Halpern 2006) but no X-ray data have so far been reported.
The X-ray spectrum is well described (see Fig 10) by an absorbed power law with photon index frozen at 1.8 plus a power law having the same photon index but only absorbed by the Galactic column density. This extra component is required by the data with a significance and accounts for excess emission below 2 keV (see Table 3). We estimate an intrinsic column density of cm-2, a value at odds with the Seyfert 1 classification.
In the spectrum of the optical counterpart of Swift J1930.5+3414, we confirm the emission features reported by Halpern (2006), i.e., broad (FWHM 5800 km s-1) Balmer lines with a narrow component on top and with an overall skewed profile, as well as a prominent narrow (FWHM 900 km s-1) [O iii] line along with narrow [S ii], [O ii], [Ne iii] emissions and other weaker features, all superimposed on a flat continuum (Figure 14, central left panel). The narrow emission lines are at redshift , in agreement with Halpern (2006). This corresponds to a luminosity distance = 303.9 Mpc and gives a 2–10 keV luminosity of erg s-1 for this source. Likewise, assuming a magnitude 17.0, one gets an absolute -band magnitude MB 21.2. This should however be considered as a conservative upper limit as no absorption local to the host galaxy was accounted for.
The Hβ/[O iii] flux ratio, 0.34, allows us to revise the Seyfert 1 AGN classification given by Halpern (2006) and to classify this object as an intermediate Seyfert of type 1.5–1.8; the absorption detected suggests that a higher Seyfert classification may be more appropriate. Furthermore, the diagnostic ratios indicate that this AGN operates in the Compton thin regime.
5.10 Swift J1933.9+3258
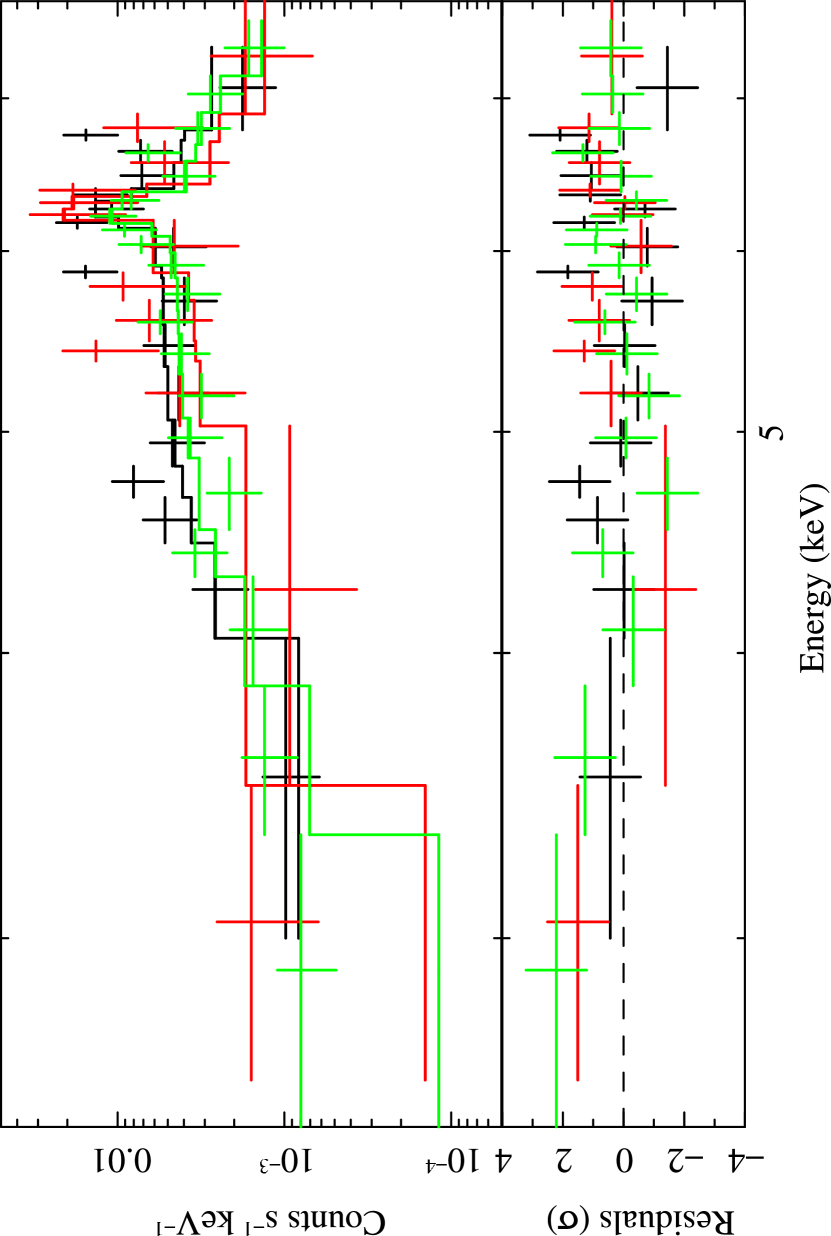
This source (Grupe et al. 2006) was first discovered as a bright X-ray source during the ROSAT All Sky Survey as 1RXS J193347.6+325422 (Voges et al. 1999). The object has a counterpart in the 2MASS and IRAS catalogs and it is also listed in the NVSS survey (NVSS J193347+325426) with a 20 cm flux of mJy. The Swift BAT detection triggered an optical spectroscopic observation, which allowed the classification of the source as a Seyfert 1.2 galaxy at (Torres et al. 2006). Preliminary analysis of the XRT data (Grupe et al. 2006) provided a best-fit model of a broken power law with a soft photon index of 3, a hard photon index of 2, 1.3 keV and an absorption column density cm-2, which is in agreement with the value found with ROSAT data.
Our XRT analysis, although consistent with a broken power law description, is also compatible with a simple power law model (see Fig 11) with 2 (see Table 2); in either case, we do not find evidence for absorption ( cm-2) in excess of the Galactic value.
The optical spectra we acquired show broad He i, He ii, Fe i, and Balmer emissions (FWHM 3800 km s-1) at least up to Hζ, as well as narrow (FWHM 800 km s-1) [O iii] and [Ne iii] emission lines (Figure 13, central right panel) on a blue continuum. The spectral appearance, together with a Hβ/[O iii] flux ratio (3.5), implies a Seyfert 1.2 classification for this galaxy, in agreement with Torres et al. (2006); the redshift inferred from the optical spectrum is , also in agreement with Torres et al. (2006).
This gives a luminosity distance = 284.3 Mpc to the source, which corresponds to a luminosity of erg s-1 in the 2–10 keV band and an absolute -band magnitude MB 24.5 (assuming 13.9). The overall picture, including the value of the diagnostic ratios, is that of a “canonical” Seyfert galaxy of type 1.
5.11 XSS J12303–4232
This source is listed in the RXTE Slew Survey (XSS, Revnivtsev et al. 2004); it is associated with a bright ROSAT object localized with sufficient accuracy to allow its identification with an IRAS object (F12295–4201) that is still unclassified. A previous analysis of the XRT data suggested that the spectrum was typical of a type 1 AGN and that it contained a redshifted ( 0.1) iron line (Revnivtsev et al. 2006).
Our own analysis of individual and combined XRT data confirms the presence of a canonical AGN spectrum (see Table 2 and Figure 12); an iron line is required by the data with 99% confidence level ( for 2 degrees of freedom).
The RXTE flux of erg cm-2 s-1 in the 3–8 keV energy band is fully compatible with the two XRT measurements.
Optical spectroscopy of the object at the XRT position shows broad Balmer, He i, He ii and Fe i emissions (FWHM 5800 km s-1) plus narrow [O i], [O ii] and [O iii], [N ii], [S ii], [Ne iii] emission lines, detected on a flat spectral continuum (Figure 14, lower left panel); Hα and Hβ also show a narrow component on top of the broad one. The Hβ/[O iii] flux ratio, 1.1, allows us to classify this object as a Seyfert 1.5. From the observed wavelengths of the narrow features, we determine for the first time a firm redshift for this galaxy at , definitely compatible with the value inferred by X-ray analysis of the iron line. The source luminosity distance is = 495.7 Mpc, providing a (9.1–15.3)1043 erg s-1 luminosity range and, assuming 14.3 and no local absorption, an absolute magnitude MB 24.6.
As expected, the diagnostic ratios further confirm that this source is in the Compton thin regime.
6 Conclusions
We have presented optical classification and X-ray characterization of 12 hard X-ray selected objects: 11 are associated with active galaxies and only one turned out to be an Intermediate Polar (magnetic) CV at 170 pc from Earth (see Appendix). Optical spectroscopy allowed, for the first time, the classification of 8 objects and a distance determination for 3 of them. For another object a more refined optical classification than that available in the literature is also provided. In the 3 remaining objects, optical spectroscopy provides a characterization of the source closer in time to the X-ray measurement. Of this AGN sample, 6 objects are Seyfert 2 galaxies and 5 are Seyferts of intermediate type 1.2–1.8; 70 of the sample is absorbed with cm-2. At least 2 type 1–1.5 objects show absorption in excess of the Galactic value; particularly interesting is the case of Swift J0918.5+1618 (Mrk 704) in which the absorption is complex and may be linked to the polar scattered nature of the source. At most 3 objects (Swift J0444.1+2813, Swift J0601.9–8636 and Swift J1238.9–2720) could be Compton thick. However, in the case of Swift J0444.1+2813 and Swift J1238.9–2720 the diagnostic ratios provide controversial results: while the / ratio indicates a Compton thick object, two other ratios suggest a Compton thin nature. Both the upper limit on the iron line and the short-term variability argue against a Compton thick nature for Swift J0444.1+2813. In the case of Swift J1238.9–2720, the X-ray data analysis indicates the presence of intrinsic absorption with cm-2 and of a 6.4 keV iron line with an 500 eV, and suggests that we are dealing with a borderline source, heavily absorbed, but not truly Compton thick. The third source, Swift J0601.9–8636 is probably the best candidate Compton thick object in the entire sample. Overall, our findings emphasize the need for hard X-ray surveys to discover and properly sample the population of absorbed AGNs.
7 Acknowledgements
We thank Stefano Bernabei and Roberto Gualandi for the assistance at the telescope in Loiano, and Claudio Aguilera and Arturo Gomez for their support during observations at CTIO. This research has made use of data obtained from SIMBAD database operated at CDS, Strasbourg, France; the High Energy Astrophysics Science Archive Research Center (HEASARC), provided by NASA’s Goddard Space Flight Center; the USNO-A2.0 and 2MASS catalogs; the NASA/IPAC Extragalactic Database (NED); the ASI Scientific Data Center; and the HyperLeda catalog operated at the Observatoire de Lyon, France. This research has been supported by ASI under contracts I/008/07/0 and I/023/05.
Appendix A Swift J0732.5–1331
This is the only source in our list which is not extragalactic. It coincides in position with the Bright ROSAT All Sky Survey source (RASS) 1RXS J073237.6–133113 (Voges et al. 1999).
A preliminary analysis of the XRT spectrum (Ajello et al. 2006a) indicates that either a power law with photon index , or a Raymond-Smith model (Raymond & Smith 1977) with a temperature of 60 keV are a good fit to the data; in both cases, the hydrogen column density is below 1019 cm-2, which implies a rather small distance from Earth. A reanalysis of the data by Wheatley, Marsh & Clarkson (2006) showed that a partial covering absorption model allows the fitted temperature to drop to a value of 20 keV.
Our own analysis of the XRT data are in agreement with the Wheatley, Marsh & Clarkson (2006) results, providing a best-fit model of a partially covering absorber ( cm-2 and 60%) plus a thermal component (mekal model in XSPEC, see Mewe, Gronenschild & van der Oord 1985) having an average of 15 keV (see Figure 15 and Table 3). We therefore confirm previous findings both for individual observations and for the average spectrum (see Table 3).
Masetti et al. (2006e) stressed that the Swift XRT error box encompasses two objects; the brighter one (with 12.4) has the spectrum of a normal G/K-type Galactic star. The fainter one (with 14.2), located 10′′ southeast with respect to the brighter object, is instead the true optical counterpart: spectroscopy reveals Hα, Hβ, He i 5875 and He ii 4686 in emission at redshift zero, superimposed on a very blue and otherwise featureless continuum (Figure 16). These signatures are typical of the accretion disk of a Galactic X-ray binary.
Marsh et al. (2006) subsequently found that the counterpart proposed by Masetti et al. (2006e) resolves into two stars approximately 1′′.8 apart and lying along a North-East/South-West axis, and that the actual counterpart is the northeastern star of the close pair. This star is also approximately half as bright as its companion in the g’ optical filter.
After this report, optical and X-ray follow-up observations revealed a pulsation period (512.42 s, Patterson et al. 2006; Wheately, Marsh & Clarkson (2006)) and an orbital periodicity (0.2335 d, Thorstensen et al. 2006), which suggest that this object could be classified as an Intermediate Polar (IP) magnetic Cataclysmic Variable (CV).
Indeed, the optical spectrum we obtained (Fig. 13, central left panel) shows that the of He ii () Å and Hβ () Å have a ratio typical of IP CVs. In addition, the observed inverted Hα/Hβ Balmer ratio (2.2) is often found in this class of objects; it also suggests negligible absorption towards the source, in agreement with the X-ray data.
Considering no interstellar absorption, an absolute optical magnitude MV 9 and an intrinsic color index 0 mag (Warner 1995) for the object, and assuming that the true counterpart contributes to roughly one third of the total magnitude ( 14.2) from the close star pair, we derive a distance of 190 pc. This implies a 2–10 keV luminosity for this source of erg s-1.
References
- (1) Ajello, M., Greiner, J., Rau, A., et al. 2006a, ATel, 697
- (2) Ajello, M., Greiner, J., Kpc Yoldas, A., et al. 2006b, ATel, 864
- (3) Bassani, L., Dadina, M., Maiolino, R., Salvati, M., Risaliti, G., Della Ceca, R., Matt, G., & Zamorani, G. 1999, ApJS, 121, 473
- (4) Bikmaev, I. F., Sunyaev, R. A., Revnivtsev, M. G., & Burenin, R. A. 2006, Astr. Letters, 32, 221
- (5) Bird, A. J., Malizia, A., Bazzano, A., et al. 2007, ApJS, 170, 175
- (6) Colless, M. 2003, http://www2.aao.gov.au/2dFGRS/Public/Release/PhotCat/photcalib.html
- (7) Condon, J. J., Cotton, W. D., Greisen, E. W., et al. 1998, AJ, 115, 1693
- (8) Da Costa, L. N., Willmer, C. N. A., Pellegrini, P. S., et al. 1998, AJ, 116, 1
- (9) David, L. P., Jones, C., & Forman, W. 1992, ApJ, 388, 82
- (10) Durret, F. 1989, A&AS, 81, 253
- (11) Dickey, J. M., & Lockman, F. J. 1990, ARA&A, 28, 215
- (12) Fairall, A. P. 1979, Nature, 279, 140
- (13) Fairall, A. P. 1983, MNRAS, 203, 47
- (14) Fisher, K. B., Huchra, J. P., Strauss, M. A., Davis, M., Yahil, A., Schlegel, D. 1995, ApJS, 100, 69
- (15) Fouque, P., et al. 1992, Catalog of optical radial velocities, Obs. Lyon et Paris-Meudon, Vol. 1, p. 1
- (16) Gehrels, N., Chincarini, G., Giommi, P., et al. 2004, ApJ, 611, 1005
- (17) Gimeno, G. N., Díaz, R. J., & Carranza, G. J. 2004, AJ, 128, 62
- (18) Grogin, N. A., Geller, M. J., & Huchra, J. P., ApJS, 119, 277
- (19) Grupe, D., Tueller, J., Markwardt, C., et al. 2006, Atel, 859
- (20) Halpern, J. P. 2006, ATel, 847
- (21) Hambly, N. C., MacGillivray, H. T., Read, M. A., et al. 2001, MNRAS, 326, 1279
- (22) Hamuy, M., Walker, A. R., Suntzeff, N. B., Gigoux, P., Heathcote, S. R., & Phillips, M. M. 1992, PASP, 104, 533
- (23) Hamuy, M., Suntzeff, N. B., Heathcote, S. R., Walker, A. R., Gigoux, P., & Phillips, M. M. 1994, PASP, 106, 566
- (24) Hewitt, A., & Burbidge, G. 1991, ApJS, 75, 297
- (25) Hill, J. E., Burrows, D. N., Nousek, J. A., et al. 2004, Proc. SPIE, 5165, 21
- (26) Ho, L. C., Filippenko, A. V., & Sargent, W. L. W. 1993, ApJ, 417, 63
- (27) Ho, L. C., Filippenko, A. V., & Sargent, W. L. W. 1997, ApJS, 112, 315
- (28) Hoffman, J. L., Chornock, R., Leonard, D. C., & Filippenko, A. V. 2005, MNRAS, 363, 1241
- (29) Jones, D.H., Saunders, W., Colless, M., et al. 2004, MNRAS, 355, 747
- (30) Kennea, J. A., Markwardt, C. B., Tueller J., et al. 2005, ATel, 677
- (31) Maccacaro, T., Perola, G. C., & Elvis, M. 1982, ApJ, 257, 47
- (32) Maiolino, R., Marconi, A., Salvati, M., Risaliti, G., Severgnini, P., Oliva, E., La Franca, F., & Vanzi, L. 2001, A&A, 365, 28
- (33) Maiolino, R., & Rieke, G. H. 1995, ApJ, 454, 95
- (34) Malizia, A., Landi, R., Bassani, L., et al. 2007, ApJ, in press, [astro-ph/0706.2547]
- (35) Malizia, A., Bassani, L., Capalbi, M., Fabian, A. C., Fiore, F., & Nicastro, F. 2003, A&A, 406, 105
- (36) Marsh, T. R., Littlefair, S., & Dhillon, V. S. 2006, ATel, 760
- (37) Markwardt, C. B., Tueller, J., Skinner, G. K., Gehrels, N., Barthelmy, S. D., & Mushotzky, R. F. 2005, ApJ, 633, L77
- (38) Masetti, N., Palazzi, E., Bassani, L., Malizia, A., & Stephen, J. B. 2004, A&A, 426, L41
- (39) Masetti, N., Mason, E., Bassani, L., et al. 2006a, A&A, 448, 547
- (40) Masetti, N., Pretorius, M. L., Palazzi, E., et al. 2006b, A&A, 449, 1139
- (41) Masetti, N., Bassani, L., Bazzano, A., et al. 2006c, A&A, 455, 11
- (42) Masetti, N., Morelli, L., Palazzi, E., Stephen, J. B., Bazzano, A., Dean, A. J., Walter, R., & Minniti, D. 2006d, ATel, 783
- (43) Masetti, N., Bassani, L., Dean, A. J., Ubertini, P., & Walter, R. 2006e, ATel, 735
- (44) Mauch, T., Murphy, T., Buttery, H. J., Curran, J., Hunstead, R. W., Piestrzynski, B., Robertson, J. G., Sadler, E. M. 2003, MNRAS, 342, 1117
- (45) Mewe, R., Gronenschild, E. H. B. M., & van den Oord, G. H. J. 1985, A&AS, 62, 197
- (46) Monet, A. K. B., Levine, S. E., Monet, D. G., Bowell, E. L. G., Koehn, B., & Bryan, B. 1999, BAAS, 31, 1532
- (47) Morelli, L., Masetti, N., Bassani, L., Landi, R., Malizia, A., Bird, A. J., Ubertini, P., Galaz, G., 2006, ATel, 785
- (48) Moretti, A., Campana, S. Tagliaferri, G., et al. 2004, Proc. SPIE 5165, 232
- (49) Mulchaey, J. S., Koratkar, A., Ward, M. J., Wilson, A. S., Whittle, M., Antonucci, R. R. J., Kinney, A. L., & Hurt, T. 1994, ApJ, 436, 586
- (50) Nagao, T., Taniguchi, Y., & Murayama, T. 2000, AJ, 119, 2605
- (51) Ohashi T., et al. 1996, PASJ, 48, 157
- (52) Osterbrock, D. E. 1989, Astrophysics of Gaseous Nebulae and Active Galactic Nuclei (Mill Valley: Univ. Science Books)
- (53) Panessa, F., & Bassani, L. 2002, A&A, 394, 435
- (54) Pantoja, C. A., Altschuler, D. R.; Giovanardi, C., & Giovanelli, R. 1997, AJ, 113, 905
- (55) Patterson, J., Halpern, J., Mirabal, N., et al. 2006, ATel, 757
- (56) Piconcelli, E., Sànchez-Portal, M., Guainazzi, M., et al. 2006, A&A, 453, 839
- (57) Quadrelli, A., Malizia, A., Bassani, L., & Malaguti, G. 2003, A&A, 411, 77
- (58) Raymond, J. C., & Smith, B. W. 1977, ApJS, 35, 419
- (59) Revnivtsev, M. G., Sazonov, S. Yu., Jahoda, K., & Gilfanov, F. 2004, A&A, 418, 927
- (60) Revnivtsev, M. G., Sazonov, S., Churazov, E., & Trudolyubov, S. 2006, A&A, 448, L49
- (61) Risaliti, G. 2002, A&A, 386, 379
- (62) Risaliti, G., Maiolino, R., & Salvati, M. 1999, ApJ, 522, 157
- (63) Sanders, D. B., Mazzarella, J. M., Kim, D.-C., Surace, J. A., & Soifer, B. T. 2003, AJ, 126, 1607
- (64) Sazonov, S. Yu. & Revnivtsev, M. G. 2004, A&A, 423, 469
- (65) Schlegel, D. J., Finkbeiner, D. P., & Davis, M. 1998, ApJ, 500, 525
- (66) Schwope, A., Hasinger, G., Lehmann, I., et al. 2000, Astron. Nachr., 321, 1
- (67) Skrutskie, M. F., Cutri, R. M., Stiening, R., et al. 2006, AJ, 131, 1163
- (68) Smith, J. E., Robinson, A., Alexander, D. M., Young, S., Axon, D. J., & Corbett, E. A. 2004, MNRAS, 350, 140
- (69) Stone, R. P. S. 1977, ApJ, 218, 767
- (70) Thorstensen, J. R., Patterson, J., Halpern, J., & Mirabal, N. 2006, ATel, 767
- (71) Torres, M. A. P., Steeghs, D., Garcia, M. R., et al. 2006, ATel, 862
- (72) Tueller, J., Barthelmy, S., Burrows, D., et al. 2005, ATel, 669
- (73) Turner, T. J., George, I. M., Nandra, K., & Mushotzky, R. F. 1997, ApJ, 488, 164
- (74) Ueda, Y., Eguchi S., Terashima, Y., et al. 2007, [astro-ph/0706.1168]
- (75) Veilleux, S., & Osterbrock, D. E. 1987, ApJS, 63, 295
- (76) Voges, W., et al. 1999, A&A, 349, 389
- (77) Warner, B. 1995, Cataclysmic variable stars (Cambridge: Cambridge Univ. Press)
- (78) Weingartner, J. C., & Murray, N. 2002, ApJ, 580, 88
- (79) Wheatley, P. J., Marsh, T. R., & Clarkson, W. 2006, ATel, 765
- (80) White, R. L., Becker, R. H., Helfand, D. J., & Gregg, M. D. 1997, ApJ, 475, 479
- (81) Winkler, H. 1992, MNRAS, 257, 677
- (82) Winkler, H., & Payne, P. 1990, South African Astron. Obs. Circ., 14, 21
- (83) Zombeck, M. V. 1990, Handbook of Space Astronomy and Astrophysics
| Source | R.A. | Dec | Error | Obs date | Exposure | Energy band | Count rate |
| (J2000) | (J2000) | (arcsec) | (s) | (keV) | ( counts s-1) | ||
| Swift J0444.1+2813 | 04 44 09.23 | +28 12 58.62 | 3.53 | Aug 02, 2005 | 7206 | – | – |
| Swift J0444.1+2813 | Aug 04, 2005 | 4759 | – | – | |||
| Swift J0444.1+2813 | Aug 11, 2005 | 6637 | – | – | |||
| Swift J0444.1+2813 | Aug 20, 2005 | 12793 | 1.0–8.5 | ||||
| Swift J0444.1+2813 | Dec 05, 2005 | 29205 | 1.0–9.3 | ||||
| Swift J0444.1+2813 | Dec 06, 2005 | 24567 | 1.0–8.0 | ||||
| Swift J0444.1+2813 | Dec 07, 2005 | 24124 | 1.0–8.2 | ||||
| Swift J0601.9–8636 | 06 05 39.24 | –86 37 51.32 | 4.57 | Dec 14, 2005 | 10211 | 0.5–5.0 | |
| Swift J0601.9–8636 | Dec 18, 2005 | 2477 | – | – | |||
| Swift J0601.9–8636 | Dec 20, 2005 | 700 | – | – | |||
| Swift J0732.5–1331 | 07 32 37.70 | –13 31 06.18 | 4.74 | Jan 06, 2006 | 3445 | 0.5–6.4 | |
| Swift J0732.5–1331 | Jan 06, 2006 | 332 | – | – | |||
| Swift J0732.5–1331 | Apr 27, 2006 | 4044 | 0.5–6.4 | ||||
| Swift J0732.5–1331 | Oct 03, 2006 | 4763 | 0.5–6.4 | ||||
| Swift J0823.4–0457 | 08 23 00.93 | –04 56 04.01 | 4.17 | Jan 06, 2006 | 1239 | 2.0–6.0 | |
| Swift J0823.4–0457 | Oct 16, 2006 | 5362 | 2.0–6.0 | ||||
| Swift J0823.4–0457 | Oct 21, 2006 | 4763 | 2.0–6.0 | ||||
| Swift J0918.5+1618 | 09 18 25.95 | +16 18 20.05 | 3.56 | Jan 06, 2006 | 673 | – | – |
| Swift J0918.5+1618 | Jun 14, 2006 | 2258 | 0.7–6.4 | ||||
| Swift J0918.5+1618 | Sep 28, 2006 | 5602 | 0.7–6.5 | ||||
| Swift J0918.5+1618 | Jan 21, 2007 | 1750 | 0.7–7.0 | ||||
| Swift J1009.3–4250 | 10 09 48.12 | –42 48 42.60 | 4.00 | Jun 15, 2006 | 1809 | 0.5–6.5 | |
| Swift J1009.3–4250 | Jul 11, 2006 | 3877 | 0.5–7.5 | ||||
| Swift J1009.3–4250 | Jul 13, 2006 | 1964 | 0.5–7.5 | ||||
| Swift J1009.3–4250 | Jul 28, 2006 | 6180 | 0.2–7.5 | ||||
| Swift J1009.3–4250 | Jul 30, 2006 | 0.91 | – | – | |||
| Swift J1038.8–4942 | 10 38 44.87 | –49 46 52.73 | 3.56 | Oct 26, 2005 | 5225 | 1.0–7.5 | |
| Swift J1038.8–4942 | Nov 05, 2005 | 3852 | 1.0–7.0 | ||||
| Swift J1038.8–4942 | Dec 22, 2005 | 17112 | 1.0–8.0 | ||||
| Swift J1200.8+0650 | 12 00 57.74 | 06 48 21.04 | 3.64 | Dec 11, 2005 | 15055 | 2.0–7.5 | |
| Swift J1200.8+0650 | Dec 21, 2005 | 3287 | 1.5–6.0 | ||||
| Swift J1238.9–2720 | 12 38 54.58 | –27 18 27.45 | 3.83 | Jun 15, 2005 | 8610 | 1.5–7.5 | |
| Swift J1238.9–2720 | Aug 15, 2005 | 2385 | 2.0–7.5 | ||||
| Swift J1238.9–2720 | Aug 28, 2005 | 11527 | 2.0–8.0 | ||||
| Swift J1930.5+3414 | 19 30 13.70 | 34 10 52.74 | 4.15 | Dec 12, 2005 | 3792 | – | – |
| Swift J1930.5+3414 | Dec 15, 2005 | 7363 | 1.0–9.0 | ||||
| Swift J1930.5+3414 | Dec 21, 2005 | 1312 | – | – | |||
| Swift J1933.9+3258 | 19 33 47.15 | 32 54 25.33 | 3.54 | Jul 07, 2006 | 1552 | 0.5–6.5 | |
| Swift J1933.9+3258 | Oct 13, 2006 | 5861 | 0.5–7.0 | ||||
| Swift J1933.9+3258 | Oct 15, 2006 | 4372 | 0.5–7.0 | ||||
| XSS J12303–4232 | 12 32 12.09 | –42 17 50.37 | 3.53 | Sep 08, 2005 | 15171 | 0.2–7.5 | |
| XSS J12303–4232 | Sep 12, 2005 | 16333 | 0.2–7.5 | ||||
| Source | Fluxb | |||||
| (2–10 keV) | ||||||
| Swift J0601.9–8636 (# 1) | 0.111 | – | [1.8] | 3.8/3 | – | |
| Swift J0823.4–0457 (# 1) | 0.0515 | – | [1.8] | 0.1/2 | 25.2 | |
| Swift J0823.4–0457 (# 2) | 0.0515 | – | [1.8] | 4.1/4 | 24.6 | |
| Swift J0823.4–0457 (# 3) | 0.0515 | – | [1.8] | 2.4/4 | 33.1 | |
| Swift J0823.4–0457 (all) | 0.0515 | – | [1.8] | 7.8/13 | 29.7 | |
| Swift J0918.5+1618 (# 2) | 0.0344 | 0.3 | 1.80 | 31.4/34 | – | |
| Swift J0918.5+1618 (# 3) | 0.0344 | 0.21 | 1.87 | 38.0/39 | 0.18 | |
| Swift J0918.5+1618 (# 4) | 0.0344 | 0.12 | 1.92 | 22.2/26 | 0.1 | |
| Swift J0918.5+1618 (2+3+4) | 0.0344 | 0.13 | 1.89 | 98.2/97 | 0.10 | |
| Swift J1038.8–4942 (# 1) | 0.272 | 0.89 | 1.25 | 26.7/27 | 1.50 | |
| Swift J1038.8–4942 (# 2) | 0.272 | 0.59 | 1.41 | 8.3/14 | 1.20 | |
| Swift J1038.8–4942 (# 3) | 0.272 | 0.50 | 1.16 | 29.8/40 | 1.10 | |
| Swift J1038.8–4942 (all) | 0.272 | 0.50 | 1.21 | 91.0/106 | 1.28 | |
| Swift J1200.8+0650 (# 1) | 0.0144 | 6.50 | 1.26 | 27.7/24 | 8.08 | |
| Swift J1200.8+0650 (# 2) | 0.0144 | 7.94 | 1.87 | 11.8/11 | 7.65 | |
| Swift J1200.8+0650 (all) | 0.0144 | 6.61 | 1.31 | 40.0/37 | 8.30 | |
| Swift J1933.9+3258 (# 1) | 0.226 | 0.04 | 2.05 | 35.5/36 | 0.02 | |
| Swift J1933.9+3258 (# 2) | 0.226 | 0.01 | 2.05 | 75.8/81 | 0.01 | |
| Swift J1933.9+3258 (# 3) | 0.226 | 0.01 | 2.15 | 77.3/68 | 0.01 | |
| Swift J1933.9+3258 (all) | 0.226 | 0.04 | 2.08 | 192.8/186 | 0.02 |
Note. — a In units of cm-2;
b In units of erg cm-2 s-1;
c Assuming a photon index ;
.
| Source | Fluxb | |||||||||
| (keV) | (eV) | (keV) | (2–10 keV) | |||||||
| Swift J0444.1+2813 (# 4) | 0.196 | 4.76 | – | 1.32d | – | – | – | 48.5/49 | 6.37 | |
| Swift J0444.1+2813 (# 5) | 0.196 | 4.08 | – | 1.53d | – | – | – | 95.1/119 | 4.81 | |
| Swift J0444.1+2813 (# 6) | 0.196 | 4.31 | – | 1.42d | – | – | – | 97.6/113 | 5.40 | |
| Swift J0444.1+2813 (# 7) | 0.196 | 4.21 | – | 1.41d | – | – | – | 89.1/89 | 5.49 | |
| Swift J0444.1+2813 (all) | 0.196 | 4.25 | – | 1.46d | – | – | – | 341.4/376 | 5.35 | |
| Swift J0732.5–1331 (# 1) | – | 13.0 | 0.68 | – | – | – | 13.0 | 12.4/21 | – | |
| Swift J0732.5–1331 (# 3) | – | 5.1 | 0.61 | – | – | – | 9.8 | 32.2/24 | – | |
| Swift J0732.5–1331 (# 4) | – | 16.0 | 0.65 | – | – | – | 21.9 | 24.4/21 | – | |
| Swift J0732.5–1331 (all) | – | 11.6 | 0.63 | – | – | – | 15.4 | 73.7.72 | – | |
| Swift J1009.3–4250 (# 1) | 0.109 | – | – | [1.8]d | – | – | – | 2.8/4 | 21.7 | |
| Swift J1009.3–4250 (# 2) | 0.109 | – | – | [1.8]d | – | – | – | 12.5/16 | 14.3 | |
| Swift J1009.3–4250 (# 3) | 0.109 | – | – | [1.8]d | – | – | – | 3.8/5 | 45.7 | |
| Swift J1009.3–4250 (# 4) | 0.109 | 45.8 | – | 2.50d | – | – | – | 23.0/20 | 41.4 | |
| Swift J1009.3–4250 (all) | 0.109 | 39.8 | – | 2.32d | – | – | – | 48.7/44 | 36.2 | |
| Swift J1238.9–2720 (# 1) | 0.0668 | – | – | [1.8] | 6.48 | 528 | – | 18.6/13 | 41.2 | |
| Swift J1238.9–2720 (# 2) | 0.0668 | – | – | [1.8] | 6.46 | 632 | – | 6.8/9 | 81.0 | |
| Swift J1238.9–2720 (# 3) | 0.0668 | – | – | [1.8] | 6.36 | 432 | – | 14.6/19 | 48.5 | |
| Swift J1238.9–2720 (all) | 0.0668 | – | – | [1.8] | 6.40 | 508 | – | 46.5/42 | 46.3 | |
| Swift J1930.5+3414 (# 2) | 0.172 | – | – | [1.8]d | – | – | – | 10.4/17 | 28.5 | |
| XSS J12303–4232 (# 1) | 0.0726 | – | – | 1.69 | 6.38 | 331 | – | 98.8/109 | – | |
| XSS J12303–4232 (# 2) | 0.0726 | – | – | 1.80 | 6.51 | 360 | – | 99.8/108 | – | |
| XSS J12303–4232 (all) | 0.0726 | – | – | 1.76 | 6.42 | 343 | – | 208.0/219 | – |
Note. — a In units of cm-2;
b In units of erg cm-2 s-1;
c Assuming a photon index ;
d In this case the best-fit model requires a second power law component, having the same photon index of the primary absorbed power law, and passing only through the Galactic column density.
| Energy band | Count rate | Fluxb | |||||||
| (keV) | ( counts s-1) | (keV) | (eV) | (2–10 keV) | |||||
| 1.2–10.0 | 0.0344 | 193.7/191 |
Note. — a In units of cm-2;
b In units of erg cm-2 s-1.
| Source | Date | Telescope | Mid-exposure | Grism or | Slit | Exposure |
|---|---|---|---|---|---|---|
| time (UT) | grating | (arcsec) | time (s) | |||
| Swift J0444.1+2813 | 01 Feb 2006 | 1.5m Loiano | 18:07:00 | #4 | 2.0 | 2900 |
| Swift J0601.9–8636 | 22 Mar 2006 | 1.5m CTIO | 00:06:53 | #13/I | 1.5 | 900 |
| Swift J0732.5–1331 | 10 Feb 2006 | 1.5m Loiano | 21:43:16 | #4 | 2.0 | 21800 |
| Swift J0823.4–0457 | 09 Feb 2006 | 1.5m Loiano | 22:16:12 | #4 | 2.0 | 21800 |
| Swift J0918.5+1618 | 07 Feb 2006 | 1.5m Loiano | 22:42:45 | #4 | 2.0 | 21200 |
| Swift J1009.3–4250 | 25 Mar 2004 | 4m AAT | 11:25:22 | 580V | 6.7 | 1200 |
| Swift J1009.3–4250 | 25 Mar 2004 | 4m AAT | 12:29:07 | 425R | 6.7 | 600 |
| Swift J1038.8–4942 | 22 Mar 2006 | 1.5m CTIO | 02:24:02 | #13/I | 1.5 | 2600 |
| Swift J1200.8+0650 | 10 Feb 2006 | 1.5m Loiano | 01:25:50 | #4 | 2.0 | 21800 |
| Swift J1238.9–2720 | 23 Mar 2006 | 1.5m CTIO | 01:46:56 | #13/I | 1.5 | 21200 |
| Swift J1930.5+3414 | 05 Aug 2006 | 1.5m Loiano | 00:13:45 | #4 | 2.0 | 21800 |
| Swift J1933.9+3258 | 28 Jul 2006 | 1.5m Loiano | 01:08:14 | #4 | 2.0 | 2900 |
| XSS J12303–4232 | 04 Apr 2006 | 1.5m CTIO | 00:47:38 | #13/I | 1.5 | 2900 |
| Source | a | a | a | a | † | Type | ||||
|---|---|---|---|---|---|---|---|---|---|---|
| Broad | Narrow | |||||||||
| Swift J0444.1+2813 | – | 0.1 | 0.856 | 10 | 19–24 | Seyfert 2b | ||||
| Swift J0601.9–8636 | – | 0.041 | 0.5 | 0.140 | 8.1 | 0.5 | Seyfert 2b | |||
| Swift J0732.5–1331 | – | – | – | – | – | IP CVb,c | ||||
| Swift J0823.4–0457 | – | 0.046 | 2.4 | 134 | Seyfert 2b | |||||
| Swift J0918.5+1618 | * | * | 0.029 | – | 4.5 | Seyfert 1.2 | ||||
| Swift J1009.3–4250 | – | 0.167 | 1.1 | 163–179 | Seyfert 2 | |||||
| Swift J1038.8–4942 | * | * | 0.496 | – | 2–6 | Seyfert 1.5b | ||||
| Swift J1200.8+0650 | – | 0.25 | 0.017 | 1.6 | 30–37 | Seyfert 2b | ||||
| Swift J1238.9–2720 | – | 0.07 | 0.072 | 6.4 | 208 | Seyfert 2b | ||||
| Swift J1930.5+3414 | * | * | 0.187 | – | 128 | Seyfert 1.5–1.8 | ||||
| Swift J1933.9+3258 | * | 262 | * | 0.271 | – | 0.1 | Seyfert 1.2 | |||
| XSS J12303–4232 | * | * | 0.104 | – | – | Seyfert 1.5b | ||||
Note. — a In units of erg cm-2 s-1;
b This source has been classified in this work for the first time;
c IP CV (Intermediate Polar (magnetic) Cataclysmic Variable;
d Sum of the fluxes of broad and narrow components;
∗ In this case [N ii] and Hα are heavily blended;
† This value has been obtained using the conversion (Zombeck 1990)
| Source | / | / | / | / | ||
|---|---|---|---|---|---|---|
| (10–100 keV) | ||||||
| Swift J0444.1+2813 | 6.91 | 8.3 | 0.008 | 0.13 | 16.9 | 0.16 |
| Swift J0601.9–8636 | 3.71 | 42.90 | – | 0.00012 | – | 0.001 |
| Swift J0823.4–0457c | 2.72 | 7.17 | 17.5 | 0.06 | 0.0033 | 0.16 |
| Swift J0918.5+1618 | 2.71 | 8.16 | 109 | 0.096 | 0.0009 | 0.29 |
| Swift J1009.3–4250 | 2.53 | – | 7.4 | – | – | 0.08 |
| Swift J1038.8–4942 | 3.41 | – | 83.8 | – | – | 0.27 |
| Swift J1200.8+0650 | 2.61 | 3.6 | 200 | 0.16 | 0.0008 | 0.22 |
| Swift J1238.9–2720 | 12.41 | 5.7 | 0.39 | 0.08 | 0.21 | 0.04 |
| Swift J1930.5+3414 | 2.51 | 6.5 | 5.5 | 0.028 | 0.0051 | 0.07 |
| Swift J1933.9+3258 | 2.74 | 6.4 | 30.4 | 0.12 | 0.0041 | 0.29 |
| XSS J12303–4232† | 0.61 | 4.2 | 24.0 | 0.11 | 0.0047 | 0.89 |
Note. — a References: (1) BAT AGN catalog (available at http://www.astro.umd.edu/ lwinter/research/AGN.html); (2) Aiello et al. 2006a; (3) Ajello et al. 2006b; (4) Grupe et al. 2006;
b In units of erg cm-2 s-1;
c Assuming that IRAS 08205–0446 is associated with Fairall 272;
† For this source we consider the RXTE 8–20 keV flux.