VLA H53 observations of the central region of the Super Star Cluster Galaxy NGC 5253
Abstract
We present observations in the H53 line and radio continuum at 43 GHz carried out with the VLA in the D array ( angular resolution) toward the starburst galaxy NGC 5253. VLA archival data have been reprocessed to produce a uniform set of 2, 1.3 and 0.7 cm high angular () radio continuum images. The RRL H53, a previously reported measurement of the H92 RRL flux density and the reprocessed high angular resolution radio continuum flux densities have been modeled using a collection of HII regions. Based on the models, the ionized gas in the nuclear source has an electron density of cm-3 and an volume filling factor of 0.05. A Lyman continuum photon production rate of s-1 is necessary to sustain the ionization in the nuclear region. The number of required O7 stars in the central 1.5 pc of the supernebula is . The H53 velocity gradient (10 km s-1 arcsec-1) implies a dynamical mass of M⊙; this mass suggests the supernebula is confined by gravity.
1 INTRODUCTION
NGC 5253 is a blue dwarf irregular galaxy (located at Mpc; Saha et al. 1995) with an infrared luminosity of L⊙ (Beck et al. 1996). NGC 5253 hosts several groups of young star clusters, called super star clusters (SSC) (Gorjian 1996; Calzetti et al. 1997). The optical spectrum of NGC 5253 shows signatures of large numbers of Wolf-Rayet (WR) stars (Campbell, Terlevich & Melnick et al. 1986; Walsh & Roy 1989; Schaerer et al. 1997). A nearly flat radio continuum spectra (see Fig. 1) also indicates that free-free emission is the dominant emission mechanism and that NGC 5253 is a young starburst galaxy.
The VLA observations made with similar angular resolution () at 6, 3.6 and 2 cm (Beck et al. 1996 and Turner, Ho & Beck 1998) reveal a complex structure in the central region, dominated by a compact source (; pc). VLA observations of NGC 5253, made with higher angular resolution at 1.3 () and 2 cm () reveal two compact sources. The main source has a deconvolved angular size of which corresponds to pc (Turner, Beck & Ho 2000). NICMOS observations show the presence of a double cluster in the nucleus of the galaxy separated by pc () (Alonso-Herrero et al., 2004) which may be related with the double radio nebula detected by Turner, Beck & Ho (2000). Higher angular resolution observations at 0.7 cm ( mas) show that the stronger component of the double nebula is compact, but partially resolved at scales of (Turner & Beck 2004). The main compact radio source (Turner, Ho & Beck 1998) was named “the supernebula”. Beirao et al. (2006), based on mid-IR SPITZER observations from NGC 5253, report that mid-IR emission is dominated by an unresolved cluster, coincident with the compact supernebula. Beirao et al. (2006) also observed an anticorrelation between PAH strength and UV radiation, suggesting destruction of PAH molecules in the central region.
Based on 1.3 and 2 cm wavelength observations, Turner, Ho & Beck (2000) propose that the dominant radio source is a strong candidate for a globular cluster in the process of formation. The supernebula is visible at radio and infrared frequencies with no obvious optical counterpart. This supernebula is partially optically thick at 2 cm with an electron density of cm-3 (Meier et al. 2002), typical of compact young ( yr) HII regions in our galaxy (Wood & Churchwell 1989). Radio and infrared observations require a Lyman continuum flux of s-1, equivalent to a few thousand O7 stars (Gorjian et al. 2001). The radio recombination line H92 has been observed toward the supernebula and has been interpreted as arising from gas around a SSC (Mohan et al. 2001). Infrared Bracket and recombination line observations revealed that the gas in the nebula is potentially bound by gravity (Turner et al. 2003). Based on 0.7 cm wavelength observations, Turner & Beck (2004) confirm that the supernebula is a giant compact HII region that is gravitationally bound. In order to reproduce the radio continuum emission, the nebula requires the excitation of O7 stars within the central 5 pc region (Turner, Beck & Ho 2000).
In this paper we present observations of the RRL H53 toward NGC 5253 using the VLA. The H53 RRL provides information of the physical properties of the optically thin ionized gas in the supernebula. In Section 2 the technical details of the observations are presented. In Section 3 we present the results, while in Section 4 we provide the discussion. In Section 5 we present the summary.
2 VLA Observations.
2.1 H53 line.
The H53 line (42951.9 MHz) was observed in the D configuration of the VLA on 2004, May 31 and June 02, 11, 12, and 13. We used observation cycles with integration times of 10 min on NGC 5253 and 1 min on the phase calibrator J1316-336 ( Jy displaced by ). Two frequency windows (LOs) were used to observe the RRL H53, centered at 42885.1 and 42914.9 GHz. For each frequency window, the on-source integration time was hrs, using the mode of 15 spectral channels with a channel separation of 3.125 MHz ( km s-1). The data calibration was carried out for each frequency window using the continuum channel, consisting of the central 75% of the band. The flux density scales were determined from observations of J1331+305 (3C286; 1.47 Jy). The bandpass response of the instrument was corrected using observations of J1337-129 ( Jy). The parameters of the observations are summarized in Table 1. The coordinates listed in this Table 1 corresponds to the center of the observations. In order to track reliably the phase variations introduced by the troposphere, the calibration of the data was performed correcting for the phases in a first step and subsequently correcting for both amplitude and phase. The line data cubes were Hanning-smoothed to reduce the Gibbs effect and the final velocity resolution is km s-1. The line data were further calibrated using the solutions obtained by self-calibrating the continuum channel of each frequency window. The radio continuum images were obtained by combining the continuum channels of each frequency window using the task DBCON from AIPS, and the self-calibration method was also applied to this combined data. The continuum emission was subtracted for each frequency window using the AIPS task UVLSF with a zero order polynomial fit based on the line free channels. The H53 line cubes and the 43 GHz continuum image were made using a natural weighting scheme and then convolved to obtain a circular Gaussian beam of (P.A.). The combination of the different frequency windows was carried out following a similar method to that used for the H53 line observed toward M82 (Rodríguez-Rico et al., 2004); the two line cubes were combined into a single line cube after regridding in frequency the line data for each frequency window. This process was carried out using the GIPSY reduction package and a total of 19 velocity channels were obtained after putting together the two LO windows. The total line bandwidth, after combining all the windows, is about 60 MHz (400 km s-1).
2.2 Radio continuum at 2 cm, 1.3 cm and 0.7 cm
In addition to the continuum emission at 0.7 cm, obtained from the line-free channels of the H53 line observations (at angular resolution of ), we have included archive continuum data in the analysis. VLA continuum observations at 2, 1.3 and 0.7 cm made with higher angular resolution () toward NGC 5253 have been reprocessed from the VLA archive and used here to determine the properties of the continuum of the nuclear regions of NGC 5253 over angular scales less than . The observations at 2 and 1.3 cm were made with the A configuration of the VLA on 1998 April 9 (Turner, Beck & Ho 2000). The observations at 0.7 cm were made with the VLA in the A configuration including Pie Town on 2002 March 9 (Turner & Beck 2004). The phase calibrator for the 0.7 cm is J1316-336 (J2000). Absolute flux density calibration for all the 2 cm, 1.3 cm and 0.7 cm observations was based on observations of 3C286. The data at the three frequencies was brought to the same angular resolution by suitable choices of both weighting in the uv plane and uv range selection. The final angular resolution of all three images is (P.A.).
3 RESULTS
Figure 1 shows spectrum made with the low angular resolution ( 2”) observations summarized in Table 2. These low angular resolution observations refer to the whole of the nucleus of NGC 5253. This spectrum is nearly flat in the frequency range 1-230 GHz. As noted before by Meier et al. (2002), a single component that consists of optically thin free-free extended emission (S ) does not explain the observed flux densities at frequencies GHz. An optically thick free-free component with an electron density of cm-3 is necessary to explain the observed flux densities in the frequency range of GHz; this optically thick free-free component has a turnover frequency at GHz. The electron density value of the compact ionized gas component was obtained based on high angular resolution radio observations and the fit is described in Section 4.2. There are at least three non-thermal components with angular sizes between and , which only contribute about 2 mJy at 6 cm and 1 mJy at 2 cm (see Turner, Ho & Beck 1998) . Turner, Ho & Beck (1998) report three non-thermal sources based on observations at 2 and 6 cm, located near (east, southeast and northwest) the central super star cluster. Thus, a third non-thermal (S ) component with S mJy has also been used in the fit of the total continuum emission shown in Figure 1. The flux density level of the extended optically-thin component is fit to the flux density values obtained from subtraction of the optically thick free-free and the synchrotron emission from the observed total flux densities.
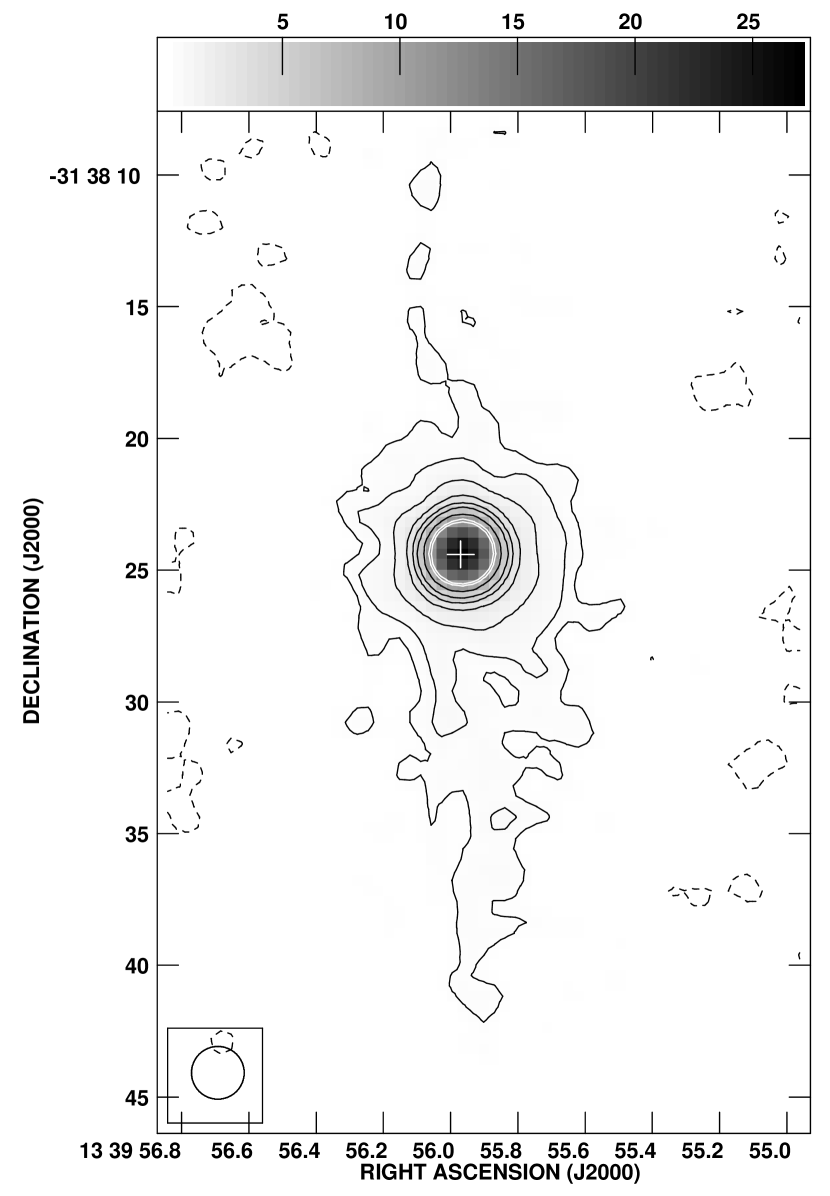
Figure 2 shows the 43 GHz radio continuum observations carried out in the D-array of the VLA (at angular resolution). The integrated 43 GHz continuum flux density measured at this angular resolution is mJy. The radio continuum emission at 43 GHz extends in the N-S direction and in the E-W direction. The extended emission along the N-S direction agrees with previous observations at 6, 3.6 and 2 cm (Turner, Ho & Beck, 1998). The central region dominates the continuum emission and has a deconvolved angular size of at 43 GHz. The position of the 43 GHz continuum peak ( mJy beam-1) is , , in agreement with previous observations at 2 and 1.3 cm (Turner, Beck & Ho, 2000). The position of the 43 GHz continuum emission peak is coincident with the position of the source labeled “source A” by Turner, Ho & Beck (1998).
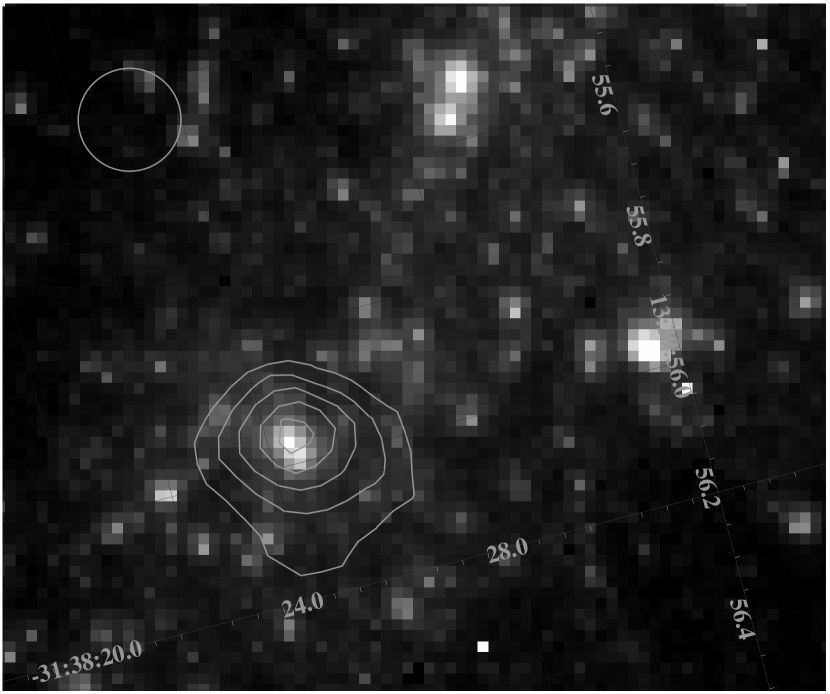
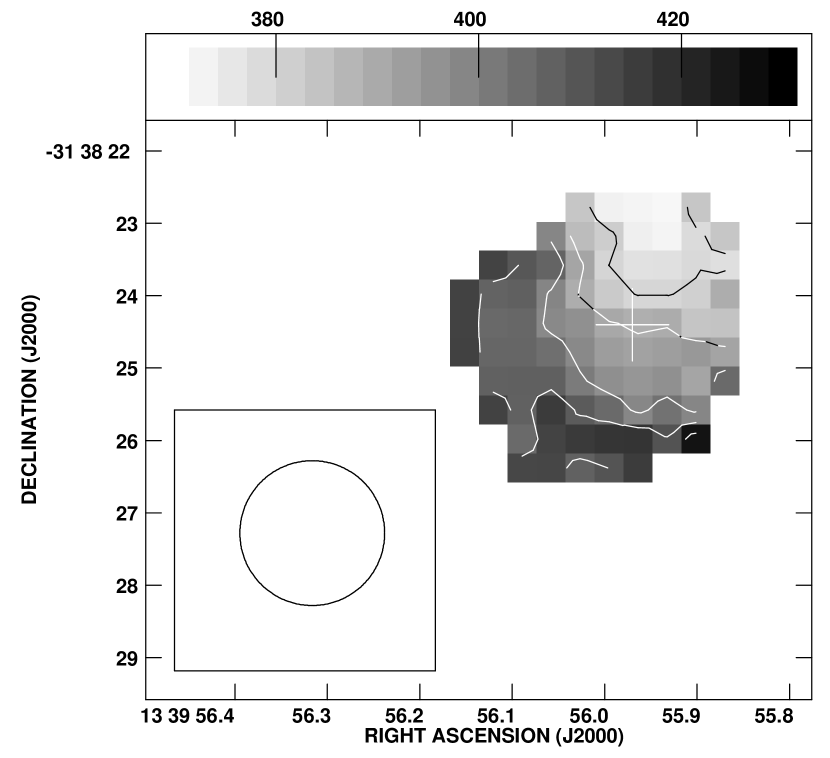
Figure 3 shows the H53 line velocity-channel images of NGC 5253 at an angular resolution of . The H53 line emission is observed in the heliocentric velocity range to 450 km s-1. The peak H53 line flux density is mJy beam-1. The deconvolved angular size measured in the H53 line is . We have obtained the m NICMOS image from the HST archive in order to compare the H53 RRL with the IR emission; the plate scale of the NICMOS observations is . Following Turner et al. (2003) we have assumed that the brightest source in the m NICMOS can be identified with the radio peak as observed at an angular resolution of . We thus have shifted the NICMOS image by in the NE direction in order that the IR and radio peaks coincide, consistent with the astrometrical precision of HST. Figure 4 shows the overlay of the integrated H53 line emission on the m after shifting the IR image. The integrated H53 line ( Jy km s-1), as obtained from a gaussian fit, has a peak line flux density mJy, a FWHM of km s-1 and a central heliocentric velocity of km s-1. The velocity integrated H53 line emission is shown in Figure 5.
4 DISCUSSION
4.1 Total radio continuum emission
The spatially integrated radio continuum flux density obtained with low angular resolution, mJy is comparable with previous measurements from interferometric observations carried out in the wavelength range of 21 to 0.13 cm ( GHz). Previous observations have revealed that the radio continuum emission at 43 GHz is dominated by thermal free-free emission (Beck et al. 1996) and our 43 GHz radio continuum observations suggest that the contribution from non-thermal emission is negligible at wavelengths shorter than 6 cm ( GHz, see Figure 1). Thus, no contribution from synchrotron sources will be considered in the radio continuum emission models (see Section 4.2).
4.2 Models of a collection of HII region
Models that consist of HII regions have been used to estimate the electron density of the ionized gas in starburst galaxies like M82 (Rodríguez-Rico et al. 2004), NGC 253 (Rodríguez-Rico et al. 2006) and Arp 220 (Anantharamaiah et al. 2000; Rodríguez-Rico et al. 2005). The models are constrained by: 1) the physical diameter of the region associated with the RRLs emission and 2) the measured radio continuum and RRL flux densities. The RRLs H92 (Mohan et al. 2001) and H53 are used, along with the high-angular resolution radio continuum observations described in Section 2.2, to estimate the electron density of the ionized gas in NGC 5253.
Based on the high angular resolution VLA archival observations (), described in Section 2.2 the deconvolved angular size of the compact nuclear region is ( pc). The peak position measured in these high angular resolution radio continuum images agrees with the peak position of the RRLs H53 and H92 (Mohan et al. 2002). Thus, it is assumed that the H53 and the H92 RRLs arise from the same pc () region. The radio continuum flux densities, at angular resolution, are S mJy, S mJy and S mJy. The velocity integrated H53 and H92 line emission are 50 mJy km s-1 and 203 mJy km s-1, respectively. Acceptable models are those that can reproduce the continuum flux densities and the velocity integrated line emission on both RRLs. Based on the size measured in the radio continuum images, the maximum volume that this collection of HII regions may occupy is the volume of a spherical 1.5 pc region.
Following the procedure listed in Rohlfs et al. 1996, we use models that consist of HII regions ionized by O7 early-type stars ( Lyman continuum photons s-1). The emission measure of each HII region is . The continuum optical depth is (Altenhoff et al. 1960)
| (1) |
and the black body radiation is defined by
| (2) |
The electron temperature of the thermally ionized gas is assumed to be T K and is the frequency. The radio continuum flux density (Scth) for each HII region in the models is given by:
| (3) |
where is the solid angle subtended by the HII region.
The models for RRL emission take into account deviations from local thermodynamic equilibrium (LTE) using the departure coefficients and . The peak line flux density is:
| (4) |
where is the line optical depth in LTE and ) is the non LTE line optical depth. The line-to-continuum ratio defined by:
| (5) |
In this equation the line width is and is the emission measure of the line, assuming a fractional number abundance of He+ to H of 0.1.
The electron density of the ionized gas in these models was varied between cm-3. Figure 6 shows the results from single-density models that fit the radio continuum and RRL observations for NGC 5253. The solution for the electron density obtained from the models is cm-3. This electron density is comparable to the derived value of cm-3 (Turner, Beck & Ho 2000 and Meier et al. 2002). The total volume filling factor of the dense ionized gas is and the total area filling factor is . Based on the results of the single density models, the Lyman continuum needed to ionize the 1.5 pc region is s-1, corresponding to O7 stars. The total mass of O7 stars, assuming 20 M⊙ for each O7 star (Herrero et al. 1992), is about M⊙.
Comparison of the velocity integrated H53 line emission and NICMOS images at 1.6 m (Figure 4) suggests that the radio supernebula has a close counterpart in infrared. Previous observations revealed the radio supernebula is associated with the brightest Brackett line source in NGC 5253 (Turner et al. 2003). The dust extinction in the infrared at 1.6 m is evident (Figure 4) as the NICMOS image reveals a very compact emission toward the supernebula compared to the radio image in H53 integrated line emission. Based on the velocity field, a velocity gradient of km s-1 arcsec-1 is observed, suggesting an apparent rotation of the ionized gas in the supernebula; the nearly parallel isovelocity contours suggest rotation in the supernebula (see Figure 7). The dynamical mass M in the supernebula, with physical size of pc, is M⊙. This mass is comparable to the mass estimated for the nebula to be in virial equilibrium ( M⊙, Turner & Beck 2004). Turner & Beck (2004), based on the H92 and the Br line FWHM ( km s-1), concluded that the supernebula is gravity bounded. The mass implied by the velocity gradient is consistent with the luminosity implied by starburst models with this NLyc (Leitherer et al. 1999). The H53 line FWHM of km s-1 confirms that the supernebula is gravity bounded. The difference in the line widths is interpreted as contribution of the extended ionized gas component to the Br and H92 lines compared to the H53 line that traces mostly the compact ionized gas component.
5 CONCLUSIONS
The H53 line and the radio continuum emission at 43 GHz were observed with the VLA in the D array toward the galaxy NGC 5253. VLA archival data have been reprocessed to produce a uniform set of 2, 1.3 and 0.7 cm continuum images with angular resolution of . Using a single density model to reproduce the observed radio continuum at 2, 1.3 and 0.7 cm as well as the H53 and H92 RRL emission in the central compact region ( pc), the average electron density of the ionized gas is cm-3. The 43 GHz radio continuum emission arise from an optically thin free-free emission source. The Lyman continuum photons rate of s-1 is necessary to sustain the ionization in the 1.5 pc in the inner region of the galaxy NGC 5253, corresponding to O7 stars. The peak of the H53 line emission coincides with the brightest source observed in the 1.6m IR image within . The velocity gradient measured in the H53 line (10 km s-1 arcsec-1), if interpreted as rotation, implies a dynamical mass of M⊙ within the central 20 pc. The rough agreement of the mass derived from the apparent rotation with the mass estimated from the observed Lyman continuum rate, NLyc, suggests that the gas motion within the supernebula is governed by gravity.
The National Radio Astronomy Observatory is a facility of the National Science Foundation operated under cooperative agreement by Associated Universities, Inc. CR and YG acknowledge support from UNAM and CONACyT, México.
References
- Alonso-Herrero et al. (2004) Alonso-Herrero, A., Takagi, T., Baker, A. J., Rieke, G. H., Rieke, M. J., Imanishi, M., Scoville, N. Z., 2004, ApJ, 612, 222
- Altenhoff et al. (1960) Altenhoff, W., Mezger, P. G., Wendker, H., and Westerhout, G., 1960, Veroff. Sternwarte, Bonn, No. 59, 48
- Anantharamaiah et al. (2000) Anantharamaiah, K. R., Viallefond, F., Mohan, Niruj R., Goss, W. M., Zhao, J. H., ApJ, 537, 613
- Beck et al. (1996) Beck, S. C., Turner, J. L., Ho, P. T. P., Lacy, J. H., & Kelly, D., 1996, ApJ, 457, 610
- Campbell, Terlevich & Melnick (1986) Campbell, A., Terlevich, R., Melnick, J., 1986, MNRAS, 223, 811
- Gorjian, Turner, & Beck (2001) Gorjian, V., Turner, J. L., & Beck, S. C., 2001, ApJ, 554, L29
- Herrero et al. (1992) Herrero et al., 1992, A&A, 261, 209
- Meier, Turner, & beck (2002) Meier, D., Turner J. L., & Beck, S., 2002, AJ, 124, 877
- Mohan, Anantharamaiah, & Goss (2001) Mohan, N., Anantharamaiah, K. R., & Goss, W. M., 2001, ApJ, 557, 659
- Rohlfs (1986) Rohlfs, K., 1986, Tools of Radio Astronomy, ed. Springer-Verlag, 248-249
- Rodríguez-Rico et al. (2004) Rodríguez-Rico, C. A., Viallefond, F., Goss, W.M., Zhao, J.-H., & Anantharamaiah, K. R., 2004, ApJ, 616, 783
- Rodríguez-Rico et al. (2005) Rodríguez-Rico, C. A., Goss, W. M., Viallefond, F., Zhao, J.-H., Gómez, Y., & Anantharamaiah, K. R., 2005, ApJ, 633, 198
- Rodríguez-Rico et al. (2006) Rodríguez-Rico, C. A., Goss, W. M., Zhao, J.-H., Gómez, Y., & Anantharamaiah, K. R., 2006, ApJ, 644, 914
- Saha et al. (1995) Saha, A., Sandage, A., Labhardt, L., Schwengeler, H., Tammann, G. A., Panagia, N., & Macchetto, F. D., 1995, ApJ, 438, 8
- Schaerer et al. (1997) Schaerer, D., Contini, T., Kunth, D., & Meynet, G., 1997, ApJ, 481, 75
- Turner, Beck & Hurt (1997) Turner, J. L., Beck, S. C., & Hurt, R., 1997, ApJ, 474, L11
- Turner, Ho & Beck (1998) Turner, J. L., Ho, P. T. P., & Beck, S. C., 1998, AJ, 116, 1212
- Turner, Beck & Ho (2000) Turner, J. L., Beck, S. C., & Ho, P. T. P., 2000, ApJL, 532, 109
- Turner et al. (2003) Turner, J. L., Beck, S. C., Crosthwaite, L. P., Larkin, J. E., McLean, I. S., & Meier, D. S., 2003, Nature, 423, 621
- Turner & Beck (2004) Turner, J. L., & Beck, S. C., 2004, ApJL, 602, 85
- Walsh & Roy (1989) Walsh, J. R., Roy, J.-R., 1989, MNRAS, 239 297
- Wood & Churchwell (1989) Wood, D. O. S., Churchwell, E., 1989, ApJS, 69, 831
| Parameter | H53 RRL (43 GHz) |
|---|---|
| Right ascension (J2000) | 13h39m96 |
| Declination (J2000) | |
| Angular resolution continuum & line | , P.A. |
| On-source observing duration (hr) | 8 |
| Bandwidth (MHz) | 60 |
| Total number of spectral channels | 19 |
| Optical Heliocentric Velocity VHel (km s-1) | 397 |
| Velocity coverage (km s-1) | 400 |
| Velocity resolution (km s-1) | 44 |
| Amplitude calibrator | J1331+305 |
| Phase calibrator | J1316336 |
| Bandpass calibrator | J1337129 |
| RMS line noise per channel (mJy/beam) | 0.4 |
| RMS, continuum (mJy/beam) | 0.2 |
| Wavelength | Flux density | Angular resolution | Reference |
|---|---|---|---|
| (cm) | (mJy) | ||
| 20 | aaValues obtained by integrating over the central region and used to obtain the total radio continuum spectrum (Figure 1). All values were obtained from the literature except the value at 0.7 cm. | 1 | |
| 6 | aaValues obtained by integrating over the central region and used to obtain the total radio continuum spectrum (Figure 1). All values were obtained from the literature except the value at 0.7 cm. | 1 | |
| 3.6 | aaValues obtained by integrating over the central region and used to obtain the total radio continuum spectrum (Figure 1). All values were obtained from the literature except the value at 0.7 cm. | 2 | |
| 2 | aaValues obtained by integrating over the central region and used to obtain the total radio continuum spectrum (Figure 1). All values were obtained from the literature except the value at 0.7 cm. | 1 | |
| bbValues were obtained from the reprocessed VLA data (see Section 2.2) integrating over the inner . These values were used in the models of a collection of HII regions (Figure 6). | 3 | ||
| 1.3 | bbValues were obtained from the reprocessed VLA data (see Section 2.2) integrating over the inner . These values were used in the models of a collection of HII regions (Figure 6). | 3 | |
| 0.7 | aaValues obtained by integrating over the central region and used to obtain the total radio continuum spectrum (Figure 1). All values were obtained from the literature except the value at 0.7 cm. | 3 | |
| bbValues were obtained from the reprocessed VLA data (see Section 2.2) integrating over the inner . These values were used in the models of a collection of HII regions (Figure 6). | 3 | ||
| 0.31 | aaValues obtained by integrating over the central region and used to obtain the total radio continuum spectrum (Figure 1). All values were obtained from the literature except the value at 0.7 cm. | 5 | |
| 0.26 | aaValues obtained by integrating over the central region and used to obtain the total radio continuum spectrum (Figure 1). All values were obtained from the literature except the value at 0.7 cm. | 4 | |
| 0.13 | aaValues obtained by integrating over the central region and used to obtain the total radio continuum spectrum (Figure 1). All values were obtained from the literature except the value at 0.7 cm. | 5 |
References. — (1) Turner, Ho & Beck (1998), (2) Mohan, Anantharamaiah & Goss (2001),(3) This paper, (4) Turner, Beck, & Hurt (1997), (5) Meier, Turner & Beck (2002).