Self-similar shear-thickening behavior in CTAB/NaSal surfactant solutions
Abstract
The effect of salt concentration on the critical shear rate required for the onset of shear thickening and apparent relaxation time of the shear-thickened phase, has been investigated systematically for dilute CTAB/NaSal solutions. Experimental data suggest a self-similar behavior of and as functions of . Specifically, whereas such that an effective Weissenberg number We for the onset of the shear thickened phase is only weakly dependent on . A procedure has been developed to collapse the apparent shear viscosity versus shear rate data obtained for various values of into a single master curve. The effect of on the elastic modulus and mesh size of the shear-induced gel phase for different surfactant concentrations is discussed. Experiments performed using different flow cells (Couette and cone-and-plate) show that , and the maximum viscosity attained are geometry-independent. The elastic modulus of the gel phase inferred indirectly by employing simplified hydrodynamic instability analysis of a sheared gel-fluid interface is in qualitative agreement with that predicted for an entangled phase of living polymers. A qualitative mechanism that combines the effect of on average micelle length and Debye parameter with shear-induced configurational changes of rod-like micelles is proposed to rationalize the self-similarity of SIS formation.
Mukund Vasudevan
Department of Energy, Environmental and Chemical Engineering, Washington University in St.Louis, St.Louis MO 63130
Amy Shen
Department of Mechanical, Aerospace and Structural Engineering, Washington University in St.Louis, St.Louis MO 63130
Bamin Khomami
Department of Chemical and Biomolecular Engineering, University of Tennessee, Knoxville, TN 37919
Radhakrishna Sureshkumar111Electronic mail: suresh@wustl.edu
Center for Materials Innovation, and Department of Energy, Environmental and Chemical Engineering, Washington University in St.Louis, St.Louis MO 63130
1 INTRODUCTION
Surfactant solutions exhibit complex behavior even at equilibrium. Above a critical micelle concentration, several tens of surfactant molecules aggregate to form micelles since the formation of micelles is entropically favorable as compared to a system of unassociated surfactant molecules in solution [Hamley (2000)]. Micelles could exist in various shapes such as cylindrical, spherical or lamellar depending on the temperature and surfactant concentration in solution [Hamley (2000), Tsujii (1998), Tardos (1984), Zana (1987), Russell et al. (1989), and Shen et al. (2007)]. The equilibrium phase behavior, however, could be qualitatively influenced by flow. Understanding the relationships between flow, phase behavior, and rheology is central to numerous applications. Examples include (wormlike) micelles-induced turbulent drag reduction, drug delivery, alveolar function, synthesis of nanoporous materials (e.g. sol gel process), enhanced oil recovery and solar energy storage [Tardos (1984), Zana (1987), Russell et al. (1989), Tsujii (1998), Hamley (2000), Arora et al. (2002), and Shen et al. (2007)].
Rheological behavior of surfactant solutions is very sensitive to the concentrations of the surfactant and counter-ion, temperature, and the presence of added salts. Relatively small changes in these parameters can alter micelle shape/size and, in-turn, the rheology. Since micelles of ionic surfactants are charged, addition of counter-ions decreases the Debye screening length , thereby reducing the intermicellar repulsive forces and favoring the formation of larger micelles. While spherical shapes are known to be preferred for small surfactant concentration (), cylindrical and lamellar shaped structures are generally observed as is increased [Cates and Candau (1990)]. At sufficiently large values and/or under flow, wormlike micelles that behave similar to flexible polymers can be formed [Hamley (2000), Cates and Candau (1990)]. The contour length of such micelles could be as large as several microns [Clausen et al. (1992), Lin et al. (1992, 1994, 2001)]. The length of such micelles depends on the energy required to form the two chain ends that is typically 5-25 [Cates (1996)], which is also referred to as the scission energy . If 25 , very long micelles are formed that could entangle with one another even at relatively low volume fractions [Cates and Candau (1990), Oelschlaeger et al. (2002)]. Such entangled phases could exhibit gel-like characteristics [Rehage and Hoffmann (1991), Nowak (1998), Shikata et al. (2002)]. Under shear, the scission energy could be overcome and the end caps could be broken, resulting in micelles with residual charges. Moreover, wormlike micelles in shear flow can undergo stretching-tumbling cycles. In a stretched (extended) state, the probability of inter-micellar interactions is enhanced compared to that in the coiled (equilibrium) state. Hence, under flow, micelles with residual charges can combine to form longer micelles or networks [Cressely and Hartmann (1998a)]. This effect is more pronounced for micelles with length larger than the persistence length , which behave like flexible polymers [Cates and Candau (1990)].
The pioneering work by Cates and Candau (1990) allowed for a quantitative description of the rheological behavior of wormlike micellar solutions. A vast majority of wormlike micelles in dilute solutions exhibit linear viscoelastic behavior such as the one predicted by the linear Maxwell model with a single relaxation time [Rehage and Hoffmann (1991); Kim and Yang (2000); Shikata et al. (2002)] or nonlinear shear-thinning behavior similar to a Giesekus fluid [Shikata and co-workers (1987a, 1987b, 1988)]. However, under certain salt to surfactant concentration ratios, they exhibit shear thickening behavior, i.e. an increase in the apparent viscosity of the solution with increasing shear rates [Hu and Mathys (1995); Cressely and co-workers (1994, 1997a, 1997b, 1997c, 1998a, 1998b, 2000); Wheeler et al. (1998); Nowak (2001)]. In a series of experiments, Cressely and co-workers (1994, 1997a, 1997b, 1997c, 1998a, 1998b, 2000) studied the effect of counter-ion concentration , surfactant concentration , different added salts, and temperature on the rheology of the salt-surfactant system. They reported that the rheological behavior differs dramatically for different types of salts. In the range of surfactant [Cetyl-trimethylammonium bromide (CTAB)] concentrations they studied, shear thickening behavior was observed with addition of counter-ions such as Sodium Salicylate (NaSal) and Sodium Tosylate (NaTOs). However, shear thickening behavior was not observed while adding Sodium Benzoate (NaBz), even though the three salts were chemically similar except for their polar head groups. This behavior was attributed to the differences in the strength of the counter-ion - surfactant bond as well as the placement of the counter-ions on the surfactant [Hartmann and Cressely (1998b)]. Cates and Candau (1990) have noted that scission energy is strongly dependent on the type of counter-ion, which in turn would control the length of the micelles formed and hence the solution rheology. Goyal and co-workers (1989, 1991, 1992) studied the effect of Pottasium Bromide (KBr) as well as NaSal on the zero-shear viscosity () of CTAB solutions. Both these salts produced a large change in , however, for isoviscous micellar solutions of CTAB/KBr and CTAB/NaSal, KBr micelles were found to be longer than NaSal micelles. They attributed this behavior to the Sal- ions being absorbed on the surface of micelle as a cosurfactant, unlike Br- ions, which remained in the bulk of the solution.
The rheological behavior for various values was investigated by Cressely and Hartmann (1998a) with the CTAB/NaSal system. They fixed = 0.019M and changed (0.045M 0.3M), and observed that initially decreased nonlinearly from 0.9 Pa.s ( = 0.045M) and plateaued at 0.004 Pa.s (∗ 0.15M). Further increase in resulted in a gradual increase in to 0.05 Pa.s ( = 0.3M). Thus, for a given , an increase in by a factor of seven resulted in two orders of magnitude variation in . Lin et al. (2001) suggested that the initial decrease in was possibly due to either the formation of micellar branches (which increased the fluidity of the solution), micellar bundles (which moved cooperatively as single objects), and the saturation of micellar networks depending on the molar ratio of salt to the surfactant (R = / ). They suggested that the subsequent increase in for ∗ was due to the formation of many more micellar bundles. Azzouzi et al. (2005) analyzed data for fixed = 0.05M and varying from 0.01M to 1M. They observed that the rheological behavior of the solution dramatically changed as increased in this region, and the shear thickening regime was limited to a narrow range of values. Only in the range of 0.01M < < 0.018M, both Azzouzi et al. (2005) and Cressely and Hartmann (1998a) reported shear thickening behavior. For higher values, Azzouzi et al. (2005) reported a domain of heterogenous flows and shear induced phase transitions that exhibited shear thinning behavior. In the present study, CTAB/NaSal solutions have been prepared for various salt concentrations that lie within the shear thickening regime, and hence the salt concentrations are below 0.019M for the case of = 0.05M. Further details of the sample preparations are given in Section II.
Kim and Yang (2000) studied the rheology of CTAB/NaSal solutions with 0.1 < R < 10 and concluded that R strongly influences the viscoelastic properties of the solution. Using a single relaxation time to fit the linear viscoelastic response of solutions to the Maxwell model, they observed that decreased with increasing R for 1 < R < 10. However, the plateau modulus was independent of R. In our study, we focus on shear thickening solutions of CTAB/NaSal in the range 0.18 < R < 0.34, and also obtain an estimate of the gel modulus that is independent of R. We compare our results to those reported by Kim and Yang (2000), see Section III for details.
While the rheology of surfactant-salt systems has been studied extensively, the formation and morphology of Shear Induced Structures (SIS) have also been the subject of several investigations. Specifically, rheo-optical techniques have been used extensively to study the evolution and microstructure of SIS, in shear thickening systems. Wunderlich et al. (1987) performed both birefringence and rheological studies on tetradecyl trimethyl ammonium salicylate (TTAS) solutions and inferred that the SIS consist of small clusters of rod-like micelles in the shear-thickening regime. Small angle light scattering (SALS) measurements on the CTAB/NaSal system were reported in the pioneering work by Liu and Pine (1996), wherein they observed an increase in the shear stress as the shear thickening transition occurred. Using a CCD video camera to visualize the fluid flow in a Couette cell, they observed finger-like structures that exhibited gel-like characteristics. The gel phase extended from the stationary inner wall to the rotating outer wall of the Couette cell. In the shear thickened state, they also observed fluctuations in the stress that were attributed to the growth and retraction of these shear induced fingers due to an elastic interfacial instability. Their results are consistent with the findings of Bandyopadhyaya and co-workers (2000, 2001) who observed time dependent behavior of shear as well as normal stresses in the SIS regime above a critical shear rate for a cetyltrimethylammonium tosylate (CTAT) solution, and obtained a positive Lyapunov exponent for the temporal response of the stress signals, implying large amplitude fluctuations. Chen and Rothstein (2004) observed velocity fluctuations and a turbid high-shear region around a sphere falling in a micellar solution, and conjectured that these effects were due to the formation of a shear induced gel-like state. Very recently, Ouchi et al. (2006) used birefringence and optical visualization (with tracer particles) to study SIS in the start-up Couette flow of CTAB/NaSal solution. They observed that an initially transparent fluid became opaque because of SIS formation.
Using light scattering experiments to study the shear thickening regime, Prtzl and Springer (1997) showed that SIS formation can be divided into three consecutive stages, namely, induction, aggregation, and orientation of micelles. With the same technique, Hu et al. (1998) attributed the origin of the shear thickening regime specifically to heterogenous nucleation of SIS because of the presence of impurities and/or surface roughness. Using NMR velocimetry and mechanical measurements within a cone-and-plate rheometer, shear banding, i.e. formation of two layers with high contrast in shear rates, was observed by Britton and Callaghan (1997,1999) in the CPyCl/NaSal system. Moreover, in the shear thickened regime, they observed different shear rate phases separated by a boundary that either exhibited rapid fluctuations or slow migrations in the direction of the velocity gradient. The fluctuation and migration effects were attributed to interfacial instability and stress relaxation respectively. Chen and Rothstein (2004) also reported velocity fluctuations of a sphere falling in a micellar solution, and observed significant rotation and migration of the sphere towards the confining walls, and attributed these effects to an instability in the SIS phase.
Several authors have attempted mathematical modeling of the rheological behavior of surfactant-salt systems to address the factors that govern the formation and dynamics of SIS (e.g. Cates and co-workers (1987a, 1987b, 1988, 1990, 1996, 2001), Shankar and Kumar (2004), Eggert and Kumar (2004), Bautista (1999), Macias et al. (2003), McLeish (1986, 1987), MacKintosh (1990), Appell et al. (1982)). Special attention has been paid to the formation of shear bands by Olmstead and co-workers (2003, 2004, 2006). The dynamics of the interface between the gel-like and solution phases have been modeled by Shankar and Kumar (2004) and Kumaran and Muralikrishnan (2000). Kumaran and co-workers [Kumaran and Muralikrishnan (2000), Kumaran et al. (1994), Muralikrishnan and Kumaran (2002)] performed linear and nonlinear stability analysis of a Couette flow of a Newtonian fluid with viscosity , past a flexible gel-like medium with shear modulus G in the limit of negligible inertial effects. The analysis revealed that an instability can occur at the fluid-gel interface above a critical value of the dimensionless stress parameter . Second, the critical value of above which instability occurred depended on the ratio of the thickness of the gel and fluid phases, ratio of the gel and fluid viscosities, as well as interfacial tension. Eggert and Kumar (2004) applied this model to interpret experimental data for surfactant solutions in the SIS regime, where the structures were predicted to exhibit gel like properties [Hu et al. (1998)]. They observed an instability in their fluid-gel model and reported a critical dimensionless stress for the onset of instability. Comparison of theoretical and experimental values suggested that 0.3. In the present study, both the fluid-gel model and values have been used to estimate the elastic properties of the gel-phase: see section III.H.
Despite the numerous studies described above, a fundamental first principles based understanding of the relationship among flow, electrostatics and microstructure is only slowly emerging for SIS forming systems. Specifically, electrostatic interactions are greatly dependent on the salt concentration. First principles modeling efforts should identify and faithfully incorporate salt mediated interactions to have truly predictive capabilities. Evidently, precise knowledge of the effect of salt concentration on the critical shear rates and inception times (strains) is a pre-requisite for gaining physical insights and validation of models. In this work, we have focused on performing a series of experiments for a well-characterized system (CTAB/NaSal) [Cressely and co-workers (1994, 1997a, 1997b, 1997c, 1998a, 1998b, 2000), Liu and Pine (1996), Azzouzi et al. (2005), Kim and Yang (2000)] in the shear thickening regime with the objective of identifying the effect of on the onset conditions for SIS formation. Based on the experimental data, a scaling relationship has been proposed for vs. . Moreover, it is shown that for a given , all vs. data for shear thickening solutions can be reduced to a single master curve, suggesting a self similar dynamical behavior. In addition to the above findings, we have shown that shear thickening transitions in the above system are indistinguishable in terms of vs. data obtained from two geometries, namely the cone-and-plate and the Couette flows. We also apply interfacial instability theories for model gel/fluid systems to obtain estimates of the elastic modulus of the gel phase and compare them to independent measurements.
The rest of this manuscript is organized as follows : materials and methods are discussed in II, results are presented and discussed in III and conclusions are given in IV.
II MATERIALS AND METHODS
As stated above, our objective is to perform rheological characterization that will allow us to quantify the effect of on the onset conditions of SIS formation. Hence, we have used CTAB/NaSal as the surfactant - salt system in our studies since several rheological and optical measurements of this system are available in the literature. The samples of CTAB and NaSal were obtained from Fluka and Sigma Aldrich respectively. All the solutions were prepared using deionized water with resistance greater than 17.9 and then equilibrated for three days before being used for analysis. After master batches of CTAB and NaSal were prepared, calculated volumes were stirred and diluted to achieve the desired concentrations. Three sets of samples with surfactant concentrations = 0.05M, 0.07M, and 0.09M were prepared with molar ratios R = / varying from 0.18 to 0.34 in each set. These concentrations were chosen so that the shear thickening transitions obtained by Cressely and Hartmann (1998a) could be reproduced. The samples were stored in the laboratory at room temperature without direct exposure to sunlight.
Rheological experiments were performed using TA Instruments AR 2000 constant stress and strain rheometer, primarily using a cone and plate geometry with a diameter of 60 mm (cone angle 0° 59’ 49", truncation 27 m). A set of experiments was also performed using the Couette geometry to ensure the robustness of the data. The torque range of the rheometer was 0.1 Nm - 200 Nm, and the minimum stress measurable was 0.0008 Pa. Temperature was controlled at 24∘C by a Peltier plate. A solvent trap was used to minimize evaporation. At the end of each experiment, the Peltier plate was flushed with water to remove the sample and then dried and cleaned using Isopropyl alcohol before adding a new sample. The Couette experiments were performed with standard-size double concentric cylinders with an outer aluminum rotor (OD 21.96 mm, ID 20.38 mm) immersed at a height of 500 m inside the inner steel stator (ID 20 mm). The solvent trap was also used for this instrument to minimize evaporation.
In order to determine an optimum sampling time per data point, steady shear experiments were performed with different sampling times. It was found that 600 seconds was sufficient to obtain reproducible data for and , as discussed in section III. Three trials were performed for each set of () to ensure the reproducibility of results and to estimate the experimental uncertainties.
Samples stored for over 4 months showed aging effects with change in and/or exhibited shear thinning behavior. Similar aging behavior was also observed by Mohan et al. (1976), Myska and Mik (2004) and Jana et al. (2004). Shear thickening solutions with high molar ratios exhibited shear thinning on aging, while those with low molar ratios continued to shear thicken, however accompanied by a decrease in and/or an increase in the critical shear rate c. The former effect was attributed to the formation of networks upon aging [Jana et al. (2004)], and the latter could be due to the degradation of the micelles at equilibrium below a certain R. Some of our samples also showed photosensitive effects by turning brown upon aging. However, all the data reported here are for samples less than 60 days old for which aging effects are absent.
III RESULTS AND DISCUSSION
A. Specific viscosity and micelle structure
The effect of salt concentration on the specific viscosity of the solutions near equilibrium was analyzed. Here, ( - )/, where and denote the zero-shear viscosity of the solution and the solvent respectively. The variation of as function of is given in Fig. 1. The values of the surfactant concentrations considered here are 0.05M, 0.07M and 0.09M, with molar ratio of salt to surfactant concentrations R varying from 0.18 to 0.34 in increments of 0.02M in (denoted by numbers from 1 to 9). The scaling exponents for the three sets of data for versus are within experimental uncertainty, and range from 11.6 to 12.4. We observe over three orders of magnitude increase in corresponding to a factor of two enhancement in , signifying that the microstructure is extremely sensitive to variations in .
The inset a in Fig. 1 shows the log-log plot of with respect to . For = 0.05M, initially increases almost linearly with increasing and thereafter shows a power-law behavior. The values reported here are in agreement with those reported by Azzouzi et al. (2005) and Cressely and Hartmann (1998a). Similar change in the scaling behavior can also be observed for solutions with = 0.07M, while all the solutions with = 0.09M exhibit a power-law behavior. The trends observed for = 0.05M and 0.07M indicate a possible change in the microstructure as increases. For any fixed , the changes in with respect to are representative of the micellar contribution to the viscosity of the solution. It is well known that globular micelles form at low and/or with no salt [Hamley (2000)]. Increasing the salt concentration reduces the electrostatic Debye screening length around the surfactant, which encourages the formation of longer micelles at equilibrium. This in turn contributes to the changes in . Fujio (1998) found that spherical micelles associated to form into rod-like micelles when exceeded a threshold concentration.
Imae et al. (1985) studied the sphere-to-rod transition of CTAB/NaBr micelles, and showed that the logarithm of micelle molecular weight (MW) log( + )n, where is the critical micelle concentration, and the exponent n < 1 for spherical micelles, whereas n > 1 for rod-like micelles. Similar observations have been made for other micellar systems as well [Fujio (1998), Imae and Ikeda (1986)]. To verify the structure transition in our study, we need to estimate both MW and of the micelles. To calculate MW, we referred to the lengths of CTAB/NaSal micelles obtained by Garg et al. (2006) who used Dynamic Light Scattering (DLS) measurements to study the structure of the micelles with = 0.05M and 0.015M < < 0.05M. Their DLS data was analyzed in terms of a prolate ellipsoidal structure with the semi-minor axis of the ellipsoid fixed at 4.3nm. The semi-major axis was used to obtain the average length of the micelles () for the different values, see Table 2, Garg et al. (2006), from which = 20 2 nm for = 0.05M and = 0.015M, and increases to 93 9 nm for = 0.05M and = 0.05M. Imae and Ikeda (1986) have reported the average micellar molecular weight for cylindrical micelles = ML, where ML is the molecular weight per unit length 8900 nm-1 for CTAB/NaSal system [Shikata et al. (1994)].
The critical micelle concentration of CTAB in pure water is 9 10-4 M [Rothstein (2003)]. Addition of salt is known to decrease of the solution [Hamley (2000)]. Hence, when NaSal is added to the solution, < 9 10-4 M. In our study, both and 9 10-4 M, hence + . Based on the estimates discussed above, a plot of log MW vs. log is shown in the inset 1b. A significant change in slope can be seen around 0.022M (log -1.65) which indicates predominantly spherical micelles for lower values, and more rod-like micelles for higher values. Using Cryo-TEM technique on CTAB/methylsalicylic acid, Lin et al. (1994) have shown that both spherical and wormlike (or rod-like) micelles coexist for a range of salt-surfactant concentrations. Thus a large size distribution of micelles including spherical and polydisperse rod-like micelles should exist in this regime. Since globular micelles form at low salt and surfactant concentrations [Hamley (2000)], we hypothesize that at low R, there are more spherical micelles than rod-like micelles, and as R is increased beyond 0.26 ( = 0.013M), the number of polydispersed rods exceed the number of spheres. For a given R, we see that an increase in from 0.05M to 0.09M leads to an increase in , which suggests that longer rod-like micelles could form with the addition of surfactant and salt. Whereas, for a given , a change only in does not necessarily promote the formation of longer micelles. This can be seen from the inset b in Fig. 1, where for a given , decreases as increases from 0.05M to 0.09M. This trend was also observed by Cressely and Hartmann (1998a), who attributed the decrease in to the relative decrease in the amount of salt per unit mass of the surfactant, which hindered the formation of longer rod-like micelles.
From Garg et al. (2006), the length for micelles with = 0.05M, and = 0.015M 20 2 nm. This specific datum falls within the parameter range of the present study for which = 0.05M and 0.009M < < 0.019M. Using the theory for uncharged rigid rods derived by Doi and Edwards (1986), we found that the average distance between the rods in the suspension () was larger than the rod length , i.e. , implying a dilute regime.
B. Shear rheology and critical shear rate
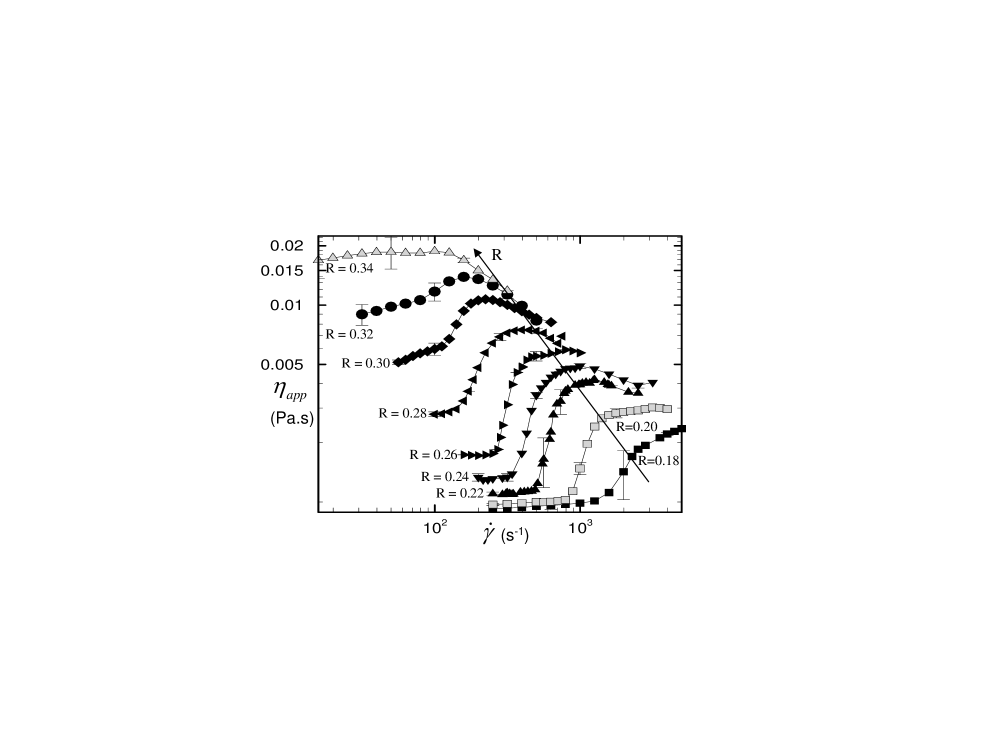
In Fig. 2, we show the results of a steady shear experiment using the solutions with = 0.05M and 0.18 R 0.34. For small values of R and at shear rates < 500 s-1, the homogeneous solution has viscosity comparable to that of the solvent ( 1 mPa.s). However, as the shear rate is increased beyond a threshold value , e.g. approximately 1580 s-1 for R = 0.18, SIS formation is observed. SIS manifest as a gel-like micellar phase dispersed within a relatively low viscosity solution. As R is increased, and the maximum in the viscosity increase, while decreases. From Fig. 2, it is evident that as (or R) increases, the relative magnitude of shear thickening gradually decreases such that when the molar ratio R = 0.34, the solution shear thins. As R is increased, electrostatic interactions are more effectively screened. This favors the formation of longer micelles which behave under flow as flexible macromolecules. This is consistent with the shear thinning behavior observed for large values. The findings reported in Fig. 2 are also consistent with the results of Hartmann and Cressely (1998b). The dependence of the critical shear rate for the onset of shear thickening with respect to is given in Fig. 3, and we see that -6. This is in qualitative agreement with the results of Hartmann and Cressely (1998b) whose data showed -7. Note that while data reported in the present study are averaged over three runs, Hartmann and Cressely (1998b) have not reported standard deviations for their data. The determination of critical shear rate has to be done judiciously considering the experimental uncertainty incurred in estimating the apparent viscosity (as an average of a fluctuating signal over a sufficiently long period of time: see section III.C. below) and by visual inspection of the data to locate an abrupt increase in . This procedure when applied consistently, translates to identifying as the shear rate at which ( - ) 0.1. Hartmann and Cressely (1998b) do not report the criterion used to determine in their work. Since the shear-thickening transition is abrupt and very sensitive to in the vicinity of , such uncertainties can lead to differences in best fits to the data.
C. Torque fluctuations
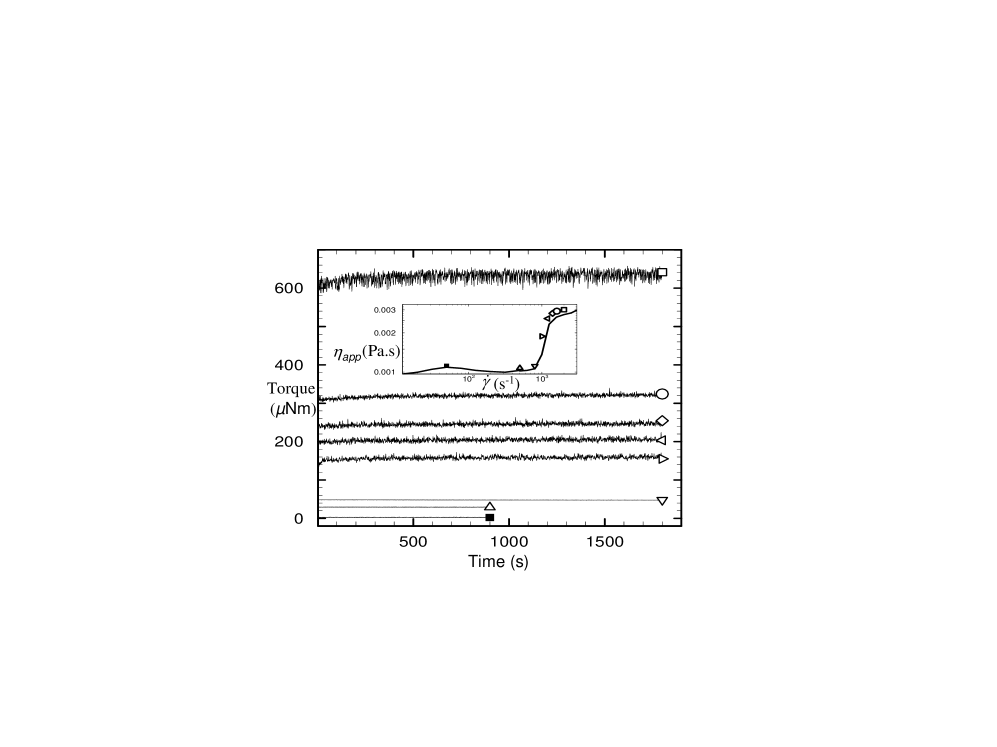
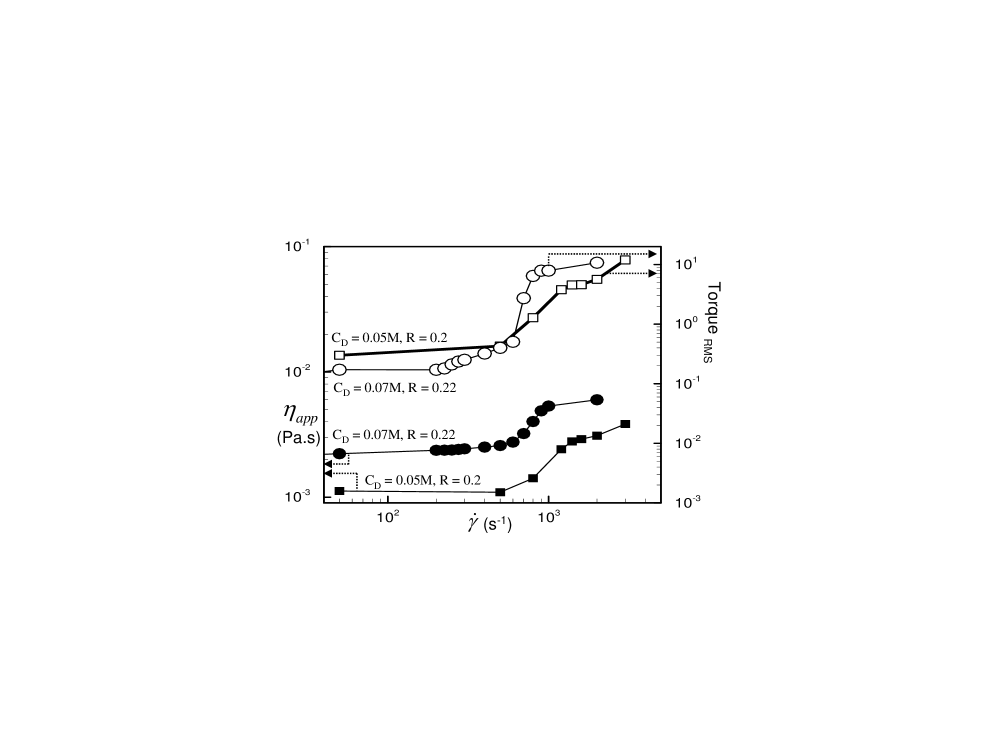
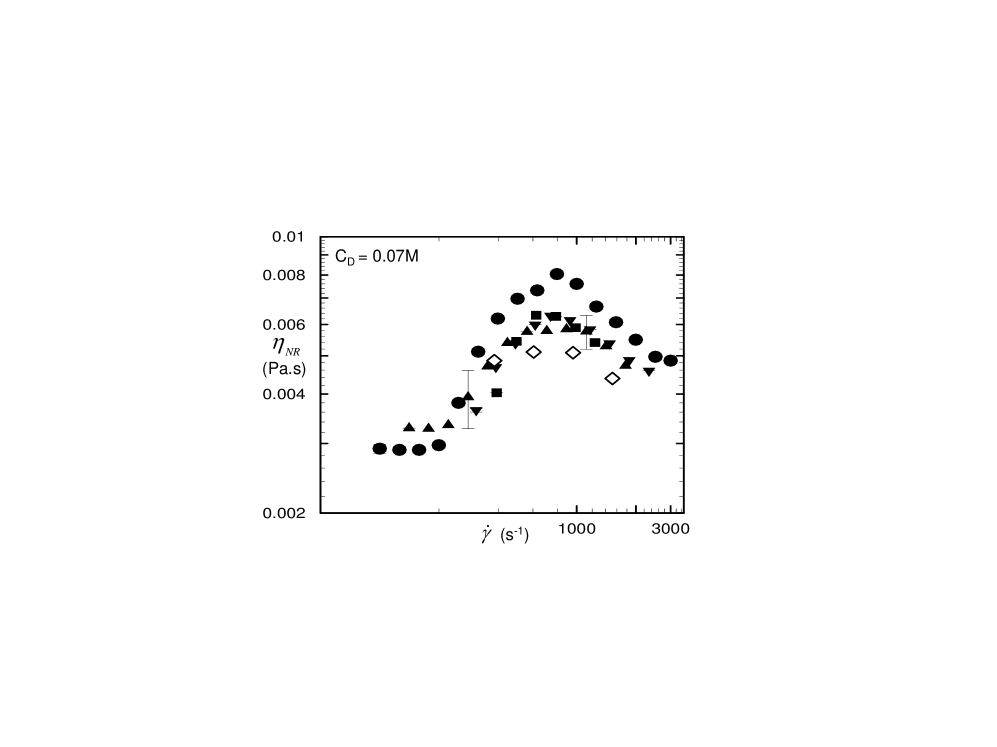
In the SIS regime, the interface between the gel phase and the surrounding fluid phase oscillates with a frequency that depends on the salt concentration [Britton and Callaghan (1999)]. The interface may develop fingers which grow and retract [Liu and Pine (1996)], and migrate slowly in the direction of the velocity gradient [Britton and Callaghan (1997, 1999)]. Such unstable interfacial dynamics cause torque fluctuations, and a small variation in , and/or the presence of small impurities can substantially alter the dynamics as shown by Britton and Callaghan (1997, 1999). These authors conjectured that the interfacial boundary moved by ejecting or acquiring fluid of the two phases resulting in normal stress discontinuity and slow migration of the interface. In Fig. 4, the oscillatory, but statistically stationary torque signals obtained from the rheometer for a solution with = 0.05M and R = 0.2 are illustrated. Here, the torque signals have been recorded for 1800 seconds in the SIS regime by performing a Peak Hold in which the shear rate was held at a constant value over a certain time period. Since the torque signals are oscillatory, the viscosity has to be interpreted as an apparent value , i.e., as the ratio of the time-averaged shear stress to the shear rate. The inset in Fig. 4 displays obtained at the respective values upon time averaging the torque signals over 600 s (solid line) and over 1800 s (symbols). Since the difference between these values is very small, 600 seconds was chosen as sufficient run time for steady shear experiments. Fig. 4 also shows that in the SIS regime, as increases, the torque fluctuations increase. In Fig. 5, the root-mean-square values of these fluctuations are shown for two solutions, = 0.05M (R = 0.2) and = 0.07M (R = 0.22). In both cases, the magnitudes of fluctuations in the shear-thickened regime reach values that are at least an order of magnitude larger than those in the Newtonian regime. This result suggests the chaotic nature of SIS. This dynamic behavior is consistent with the results of Liu and Pine (1996), Nowak (1998), and Bandyopadhyay and co-workers (2000, 2001).
D. Critical strain
In the above analysis, a step increase in is accomplished without any stoppage in flow, i.e., the strain is continuously applied on the solution. However, starting at equilibrium, if a is applied on the solution, the stress (or torque) increases after some time period [Liu and Pine (1996)]. The time needed for the stress to rise, decreases as is increased in the shear thickening regime. This is illustrated in Fig. 6, where for a solution with = 0.05M and R = 0.28, we applied shear rates of 100, 150, 200 and 300 s-1, denoted by the filled symbols in the figure. The inset shows vs. . Based on the time required for the increase in stress, we obtain the critical strain ( = ). Irrespective of the magnitude of applied, was found to be almost constant 8500. Hence the shear thickening transition occurs when a critical strain is imposed on the micellar solutions at equilibrium, as long as the . We found that the value of the critical strain was dependent on . For example, in the case of solutions with = 0.05M, 8500 for = 0.014M, whereas 5750 for = 0.015M. This is because of the more effective screening of electrostatic interactions that leads to longer micelle length under flow for larger values. Since longer micelles can entangle more easily, smaller strains are required to form SIS.
E. Stress relaxation and normal stress
When the strain applied on the shear induced solution was stepped down to zero, the stress decreased rapidly and abrupt at first, as shown in Fig. 7. This rapid decay is followed by a slower stress relaxation process. This bimodal relaxation process agrees well with the relaxation behavior of entangled solutions of threadlike micelles [see Amin et al. (2001), Shukla et al. (2006), Cates and Candau (1990) and references therein], and corroborates the understanding that SIS are entangled phases. Thus, the stress relaxation mechanism is governed by a combination of local cooperative motions of the gel-like network of SIS, and relaxation of the transient network structure. For the given solution (Fig. 7), it is observed that the shear stress decays by over four orders of magnitude, and for long times, the residual stress B ( 0.0027 Pa) is statistically stationary for the duration of the experiment (300 s in this case). Experiments conducted for over 10 hours also yielded this value of B. When the stress decayed to about 10% of its initial value, the data was fit to a single exponential model for the stress, , where is the longest stress relaxation time, and A is a constant. The fit is shown by the solid line in Fig. 7. depends on the counter-ion concentration. For example, 2.1 s and 2.6 s for R = 0.28 and 0.30 respectively, for a given applied strain = 9556. As the counter-ion concentration increases, the enhanced electrostatic screening could promote the formation of more entangled network which would relax slower.
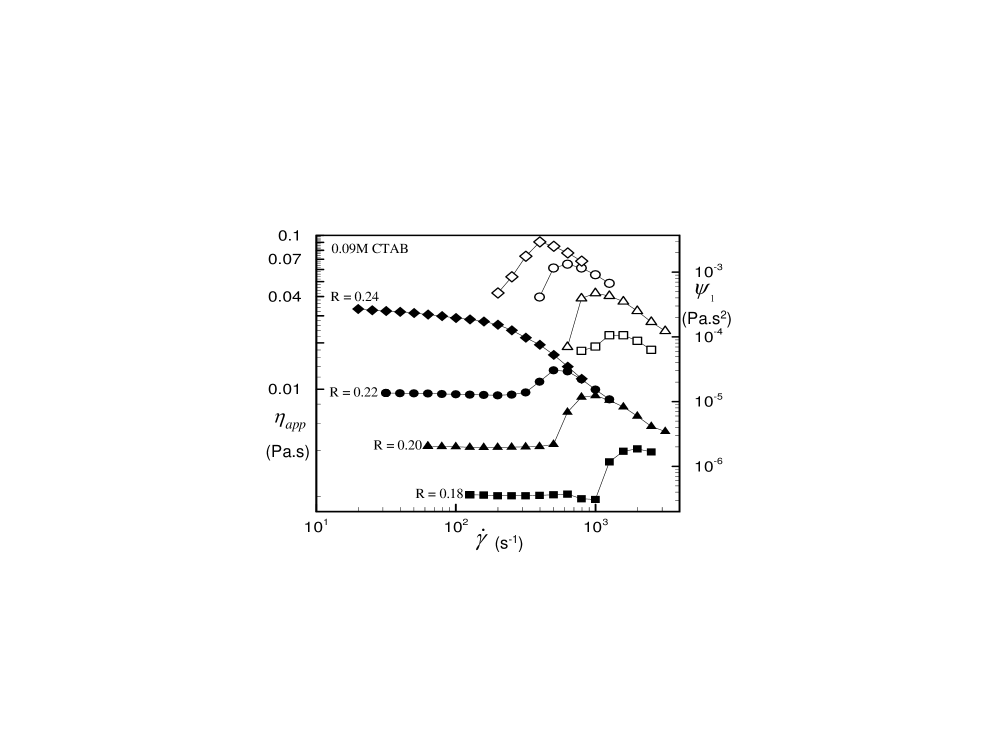
The SIS regime is known to exhibit viscoelastic behavior [Nowak (1998)]. SIS are attributed to flow-induced deformation of the gel phase that manifests as elastic normal stresses. In the shear induced regime, Fischer (2000) reported oscillations of both the shear stress () and first normal stress difference to be in-phase, signifying that these oscillations were caused by the same mechanism. Second, the transient but pronounced behavior of normal stresses indicated that SIS regime was more viscous and elastic than the Newtonian phase [Fischer (2000)]. In Fig. 8, we show the apparent normal stress coefficient as a function of for a typical shear thickening solution with = 0.05M and R = 0.24. Note that can be measured only in the shear-thickened regime, which proves that the SIS are elastic in nature. This result agrees with the findings of Wunderlich et al. (1987), Hu and Matthys (1995, 1996), and Nowak (2001), who have also reported that the normal stress effects are observable only in the SIS regime. However, as seen from Fig. 8, the shear rates for the onset of shear thickening in viscosity () and for the development of observable normal stresses do not coincide. These observations indicate that although the entangled phase contributes to the increase in , the fluid becomes more gel-like with time perhaps due to consolidation of the network structure. The normal stresses grow gradually, plateau and finally decrease at higher shear rates. The plateau indicates that the gel structure is robust within a certain shear rate range. At higher shear rates, the partial destruction of aggregates decreases the normal stresses, for instance, for R = 0.2, decreases beyond 3000 s-1 [Nowak (1998)]. Above > 5000 s-1, we observed foaming, and centrifugal forces throw the fluid out of the rheometer. Hence our analysis is restricted to shear rates 5000 s-1.
F. Self-similar transition to SIS regime
We define an apparent relaxation time as and measured the effect of on for all cases in which shear thickening transition is observed. In Fig. 9, we plot the largest relaxation time (, where is the maximum normal stress coefficient) as a function of , and observe that 6. The product of and the ( -6, see Fig. 3) is practically independent of the salt concentration, since the scaling exponents of and are -6 and 6 respectively. We define a Weissenberg number We , where is the shear rate at which is obtained. As shown in Fig. 9, We is only weakly dependent on the salt concentration. This suggests a self-similar dynamical transition to the SIS regime. Taking advantage of this observation, a master plot of viscosity vs. shear rate may be constructed by suitably shifting the coordinates for all shear-thickening cases. We use the following definitions for a reduced viscosity (), reduced shear rate (), and the normalized reduced viscosity () to normalize the viscosity data for a solution (S) with respect to that of a base solution (B).
| (1) |
| (2) |
where
| (3) |
and
| (4) |
In the above equations, denotes the maximum apparent viscosity in the SIS regime. The master curve for = 0.05M is given in Fig. 10, where is plotted versus the reduced shear rate ().
Note that the power-law scaling behavior where -6 and 6 is observed only for salt concentrations greater than a critical value (which slightly exceeds the minimum salt concentration required to induce shear thickening) and, less than the value for which elongated micelles are formed at equilibrium causing shear thinning behavior. Only data for this concentration range are used in the renormalization procedure. This corresponds to R values in the range of 0.24 - 0.32 in this case of = 0.05M. Here, we chose R = 0.24 as the base case (B). The selection of the base case does not affect the master plot.
In order to validate whether the above conclusions are robust with respect to surfactant concentration, experiments with = 0.07M and 0.09M, and with 0.18 < R < 0.34 were performed. In Figs. 11 and 12, we plot vs. for = 0.07M and 0.09M respectively. Solutions with = 0.07M and 0.09M also show shear thickening behavior, though the range of R values showing this behavior decreases as increases. For = 0.07M, solutions with 0.18 R 0.24 showed shear thickening behavior, while for = 0.09M, the shear thickening range was 0.18 R 0.22. Fig. 13 shows the best power-law fits for and with respect to , for = 0.07M and 0.09M respectively. The We for the respective salt concentrations is also given, and it is evident that We is weakly dependent on . For these shear thickening solutions, -6 and 6 respectively, similar to = 0.05M. The specific exponents for and are -5.8 and 6.2 for = 0.05M, -6 and 5.9 for = 0.07M, and -5.8 and 6.1 for = 0.09M. Thus the scaling behavior of , , as well as the dependence of We on the counter ion concentration is robust and is almost irrespective of .
Figs. 14 and 15 show the master plots for = 0.07M and 0.09M respectively, obtained using Eqs. 1 - 4. For = 0.07M, R = 0.22 was chosen as the base case, while for = 0.09M, R = 0.18 was selected. Again, the selection of the base case did not affect the master curve. These master curves, however, show some scatter but no systematic trends are observed as a function of R. As discussed earlier, micelles with = 0.05M and 0.18 < R < 0.34 exhibited the sphere-rod transition. For a given R, as we increase , more micelles could be formed that in turn suggests an increase in intermicellar interaction. Hence, for a given R, increases with . Addition of even small amounts of salt screens the electrostatic interactions, and under flow, promotes the formation of longer micelles that tends to shear thin. Hence the number of solutions that exhibit shear thickening transition decreases as increases (see Figs. 2, 11, and 12). Similarly, the extent of shear thickening is reduced as increases. However, the master curve suggests that for a given , the shear thickening transitions are self-similar.
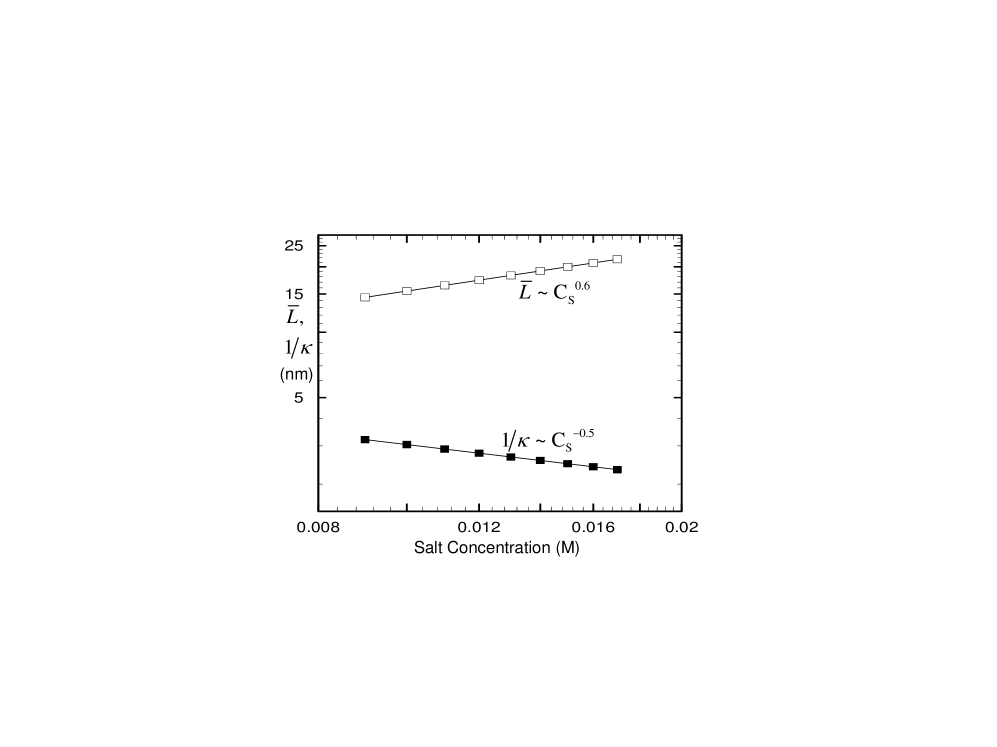
The mechanism underlying the self-similar behavior must include the salt-mediated screening of the electrostatic interactions among the micelles. Specifically, the Debye layer thickness 1/ vs. relationship can be estimated by using , where is Faraday’s constant in coulomb/mol, R is the universal gas constant in J K-1 mol-1, T is the absolute temperature in K, is the permittivity of vacuum and is the relative permittivity of the solvent [Hunter (2001)]. Here, we treat the micelle surface to be continuous with an effective charge density. Fig. 16 shows 1/ vs. for the CTAB/NaSal solutions ( = 0.05M). In the same figure, the average micelle length is also plotted vs. using data reported by Garg et al. (2006). It is seen that 0.6. Hence, as is increased, one forms longer micelles with smaller electrical double layers around them. Under flow, the micelles can be stretched, and at relatively high shear rates, the tumbling frequency increases, and hence longer chains tumbling rapidly can form entangled structures. In other words, high shear rates and large promote inter-micelle association and hence network formation. Further, in a broad sense, if one views network formation as a chemical reaction, one can interpret the flow-induced conformation change (i.e. stretching/orientation of micelles) as a process that diminishes the associated energy barrier. Hence, the strong dependence of on can be attributed to the increase in and with respect to . Further, the fact that for a given , the strain required to accomplish SIS formation is practically constant implies that for > , the inception time decreases as 1/. This is qualitatively consistent with the mechanism described above. Specifically, as is increased, the chains will unravel faster and their end-to-end tumbling frequency will be increased [Teixeira et al. (2005)], which is favorable for network formation. Hence, a mathematical description of SIS formation should combine the knowledge of the physical chemistry of salt-mediated interactions with an analysis of flow-induced configurational changes.
G. Effect of inertia and flow geometry on SIS formation
To investigate whether the inception times and final state of the SIS could be geometry dependent, we performed steady state experiments in a Couette cell, details of which are given in section II. In Fig. 17, we show the comparison between the Taylor-Couette and cone-and-plate data for two solutions. Both results are statistically indistinguishable. In the same figure, we report the Reynolds number Re = vs. , where a is the characteristic length scale of the flow cell. In the SIS regime, Re > 10, which indicates that the inertial effects are significant. However, in the experiments performed by Liu and Pine (1996) and Cressely and Hartmann (1998a), Re values were between 0.1 to 120. Re values in the present study are similar to those observed in the experiments done by Cressely and Hartmann (1998a). This indicates that the SIS formation is not qualitatively influenced by inertial effects.
H. Elastic modulus and network size
The discontinuity in the elastic normal stress between the gel-like and solution phases in the SIS regime could cause the interface between the two phases to be unstable as in the case of an interface between a deformable gel and a viscous fluid. Eggert and Kumar (2004) have stated that the SIS have mechanical properties of a gel because these structures are observed to rotate like a solid body and fracture above a critical stress. This has motivated Kumar and coworkers [Eggert and Kumar (2004), Shankar and Kumar (2004)] as well as Kumaran and Muralikrishnan (2000) to study instabilities in model systems such as shear flow of a viscous/viscoelastic liquid over a linear elastic solid. Typically, experiments and stability analysis show that at relatively small Reynolds numbers, interfacial instability occurs when the ratio of the shear modulus of the gel phase G to the characteristic shear stress in the fluid reaches an O(1) value, see Table 1, Eggert and Kumar (2004). The value of the critical dimensionless stress = , obtained both from experiments and theory was 0.3. Using = 0.3 and values at = max, where max is the shear rate at which the maximum in is obtained from the present experiments, we have estimated the value of G for the three different surfactant concentrations considered. For = 0.05M and 0.22 < R < 0.32, was found to vary 6. We found that G was practically constant for different salt concentrations (fixed ), though it increases with increasing . Specifically, G0.05M 5 0.4 Pa, G0.07M 20 3 Pa, and G0.09M 27 4 Pa. The increase in G with can be explained based on the fact that the presence of more surfactants encourages the formation of more networks in the gel phase that in-turn contributes to the increase in the modulus. Independent verification of this gel modulus cannot be performed because the gel formation is reversible i.e. it dissociates upon flow cessation; see Fig. 7. However, elastic modulus of CTAB/NaSal gel phases have been measured for R > 1 where micelle networks form even at equilibrium. For instance, Kim and Yang (2000) used the CTAB/NaSal system with R 1, for which is at least three orders of magnitude greater than those in our study. They reported a storage plateau modulus G0 10 Pa ( = 0.05M), a value also reported by Rothstein (2003) for the same system. Although the equilibrium micellar structures obtained at high R and SIS obtained under lower R values are not readily comparable, the elastic modulus values reported differ only by a factor of 2 from G 5 estimated by employing linear stability analysis results for a model gel/fluid system [Eggert and Kumar (2004), Shankar and Kumar (2004)]. Further, we note that the value of 0.3 for was obtained from a linear stability analysis for a low Reynolds number flow past polymer gels. Since Re in the present system is higher, and since the model system suggested by Eggert and Kumar (2004) is not exactly replicated here, the value of could differ from 0.3.
If the SIS are regarded as a network of micelles, an estimate of the mesh size () of this network, is given by G)(1/3) [Cates and Candau (1990)]. This gives values of 100 nm, 60 nm, and 53 nm for = 0.05M, 0.07M, and 0.09M respectively. Cates and Candau (1990) showed that in the semidilute regime which implies that G 2.3. Using the values of G obtained above, we find G 2.9. However, as discussed by Cates and Candau (1990), polyelectrolyte effects become important for ionic surfactants at low added salt concentrations. This can lead to a deviation from the theoretical value of 2.3.
IV CONCLUSIONS
The influence of counter-ion concentration on the specific viscosity and the rheology of dilute CTAB/NaSal system has been investigated to explore whether SIS formation in such systems occur via a self-similar dynamical route. The surfactant concentrations considered were 0.05M, 0.07M and 0.09M. The molar ratio R = / was increased from 0.18 to 0.34 for each . For a given , it was found that was very sensitive to small changes in . Using data from the literature [Garg et al. (2006), Imae et al. (1985), Shikata et al. (1994)], the logarithm of the molecular weight (MW) vs. log indicated different slopes that suggested the micelles in the concentration regime studied undergo a sphere-rod transition.
Under shear, the solutions exhibited Newtonian behavior at low shear rates . When the exceeded the critical shear rate , a structure transition occurred that caused gel-like structures to form within the Newtonian solvent which in turn increased the viscosity of the solution (shear thickening). As increased, also increased, but was found to decrease. We found that -6 for all values. At high values, the solutions exhibited shear thinning behavior. This trend was consistent for solutions with = 0.05M, 0.07M, and 0.09M, and for experiments performed in different flow cells, namely the cone-and-plate and Couette rheometers.
The torque fluctuations in the shear thickening regime were found to be at least an order of magnitude greater than the fluctuations in the Newtonian region. Hence the viscosity values calculated were apparent values . When a given > was applied on the solution originally at rest, the torque was found to increase after a certain time period . A product of yielded the critical strain , which was found to be independent of the magnitude of applied on the solution for given . However, required for SIS formation decreased with increasing . When the strain applied on the solution was stepped down to zero, the stress relaxation results suggested that the dissociation time of gel aggregates was also dependent on the amount of counter-ions present in solution. Since SIS formation is reversible, direct measurements of the elastic modulus of gel phase is not feasible. In this work, we have employed results of a hydrodynamic instability theory based on a simplified “gel-fluid” model for the heterogenous shear thickened phase and estimated the elastic modulus.
The solutions exhibited both viscous and elastic characteristics only in the shear thickened regime. The ratio of elastic to viscous effects was used to obtain the solution relaxation time in the shear thickened phase. Irrespective of the value, 6. We defined a Weissenberg number We , and found that We was only weakly dependent on . This observation was used to develop master curves for viscosity vs. shear rate in terms of suitably reduced variables, which indicated that the SIS formation was self-similar with respect to . A qualitative mechanism that combines the effect of on average micelle length and Debye parameter with shear-induced configurational changes of rod-like micelles is proposed to rationalize the self-similarity of SIS formation. The mechanistic understanding developed from the experiments can be used in the future to develop a more rigorous mathematic framework and mesoscopic simulations to study flow-induced network formation in dilute micellar solutions.
ACKNOWLEDGEMENTS
We gratefully acknowledge NSF grant CBET 0404243 and CBET 0335348 for partial support of this work.
References
- [1] Amin, S., T. W. Kermis, R. M. van Zanten, S. J. Dees, and J. H. van Zanten, “Concentration fluctuations in CTAB/NaSal solutions” Langmuir 17, 8055 - 8061 (2001).
- [2] Arora, K., R. Sureshkumar, M. P. Scheiner, and J. L. Piper, “Surfactant-induced effects on turbulent swirling flows,” Rheol. Acta 41, 25 - 34 (2002).
- [3] Appell, J., G. Porte, Y. Poggi, “Quantitative estimate of the orientational persistence length of flexible elongated micelles of Cetylpyridinium Bromide,” J. Colloid Interface. Sci. 87, 492-499 (1982).
- [4] Azzouzi, H., J. P. Decruppe, S. Lerouge, and O. Greffier, “Temporal oscillations of the shear stress and scattered light in a shear-banding-shear-thickening micellar solution,” Eur. Phys. J. E 17, 507-514 (2005).
- [5] Bandyopadhyaya, R., G. Basappa, and A. K. Sood, “Observation of chaotic dynamics in dilute sheared aqueous solutions of CTAT,” Phys. Rev. Lett. 84, 2022-2025 (2000).
- [6] Bandyopadhyay, R., and A. K. Sood, “Chaotic dynamics in shear-thickening surfactant solutions,” Europhys. Lett. 56, 447-453 (2001).
- [7] Bautista, F., J. M. de Santos, J. E. Puig, and O. Manero, “Understanding thixotropic and antithixotropic behavior of viscoelastic micellar solutions and liquid crystalline dispersions. I. The model,” J. Non-Newtonian Fluid Mech. 80, 93-113 (1999).
- [8] Britton, M. M., and P. T. Callaghan, “Two-Phase shear band structures at uniform stress,” Phys. Rev. Lett. 78, 4930-4933 (1997).
- [9] Britton, M. M., and P. T. Callaghan, “Shear banding instability in wormlike micellar solutions,” Eur. Phys. J. B 7, 237-249 (1999).
- [10] Cappelaere, E., and R. Cressely, “Influence of NaClO3 on the rheological behavior of a micellar solution of CPCl,” Rheol. Acta 39, 346-353 (2000).
- [11] Cappelaere, E., R. Cressely, R. Makhloufi, and J. P. Decruppe, “Temperature and flow-induced viscosity transitions for CTAB surfactant solutions,” Rheol. Acta 33, 431-437 (1994).
- [12] Cates, M. E., and S. J. Candau, “Statics and dynamics of worm-like surfactant micelles,” J. Phys. - Condens. Mat. 2, 6869 - 6892 (1990).
- [13] Cates, M. E., and S. J. Candau, “Ring-driven shear thickening in wormlike micelles?,” Europhys. Lett. 55, 887-893 (2001).
- [14] Cates, M. E., “Flow behavior of entangled surfactant micelles,” J. Phys. - Condens. Mat. 8, 9167-9176 (1996).
- [15] Cates, M. E., “Dynamics of flexible polymer like micelles,” Polym. Mater. Sci. Eng. 57, 956-960 (1987a).
- [16] Cates, M. E., “Reptation of Living Polymers: Dynamics of Entangled polymers in the presence of reversible chain-scission reactions,” Macromolecules 20, 2289-2296 (1987b).
- [17] Cates, M. E., “Dynamics of living polymers and flexible surfactant micelles: scaling laws for dilution,” J. Phys.-Paris 49, 1593-1600 (1988).
- [18] Chen, S., and J. P. Rothstein, “Flow of a wormlike micelle solution past a falling sphere,” J. Non-Newtonian Fluid Mech. 116, 205-364 (2004).
- [19] Clausen, T. M., P. K. Vinson, J. R. Minter, H. T. Davis, Y. Talmon, and W. G. Miller, “Viscoelastic Micellar Solutions: Microscopy and Rheology,” J. Phys. Chem.-US 96, 474-484 (1992).
- [20] Cressely, R., and V. Hartmann, “Rheological behavior and shear thickening exhibited by aqueous CTAB micellar solutions,” Eur. Phys. J. B 6, 57-62 (1998a).
- [21] Doi, M. and S. F. Edwards, The theory of polymer dynamics (Clarendon, Oxford, 1986).
- [22] Eggert, M. D., and S. Kumar,“Observations of instability, hysteresis, and oscillation in low-reynolds number flow past polymer gels,” J. Colloid Interf. Sci. 278, 234-242 (2004).
- [23] Fielding, S. M., and P. D. Olmsted, “Kinetics of the shear banding instability,” Phys. Rev. E 68, 036313-1- 036313-20 (2003).
- [24] Fielding, S. M., and P. D. Olmsted, “Spatio-temporal oscillations and rheochaos in a simple model of shear banding,” Phys. Rev. Lett. 92, 084502-1 - 084502-4 (2004).
- [25] Fielding, S. M., and P. D. Olmsted, “Nonlinear dynamics of an interface between Shear Bands,” Phys. Rev. Lett. 96, 104502-1 - 104502-4 (2006).
- [26] Fischer, P., “Time dependent flow in equimolar micellar solutions: transient behavior of the shear stress and first normal stress difference in shear induced structures coupled with flow instabilities,” Rheol. Acta 39, 234-240 (2000).
- [27] Fujio, K., “The salt-induced sphere-rod transition of micelles of 1-Tetradecylpyridinium bromide in aqueous NaBr solutions,” B. Chem. Soc. Jpn. 71, 83-89 (1998).
- [28] Garg, G., P. A. Hassan, and S. K. Kulshreshtha, “Dynamic light scattering studies of rod-like micelles in dilute and semi-dilute regime,” Colloid Surface A275, 161-167 (2006).
- [29] Goyal, P. S., R. Chakravarthy, B. A. Dasannacharya, J. A. E. Desa, V. K. Kelkar, C. Manohar, S. L. Narasimhan, K. R. Rao, and B. S. Valaulikar, “SANS from micellar solutions of CTAB and sodium salicylate,” Physica B 156-157, 471-473 (1989).
- [30] Goyal, P. S., B. A. Dasannacharya, V. K. Kelkar, C. Manohar, K. Srinivasa Rao, and B. S. Valaulikar, “Shapes and sizes of micelles in CTAB solutions,” Physica B 174, 196-199 (1991). Rajagopalan, V., P. S. Goyal, B. S. Valaulikar, and B. A. Dasannacharya, “SANS by isoviscous micellar solutions,” Physica B. 180-181, 525-527 (1992).
- [31] Hamley, I. W., Introduction to soft matter - Polymers, Colloids, Amphiphiles and Liquid Crystals (Wiley, England, 2000).
- [32] Hartmann, V., and R. Cressely, “Influence of sodium salicylate on the rheological behaviour of an aqueous CTAB solution,” Colloid Surface A 121, 151-162 (1997a).
- [33] Hartmann, V., and R. Cressely, “Shear thickening of an aqueous micellar solution of cetyltrimethylammonium bromide and sodium tosylate,” J. Phys. II 7, 1087-1098 (1997b).
- [34] Hartmann, V., and R. Cressely, “Simple salts effects on the characteristics of the shear thickening exhibited by an aqueous micellar solution of CTAB/NaSal,” Europhys. Lett. 40, 691-696 (1997c).
- [35] Hartmann, V., and R. Cressely, “Occurance of shear thickening in aqueous micellar solutions of CTAB with some added organic counterions,” Colloid Polym. Sci. 276 169-175 (1998b).
- [36] Hu, Y. and E. F. Matthys, “Characterization of micellar structure dynamics for a drag reducing surfactant solution under shear: normal stress studies and flow geometry effects,” Rheol. Acta 34, 450-460 (1995).
- [37] Hu, Y., and E. F. Matthys, “The effects of salts on the rheological characteristics of a drag-reducing cationic surfactant solution with shear-induced micellar structures,” Rheol. Acta 35, 470-480 (1996).
- [38] Hu, Y. T., P. Boltenhagen, and D. J. Pine, “Shear thickening in low concentration solutions of wormlike micelles I. Direct visualization of transient behavior and phase transitions,” J. Rheol. 42, 1185-1208 (1998).
- [39] Hunter, R. J., Foundations of colloid science (Oxford, New York, 2001).
- [40] Imae, T., R. Kamiya, and S. Ikeda, “Formation of spherical and rod-like micelles of cetyltrimethylammonium bromide in aqueous NaBr solutions,” J. Colloid Interface Sci. 108, 215-225 (1985).
- [41] Imae, T., and S. Ikeda, “Sphere-rod transition of micelles of tetradecyltrimethylammonium halides in aqueous sodium halide solutions and flexibility and entanglement of long rodlike micelles,” J. Phys. Chem. 90, 5216-5223 (1986).
- [42] Jana, T., M. H. Rahman, and A. Nandi, “Conversion of colloidal aggregates into polymer networks on aging,” Colloid Polym. Sci. 282, 555-561 (2004).
- [43] Kim, W., and S. Yang, “Effects of Sodium Salicylate on the microstructure of an aqueous micellar solution and its rheological responses,” J. Colloid Interface Sci. 232, 225-234 (2000).
- [44] Kumaran, V., and R. Muralikrishnan, “Spontaneous growth of fluctuations in the viscous flow of a fluid past a soft interface,” Phys. Rev. Lett. 84, 3310-3313 (2000).
- [45] Kumaran, V., G. H. Fredrickson, and P. Pincus, “Flow induced instability of the interface between a fluid and gel at low Reynolds number,” J. Phys. II 4, 893-911 (1994).
- [46] Lin, Z., L. E. Scriven, and H. T. Davis, “Cryogenic electron microscopy of rodlike or wormlike micelles in aqueous solutions of nonionic surfactant hexaethylene glycol monohexadecyl ether,” Langmuir 8, 2200-2205 (1992).
- [47] Lin, Z., J. J. Cai, L. E. Scriven, and H. T. Davis, “Spherical-to-wormlike micelle transition in CTAB solutions,” J. Phys. Chem. 98, 5984-5993 (1994).
- [48] Lin, Z., B. Lu, J. L. Zakin, Y. Talmon, Y. Zheng, H. T. Davis, and L. E. Scriven, “Influence of surfactant concentration and counterion to surfactant ratio on rheology of wormlike micelles,” J. Colloid Interf. Sci. 239, 543-554 (2001).
- [49] Liu, C., and D. J. Pine, “Shear induced gelation and fracture in micellar solutions.,” Phys. Rev. Lett. 77, 2121-2124 (1996).
- [50] Macías, E. R., F. Bautista, J. F. A. Soltero, J. E. Puig, P. Attané, and O. Manero, “On the Shear thickening flow of dilute CTAT worm-like micellar solutions,” J. Rheol. 47, 643-658 (2003).
- [51] MacKintosh, F. C., S. A. Safran, and P. A. Pincus, “Equilibrium size distribution of charged ’living’ polymers,” J. Phys. Condensed Matter 2, SA359-SA364 (1990).
- [52] McLeish, T. C. B., and R. C. Ball, “A Molecular Approach to the spurt effect in polymer melt flow,” J. Polym. Sci. Pol. Phys. 24, 1735-1745 (1986).
- [53] McLeish, T. C. B., “Stability of the interface between two dynamic phases in capillary flow of linear polymer melts,” J. Polym. Sci. B Polymer Physics 25, 2253-2264 (1987).
- [54] Mohan, V., L. Gupta, and D. T. Wasan, “Effect of aging on surface shear viscosity of surfactant solutions,” J. Colloid Interface Sci 57, 496-504 (1976).
- [55] Muralikrishnan, R., and V. Kumaran, “Experimental study of the instability of the viscous flow past a flexible surface,” Phys. Fluids 14, 775-780 (2002).
- [56] Myska, J., and V. Mik, “Degradation of surfactant solutions by age and by flow singularity,” Chem. Eng. Process 43, 1495-1501 (2004).
- [57] Nowak, M., “Elastic properties of a dilute surfactant solution in the shear induced state,” Rheol. Acta 40, 366-372 (2001).
- [58] Oelschlaeger, Cl., G. Waton, E. Buhler, S. J. Candau, and M. E. Cates, “Rheological and Light scattering studies of cationic fluorocarbon surfactant solutions at low ionic strength,” Langmuir 18, 3076-3085 (2002).
- [59] Ouchi, M., T. Takahashi, and M. Shirakashi, “Shear-induced structure change and flow-instability in start-up Couette flow of aqueous, wormlike micelle solution,” J. Rheol. 50, 341-352 (2006).
- [60] Prtzl, B., and J. Springer, “Light scattering experiments on shear induced structures of micellar solutions,” J. Colloid Interface Sci. 190, 327-333 (1997).
- [61] Rehage, H., and H. Hoffmann, “Viscoelastic surfactant solutions: Model systems for rheological research,” Mol. Phys. 74, 933-973 (1991).
- [62] Rothstein, J. P., “Transient extensional rheology of wormlike micelle solutions,” J. Rheol. 47, 1227-1247 (2003).
- [63] Russel, W. B., D. A. Saville and W. R. Schowalter, Colloidal Dispersions (Cambridge University Press, Cambridge, 1989).
- [64] Shankar, V., and S. Kumar, “Instability of viscoelastic plane couette flow past a deformable wall,” J. Non-Newtonian Fluid Mech. 116, 371-393 (2004).
- [65] Shen, A., M. Vasudevan, C. Lee, Y. Wang, G. Z. Cao, and R. Sureshkumar, “Hydrodynamics and rheology effects in processing of micellar fluids in nanomaterials manufacturing,” in Soft Nanomaterials, edited by H.S. Nalwa (American Scientific Publishers, in press, 2007).
- [66] Shikata, T., M. Shiokawa, S. Itatani, and S. Imai, “Viscoelastic behavior of aqueous surfactant micellar solutions,” Korea-Aust. Rheol. J. 14, 129-138, (2002).
- [67] Shikata, T., Y. Sakaiguchi, H. Uragami, A. Tamura, and H. Hirata, “Enormously elongated cationic surfactant micelle formed in CTAB-Aromatic additive systems,” J. Colloid Interface Sci. 119, 291-293, (1987a).
- [68] Shikata, T., H. Hirata, and T. Kotaka, “Micelle formation of detergent molecules in aqueous media Viscoelastic properties of aqueous cetyltrimethylammonium bromide solutions,” Langmuir 3, 1081-1086, (1987b).
- [69] Shikata, T., H. Hirata, and T. Kotaka, “Micelle formation of detergent molecules in aqueous media 2. Role of free salicylate ions on viscoelastic properties of aqueous cetyltrimethylammonium bromide - Sodium Salicylate solutions,” Langmuir 4, 354-359, (1988).
- [70] Shikata, T., S. J. Dahman, and D. S. Pearson, “Rheo-optical behavior of wormlike micelles,” Langmuir 10, 3470-3476 (1994).
- [71] Shukla, A., R. Fuchs, and H. Rehage, “Quasi-anomalous diffusion processes in entangled solutions of wormlike surfactant micelles,” Langmuir 22, 3000-3006 (2006).
- [72] Tardos, Th. F., Surfactants (Academic Press, London, 1984).
- [73] Teixeira, R. E., H. P. Babcock, E. S. G. Shaqfeh, and S. Chu, “Shear thinning and tumbling dynamics of single polymers in the flow-gradient plane,” Macromolecules 38, 581-592 (2005).
- [74] Tsujii, K., Surface Activity:Principles, Phenomena, and Applications (Academic Press, London, 1998).
- [75] Wheeler, E. K., P. Fischer, and G. G. Fuller, “Time-periodic flow induced structures and instabilities in a viscoelastic surfactant solution,” J. Non-Newtonian Fluid Mech. 75, 193-208 (1998).
- [76] Wunderlich, I., Hoffmann H., Rehage H., “Flow birefringence and rheological measurements on shear induced micellar structures,” Rheol. Acta., 26, 532-542 (1987).
- [77] Zana, R., Surfactant Solutions:New methods of investigation (Mercel Dekker, NewYork, 1987).
- [78]