Size Effects in the Magnetoresistance of Graphite: Absence of Magnetoresistance in Micrometer size Samples
Abstract
We present a study of the magnetoresistance of highly oriented pyrolytic graphite (HOPG) as a function of the sample size. Our results show unequivocally that the magnetoresistance reduces with the sample size even for samples of hundreds of micrometers size. This sample size effect is due the large mean free path and Fermi wavelength of carriers in graphite and may explain the observed practically absence of magnetoresistance in micrometer confined small graphene samples where quantum effects should be at hand. These were not taken into account in the literature yet and ask for a revision of experimental and theoretical work on graphite.
pacs:
81.05.Uw,72.20-My,72.80.CwGraphitic systems are nowadays a field of intensive activity Kopelevich et al. (2003a). There have been observations of quantum Hall effect in HOPG Kopelevich et al. (2003b); Ocaña et al. (2003) as well as very large anisotropy in the electrical conductance (ratio between current parallel to perpendicular to the graphene planes) larger than at room temperatureKopelevich et al. (2003a). Graphite looks as a good conductor in plane and an insulator between planes leading to a weak screening to external electric fields González et al. (2001). This means that an external electric field penetrates by tens of nanometers in graphite, in contrast to a normal metal where the field is screened in the first atomic layers. In fact the dielectric constant of graphite at optical frequencies is positive, insulator like () Hoinkes (1980); García et al. (1980). Electric field microscopyLu et al. (2006) detects that regions of graphite are more insulating than others upon the interconnections of graphite planes produced by defects and their overall density that influences the density of states and the Fermi level. The material exhibits a huge magnetic field driven metal-insulator transitionKempa et al. (2000); Kopelevich et al. (2003a). Its band structure and interband transitions with electron and hole carriers manifest in a huge ordinary magnetoresistance (OMR)Kopelevich et al. (2003b); Zhi-Ming et al. (2007). All these effects happen in macroscopic size samples of the order of millimeters.
A large research activity has been recently started on a few graphene layers (FLG) Katsnelson (2007) with typical size of a few microns. Strikingly, the OMR in FLG samples is practically suppressed even at K, in contrast to bulk HOPG or Kish graphite where the OMR is at T at low temperatures Kopelevich et al. (2003a). Earlier work with graphite samples in the micrometer range showed similar behavior Dujardin et al. (2001); Zhang et al. (2004). However, the question on what happens when the graphite sample size is reduced has not been correctly addressed and the experimental data may need a new interpretation. The size of the sample is very important for defining the properties of the system because the de-Broglie wavelength for massless Dirac fermions (m/s is the Fermi velocity and a typical Fermi energy K) or for massive carriers with effective mass , , as well as the Fermi wavelength are of the order of microns or larger due to the low density of Dirac and massive fermions. Moreover, one can show that in such micron size systems new quantum mechanical oscillations appear as fine structure superimposed to the usual Schubnikov de-Haas (SdH) magnetoresistive oscillationsGarcía , an experimentally observed but not yet recognized fact Luk’yanchuk and Kopelevich (2004); Novoselov et al. (2004, 2005); Zhang et al. (2005). The aim of this paper is to analyze experimentally the behavior of the OMR in HOPG samples upon their macroscopic size and the effects of a constrained region. We found that the smaller the size of a sample or constraint the smaller is the OMR. Surprisingly, the effect is already noticeable at large sample sizes, hundred of microns.
In order to carry out a systematic study we have performed experiments in different HOPG samples from Advanced Ceramics or Structure Probe Inc. with mosaicities and . The smaller the mosaicity the more ordered is the sample. The results presented in this letter are from HOPG samples with mosaicities of and . Results for larger mosaicity will be presented elsewhere. The advantage of using HOPG of good quality is that due to the perfection of the graphene layers and low coupling between them, a low two-dimensional carrier density cm-2 is obtained Kopelevich et al. (2003b); Luk’yanchuk and Kopelevich (2004). This value is much smaller than in typical FLG’s probably due to lattice defects generated by the used method to produce FLG samples and/or surface doping. Other advantage of using HOPG samples is that the preparation procedure for macroscopic sample size (from mm to m) is rather simple enhancing the reproducibility and also the possibilities of checking different geometries.
The graphite samples of thickness between m and m were prepared by peeling from HOPG using double sided tape. The samples were then glued with varnish onto silicon substrates. Electrical contacts were made by using silver loaded cryogenic epoxy in the usual four-point arrangement for resistance measurements. The current applied was between A to 100 mA. The sample width was reduced by cutting the sample with a diamond tip (wide cuts). Also we changed the voltage electrode distance without changing the sample size. For small constrictions we used a FEI Novalab 200 dual beam scanning electron microscope (SEM) with a crossing focus ion beam (FIB). This set up allows us defined production of rectangular constraints of different lengths and widths between the voltage electrodes and studied their influence on the OMR. We have produced constrictions of micrometer size and not in the nanometer range because we are interested to know at what sample size or constriction width one starts observing size effects. Part of the experimental studies were done at room temperature and 77 K and a few samples were cooled down to 4 K. The magnetic field was applied always perpendicular to the graphene planes of the HOPG samples.
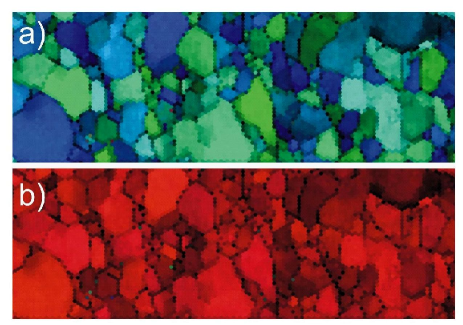
Electron backscattering diffraction (EBSD) was performed with a commercially available device (Ametek-TSL). In this set up the sample under investigation was illuminated by the SEM beam and the diffracted electrons were detected by a fluorescence screen and a digital camera. The TSL software was used to calculate the orientation of the HOPG surface as function of the electron beam position. Figures 1(a) and (b) show the same m2 area of a HOPG sample. Figure 1(b) shows the distribution of the c-axis of the hexagonal unit cell at the graphite surface depicted by the spreading of the (red) color. The grain distribution can be also seen in Fig. 1(a) where the in-plane orientation is recognized by the (blue-green) color distribution. In Fig. 1 we see that the typical crystal size in HOPG () is of the order of micrometers.
Taking into account this fact and that upon defect concentration in the crystals and their influence on the effective carrier density m, we expect that size effects might be seen at relatively large sample or constriction size. This should be in principle possible also because the electron mean free path m in HOPG, taking into account a mobility cm2/Vs measured in samples of low mosaicity Sercheli et al. (2002), a value much larger than those found in typical FLG. All these numbers already suggest a situation very different from that found in metals, where size effects in the magnetoresistance may start to be seen when the sample size reduces to nm or less.

Figure 2 shows the dependence of the OMR defined as T) with the sample width measured at 300 K and 77 K (right axis). Note that the sample width changes between 1 cm and m. The OMR clearly decreases from for a macroscopic sample to for a still relatively large constricted sample of m. The data ) also indicate that the OMR tends to saturate for a sample width above m. In Fig. 2 there are points for another HOPG sample prepared similarly, which shows the same trend. The decrease of OMR is also clearly observed at 77 K (). This result is quite spectacular because the reduction is a factor of 2 at 300 K and nearly a factor 10 at 77 K, even if the sizes are times the (estimated) mean free path or the Fermi wavelength. One may speculate that due to the method used to reduce the width of the sample we are introducing defects and this is the reason for the observed decrease of the OMR. To check that this is not the case we have done two more experiments that are described below. The reason is that by reducing temperature the mean free path increases and quantum, non-classical effects start to affect larger areas of the sample. Note that graphite has Dirac and massive electrons and the former have a tremendously large mean free path (several tens of microns) and these are likely the ones that reduce the OMR at large sample size.
In the same Fig. 2 we show the change of OMR at 300 K for a HOPG sample changing only the distance between voltage electrodes from cm to m ). The same tendency is observed, i.e. the OMR decreases nearly logarithmical with the sample width or electrode distance. This phenomenon is also observed if we produce a rectangular constraint of small length m, much smaller than the sample width m, and located at the middle between the voltage electrodes (distance m) on a HOPG sample (. The constraint length is so small that in principle one does not expect any change in the OMR. In fact, at 270 K the value obtained for the OMR for this sample is , in agreement with the data shown in Fig. 2, and remains independent of the width of the narrow-constraint. In other words at this temperature we measure the OMR coming from the sample bulk. The inset in Fig. 2 shows the parabolic behavior of the OMR at 270 K for the sample with a constraint-width of m; this relationship remains independent of the constraint-width in the measured range.
However, at lower temperatures, due to the increase of the mean free path the influence of the constraint might be not negligible anymore. In agreement with this expectation we observed a clear dependence of the OMR with constraint width at 4 K, see Fig. 3. The inset in this figure shows the magnetoresistance defined as the resistance ratio vs. the width of the constraint where a logarithmic dependence is clearly observable.
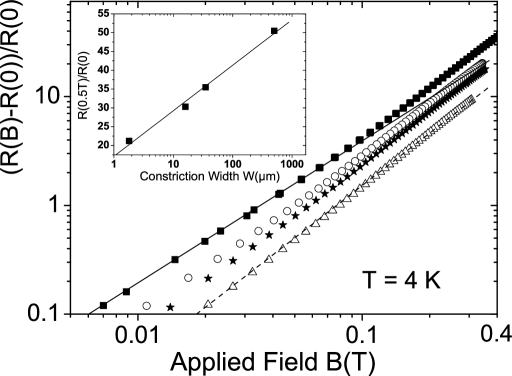
Two important details of these results are worth to mention. The observed influence of the constraint remains even for macroscopic large widths, see inset in Fig. 3. Note that the measured magnetoresistance is given by two contributions, one coming from the sample bulk, which remains as a constant background, and the other due to the influence of the constraint. This explains the still relatively large OMR observed for constraint width of the order of m.
All the results presented above point out to phenomena that in a metal do not happen at least at the scale of the graphite samples. Our results show that reducing the sample size the OMR reduces. If we extrapolate the overall sample size to a few micrometers or below we expect a negligible OMR, as has been experimentally observed for graphite samples of size of the order of m to less than 100 nm Dujardin et al. (2001); Zhang et al. (2004). Classical theory may not be applicable when the coherence length, mean free path, and the Fermi wavelength of the carriers are of the order of microns, the sample size. In these conditions Boltzmann s transport theory may not be a good approximation and all kind of finite size effects should appear. Strictly speaking we should ask: What is the meaning of the classical cyclotron radius m at T when the wavelength of the electrons m? The Onsager quantization that gives rise to the de-Haas-van Halphen and SdH oscillations needs to be also reconsidered because now the wavevector might not be a continuum, etc.
The reported OMR data in FLG indicate practically the absence of OMR Novoselov et al. (2004, 2005); Zhang et al. (2005) in comparison with that observed in bulk HOPG, which is of the order of 5000% at T at low temperatures. The sample size in the experiments with FLG’s is what strongly reduces the OMR and not their thickness. In fact, we have done experiments with HOPG samples of different thicknesses, from 1 mm to m. Our results show clearly that reducing the thickness the OMR increases.
There is still a behavior that we would like to remark about the OMR. At 270 K the OMR increases quadratically with field (see inset in Fig. 2) while at temperatures below K it behaves quasi linearly (see, for example, Fig. 3). This is an experimental fact that is well know for graphite and other semimetals. Abrikosov Abrikosov (1999, 2000) suggested that this phenomena takes place in the Landau level quantization regime of the Dirac fermion system, i.e. above a certain minimum field. However, the fact that this quasi linear OMR is also observed at very low fields (T, see for example the data in Fig. 3) casts doubts about this interpretation. Our explanation is again in term of electron coherence and the role played by the platelets of m size approximately conforming HOPG (see Fig.1). When the mean free path of the electrons is larger than the platelets then electrons reflect and are being transmitted coherently at the borders of the platelets and quantum currents circulate creating Hall-like potentials. This circulation of quantum currents at the platelets edges (see Fig. 1) produce a quasi linear behaviour with field of the OMR. A similar picture has been discussed to interpret experiments done with a Corbino disk geometry in HOPG Kempa et al. (2006) and disordered semiconductors Parish and Littlewood (2003). This is the same thing that happens in optics with the reflection of waves between different media with the addition that some Dirac electron existing in graphite are dispersionless as photons. At room temperature the mean free path is smaller than the platelets size and the quantum currents at the border of the platelets do no exist. In this case we recover the classical parabolic ohmic behavior of the OMR. This appears to be the explanation for the two regimes of OMR at low and high . The OMR 4 K-data for different constraint widths shown in Fig. 3 indicate that the low-field slope increases (from 1.2 to 1.7) decreasing the size of the constraint. This behavior is due to electron localization at small fields that shows a OMR dependence of the type . The change of slope in Fig. 3 is a clear manifestation of this effect. Localization effects are reflected also in a noise behavior of the OMR at low fields.
In conclusion, our studies reveal a rather spectacular size effect in the transport properties of graphite, specially in its magnetoresistance. The influence is observable up to macroscopic sample size of the order of several hundreds of micrometers. We suggest that this is due to the extremely large coherent and Fermi wavelength of the carriers (Dirac as well as massive electrons) in graphite. It seems clear that when the sample size is of the order of the Fermi wavelength and smaller than the carriers mean free path the classical Boltzmann transport theory becomes gradually not valid. In particular for these sizes the wavevector of the carriers might conform a discrete set of quantum numbers and therefore the quantization of orbits requires to have this into account. Our observations provide a possible answer to the practically absence of OMR in FLG’s reported in the literature.
This work was done with the support of the DFG under ES 86/11 and of the Spanish CAICyT. One of us (J.B-Q.) is supported by the EU.
References
- Kopelevich et al. (2003a) Y. Kopelevich, P. Esquinazi, J. H. S. Torres, R. R. da Silva, and H. Kempa, Advances in Solid State Physics 43, 207 (2003a).
- Kopelevich et al. (2003b) Y. Kopelevich, J. H. S. Torres, R. R. da Silva, F. Mrowka, H. Kempa, and P. Esquinazi, Phys. Rev. Lett. 90, 156402 (2003b).
- Ocaña et al. (2003) R. Ocaña, P. Esquinazi, H. Kempa, J. Torres, and Y. Kopelevich, Phys. Rev. B 68, 165408 (2003).
- González et al. (2001) J. González, F. Guinea, and M. A. H. Vozmediano, Phys. Rev. B 63, 134421 (2001).
- Hoinkes (1980) H. Hoinkes, Rev. Mod. Phys. 52, 933 (1980).
- García et al. (1980) N. García, W. E. Carlos, M. W. Cole, and V. Celli, Phys. Rev. B 21, 1636 (1980).
- Lu et al. (2006) Y. Lu, M. Muñoz, C. S. Steplecaru, C. Hao, M. Bai, N. García, K. Schindler, and P. Esquinazi, Phys. Rev. Lett. 97, 076805 (2006).
- Kempa et al. (2000) H. Kempa, Y. Kopelevich, F. Mrowka, A. Setzer, J. H. S. Torres, R. Höhne, and P. Esquinazi, Solid State Commun. 115, 539 (2000).
- Zhi-Ming et al. (2007) W. Zhi-Ming, X. Ding-Yu, Z. Shi-Yuan, X. Qing-Yu, M. VanBael, and D. You-Wei, Chin. Phys. Lett. 24, 199 (2007).
- Katsnelson (2007) M. I. Katsnelson, Materialstoday 10, 20 (2007).
- Dujardin et al. (2001) E. Dujardin, T. Thio, H. Lezec, and T. W. Ebbesen, Appl. Phys. Lett. 79, 2474 (2001).
- Zhang et al. (2004) X. Zhang, Q. Z. Xue, and D. D. Zhu, Phys. Lett. A 320, 471 (2004).
- (13) N. García, http://arxiv.org/find/cond-mat/0706.0135, to be published.
- Luk’yanchuk and Kopelevich (2004) I. A. Luk’yanchuk and Y. Kopelevich, Phys. Rev. Lett. 93, 166402 (2004).
- Novoselov et al. (2004) K. S. Novoselov, A. K. Geim, S. V. Morozov, S. V. Dubonos, Y. Zhang, and D. Jiang, Science 306, 666 (2004).
- Novoselov et al. (2005) K. S. Novoselov, A. K. Geim, S. V. Morozov, S. V. Dubonos, Y. Zhang, and D. Jiang, Nature 438, 197 (2005).
- Zhang et al. (2005) Y. Zhang, Y.-W. Tan, H. Störmer, and P. Kim, Nature 438, 201 (2005).
- Sercheli et al. (2002) M. S. Sercheli, Y. Kopelevich, R. R. da Silva, J. Torres, and C. Rettori, Solid State Commun. 121, 579 (2002).
- Abrikosov (1999) A. A. Abrikosov, Phys. Rev. B 60, 4231 (1999).
- Abrikosov (2000) A. A. Abrikosov, Europhys. Lett. 49, 789 (2000).
- Kempa et al. (2006) H. Kempa, P. Esquinazi, and Y. Kopelevich, Solid State Communication 138, 118 (2006).
- Parish and Littlewood (2003) M. M. Parish and P. B. Littlewood, Nature 426, 162 (2003).