11email: eugenio.carretta, angela.bragaglia @oabo.inaf.it 22institutetext: INAF-Osservatorio Astronomico di Padova, vicolo Osservatorio 5, I-35122 Padova, Italy
22email: raffaele.gratton@oapd.inaf.it
The chemical abundance of the very metal rich old Open Clusters NGC 6253 and NGC 6791††thanks: Based on observations made at ESO telescopes under programmes 67.D-0018, 169.D-0473 and with the Italian Telescopio Nazionale Galileo (TNG) operated on the island of La Palma by the Fundación Galileo Galilei of the INAF (Istituto Nazionale di Astrofisica) at the Spanish Observatorio del Roque de los Muchachos of the Instituto de Astrofisica de Canarias
Abstract
Aims. In the framework of a project aiming at deriving in a homogeneous way the properties (age, distance, reddening and detailed chemical abundances) of a large sample of old open clusters, we present here the metal abundance and the abundance ratios of light (C, N, O, Na, Mg, Al, Si, Ca, Ti) and heavier (Cr, Mn, Ni, Ba, Eu) elements in the galactic open clusters NGC 6253 and NGC 6791.
Methods. We performed spectrum synthesis of selected lines on high resolution spectra of four red clump stars in NGC 6253, taken with the UVES and FEROS spectrographs. We also determined abundances of the same elements for four red clump stars in NGC 6791, observed with SARG, for which we had derived the atmospheric parameters and the iron, carbon and oxygen abundances in a previous paper (Gratton et al. 2006).
Results. The average metallicity of NGC 6253 is [Fe/H] (rms = 0.03 dex, systematic error = 0.08 dex), obtained by extensive spectral synthesis of Fe lines. This intermediate age cluster closely resembles the old open cluster NGC 6791, as far as the chemical composition is concerned. C, N, O do not show any significant abundance scatter; they are underabundant with respect to the solar values both in NGC 6253 and NGC 6791. We also find no evident star-to-star scatter in any of the elements measured in both clusters, with the possible exception of Na in NGC 6791. The two clusters show very similar abundances, except for Mg, overabundant in NGC 6791 and not in NGC 6253. Both have solar scaled -elements abundances. We have compared our abundance ratios with literature values for disk giants and dwarfs and bulge giants, finding a general good agreement with the run of elemental ratios with [Fe/H] of disk objects.
Key Words.:
Stars: Evolution - Stars: Abundances - Galaxy: Disk - Open clusters and associations: General - Open clusters and associations: individual (NGC 6253, NGC 6791)| ID | RA | Dec | Date | exptime | S/N | RV | Notes | ||||
|---|---|---|---|---|---|---|---|---|---|---|---|
| ( ) | ( ) | (s) | (km s-1) | ||||||||
| 2509 | 16 59 15.91 | -52 42 26.7 | 2002-07-16 | 1800 | 120 | 12.685 | 1.314 | 10.206 | 9.428 | -28.71 | UVES |
| 2885 | 16 58 53.28 | -52 41 54.4 | 2002-07-19 | 2400 | 180 | 12.656 | 1.352 | 10.121 | 9.296 | -28.13 | UVES |
| 4510 | 16 59 06.03 | -52 39 56.6 | 2002-07-19 | 1800 | 150 | 12.759 | 1.296 | 10.279 | 9.470 | -27.44 | UVES |
| 2508 | 16 59 03.78 | -52 42 25.9 | 2001-04-26 | 24200 | 85 | 12.685 | 1.284 | 10.252 | 9.450 | -20.60 | FEROS, bin? |
| 3595 | 16 59 05.80 | -52 41 04.9 | 2001-04-25 | 24200 | 85 | 12.388 | 1.292 | 9.951 | 9.192 | -28.76 | FEROS |
1 Introduction
This is the fifth paper of the spectroscopic part of the Bologna Open Cluster Chemical Evolution (BOCCE) project (see Bragaglia & Tosi 2006, Carretta et al. 2004, 2005), aimed at deriving with the best attainable homogeneity reddening, age and metallicity for a sample of old OCs in order to define the metallicity distribution in the disk and its (possible) evolution with time. We concentrate here on the two very metal rich clusters NGC 6253 and NGC 6791, and present a first detailed abundance analysis based on high S/N, high resolution spectra of red clump stars in NGC 6253 and the follow-up of the work in Gratton et al. (2006, hereafter G06) on NGC 6791.
We selected the cluster NGC 6253 as relevant in determining the presence and slope of the disk radial abundance gradient since it is one of the known OC with smaller galactocentric distance and its metallicity is very high. We have recently re-analyzed (Bragaglia & Tosi 2006) the cluster photometric data with updated evolutionary tracks and confirmed the findings in Bragaglia et al. (1997). From comparison of synthetic CMDs to the observed ones, NGC 6253 has RGC = 6.6 kpc, Z=0.05 and age=3 Gyr. Other papers on this cluster were published by Piatti et al. (1998) and Sagar et al. (2001) based on broad-band photometry, by Twarog et al. (2003 - with results recently revised in Anthony-Twarog et al. 2007) based on Strömgren photometry, by Carretta et al. (2000) and Sestito et al. (2007) based on high resolution spectroscopy. The high metallicity of NGC 6791 has been acknowledged for some time (e.g., Peterson & Green 1998 and Chaboyer et al. 1999, based on spectroscopy and photometry, respectively) and has been confirmed by several very recent works: our own paper (G06, high resolution optical spectroscopy), Carraro et al. (2006, high resolution optical spectroscopy), Origlia et al. (2006, high resolution infrared spectroscopy) and Anthony-Twarog et al. (2007, Strömgren photometry). More details on these works will be presented in Section 5.
Cool stars, like the ones studied here, and high metal abundance conspire to produce very crowded spectra that are better examined by spectrum synthesis than with the classical abundance analysis based on equivalent widths, even at the quite high resolution of the FEROS and UVES spectra, R45000, considered in the present paper. The present analysis is hence done in the same way as the one for NGC 6791 (G06), i.e. employing extensive synthesis of selected features.
The paper is organized as follows: the data are described in Sect. 2, metallicity determination is discussed in Sect. 3, while abundances of other elements are presented in Sect. 4 for NGC 6253 and for NGC 6791. Sect. 5 presents a comparison to literature data on these two OCs and field stars; a discussion and summary are given in Sect. 6.
2 Observations and data reduction
NGC 6253:
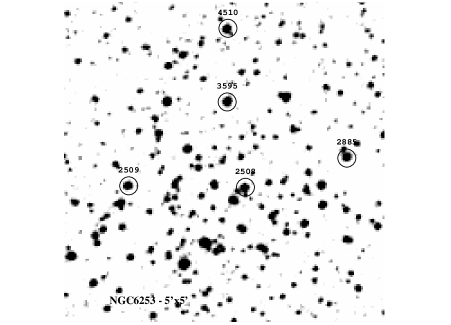
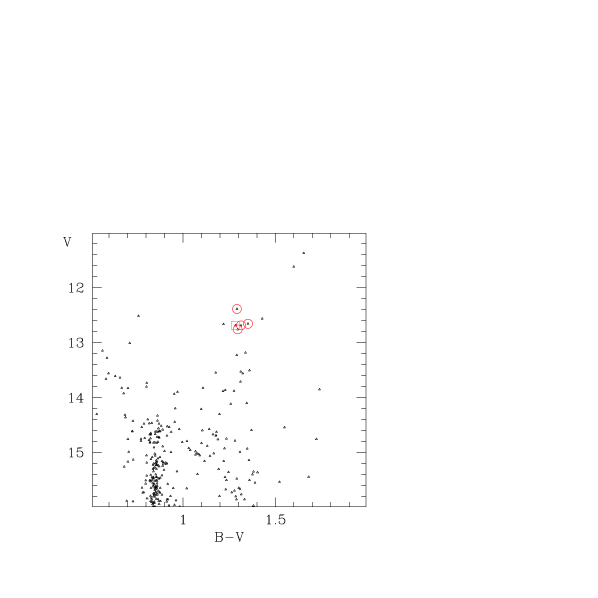
As done for the other clusters of the BOCCE sample, our targets in NGC 6253 were chosen among Red Clump (RC) stars, using the photometry by Bragaglia et al. (1997). The targets lie near the cluster centre and their positions are shown in Fig. 1. Fig. 2 displays the cluster CMD with the five targets indicated by larger symbols. Identifications, celestial coordinates (J2000), photometry and details on the observations are presented in Table 1.

Observations for stars 2508 and 3595 were obtained with FEROS, a high resolution fiber-fed spectrograph at the time mounted on the 1.5m ESO telescope in La Silla, on 2001 April 25 and 26 (programme 67.D-0018). The wavelength range is 3700-8600 Å, at R=48000. Two exposures were obtained for each star and the individual spectra were reduced using the data reduction package installed at the telescope and later summed. Stars 2509, 2885, and 4510 were observed using UVES on the ESO VLT (Unit 2), on 2002 July 16 and 19 (as a backup during programme 169.D-0473); a single exposure was obtained for each star. The spectra cover the wavelength ranges 3560-4840 and 5710-9320 Å, at R=43000. They were reduced with the standard pipeline.
We measured radial velocities (RVs) for each individual spectrum using several tens of metallic lines; the resulting heliocentric RVs are listed in Table 1; their errors are less than about 1 km s-1.
NGC 6791:
Four RC stars in the very old (about 9 Gyr, King et al. 2005), very metal rich ([Fe/H], according to G06) open cluster NGC 6791 were obtained with SARG at the 3.5m Italian telescope Galileo at a slightly lower resolution (R30000) and S/N (60 on average) than those considered for NGC 6253. The grating used covers the wavelength range 4595-6170 and 6240-7900 Å; however only the central interval (5000-6500 Å) was considered of good enough quality to be used in the analysis. We recall here that the RC in NGC 6791 is -apparently- much fainter than that of NGC 6253, due to the larger distance; typical magnitudes and colours are , and . Details on observations and reductions, coordinates and magnitudes, etc. can be found in G06.
3 Abundance analysis
3.1 Stellar parameters
The required atmospheric parameters for the stars in NGC 6253 were derived from the photometry. Effective temperatures () and surface gravities () were derived from the colour calibrations for temperature and bolometric corrections by Alonso et al. (1999), using the , visual photometry by Bragaglia et al. (1997) and the , infrared photometry by 2MASS (Skrutskie et al. 2006). In the derivation of atmospheric parameters we adopted , E=0.23, mass=1.4 M⊙ from Bragaglia & Tosi (2006). We also assumed [Fe/H]=+0.2 since the latter represents the high-metallicity limit for the Alonso et al. calibration. However, the negligible dependency of the colour on metallicity ensures that we are not committing a significant error in the case of the stars of NGC 6253, as also stated by Alonso et al. (sect. 2.3), who consider as the best temperature indicator for giant stars, since an error of 0.5 dex in metallicity translates in and error of at most 0.7% in . The microturbulent velocities () were computed using the relation with presented in Carretta et al. (2004). The resulting atmospheric parameters are listed in Table 2.
We estimated the error in and due to our choice of distance and reddening as follows. The ranges covered in literature for these parameters are rather small: =11.00.25 and E=0.230.03. A variation of 0.03 in E translates into about 70 K when is derived by , while a variation of 0.25 in distance modulus translates into 0.1 dex in . These are the major error sources in both these parameters; we do not have any indication of errors larger than those estimated from our abundance analysis (see Sect. 3.2).
Atmospheric parameters for the four RC star in NGC 6791 are taken from G06 (their Table 3) where a detailed description can be found; we report them in Table 2 for convenience. They were derived in the same way as in NGC 6253, adopting =13.45 and E=0.15 (as average of the literature values) and mass 0.9 M⊙ (for an age of 9 Gyr, e.g., King et al. 2005).
| ID | |||
|---|---|---|---|
| K | km s-1 | ||
| NGC 6253 | |||
| 2509 | 4518 | 2.45 | 1.18 |
| 2885 | 4438 | 2.39 | 1.19 |
| 4510 | 4492 | 2.47 | 1.18 |
| 2508 | 4536 | 2.47 | 1.18 |
| 3595 | 4568 | 2.37 | 1.19 |
| NGC 6791 | |||
| 2014 | 4463 | 2.30 | 1.05 |
| 3009 | 4473 | 2.33 | 1.05 |
| 3019 | 4468 | 2.35 | 1.05 |
| SE49 | 4512 | 2.32 | 1.05 |
| Wavelength | EPlow | |||||||
| Å | eV | 2509 | 2885 | 4510 | 3595 | mean | rms | |
| Fe i | ||||||||
| 5560.22 | 4.43 | -1.10 | 7.94 | 7.94 | ||||
| 5577.03 | 5.03 | -1.49 | 7.89 | 7.89 | ||||
| 5618.64 | 4.21 | -1.34 | 7.94 | 7.94 | ||||
| 5619.61 | 4.39 | -1.49 | 7.94 | 7.94 | ||||
| 5651.48 | 4.47 | -1.79 | 7.94 | 7.94 | ||||
| 5661.35 | 4.28 | -1.83 | 7.94 | 7.94 | ||||
| 6065.49 | 2.61 | -1.53 | 8.04 | 7.94 | 7.92 | 7.84 | 7.94 | 0.08 |
| 6078.50 | 4.80 | -0.48 | 8.14 | 8.14 | 8.09 | 8.16 | 8.13 | 0.03 |
| 6079.02 | 4.65 | -0.95 | 7.99 | 8.12 | 7.84 | 8.12 | 8.02 | 0.13 |
| 6089.57 | 4.58 | -1.28 | 7.84 | 7.79 | 7.76 | 7.80 | 0.04 | |
| 6093.65 | 4.61 | -1.32 | 7.94 | 7.89 | 7.76 | 8.04 | 7.91 | 0.12 |
| 6094.38 | 4.65 | -1.56 | 7.93 | 7.84 | 7.82 | 7.86 | 0.06 | |
| 6096.67 | 3.98 | -1.77 | 7.94 | 8.14 | 8.04 | 8.02 | 8.04 | 0.08 |
| 6097.09 | 2.18 | -5.01 | 7.84 | 7.84 | 7.84 | 7.84 | 0.00 | |
| 6151.62 | 2.18 | -3.30 | 7.94 | 8.14 | 7.94 | 8.14 | 8.04 | 0.12 |
| 6165.36 | 4.14 | -1.50 | 7.94 | 8.12 | 8.02 | 7.94 | 8.01 | 0.09 |
| 6232.65 | 3.65 | -1.22 | 8.04 | 8.14 | 7.94 | 7.94 | 8.02 | 0.10 |
| 6246.33 | 3.60 | -0.73 | 7.99 | 7.94 | 7.92 | 8.02 | 7.97 | 0.05 |
| 6252.56 | 2.40 | -1.69 | 7.89 | 7.94 | 7.84 | 8.12 | 7.95 | 0.12 |
| 6270.23 | 2.86 | -2.46 | 8.12 | 8.14 | 7.94 | 8.07 | 0.11 | |
| 6297.80 | 2.22 | -2.74 | 8.04 | 8.12 | 8.04 | 8.12 | 8.08 | 0.05 |
| 6301.51 | 3.65 | -0.72 | 8.04 | 8.04 | 8.04 | 7.96 | 8.02 | 0.04 |
| 6392.54 | 2.28 | -3.97 | 8.04 | 8.12 | 7.93 | 7.94 | 8.01 | 0.09 |
| 6393.61 | 2.43 | -1.43 | 7.74 | 7.74 | ||||
| 6411.66 | 3.65 | -0.60 | 8.14 | 8.14 | 8.14 | 8.14 | 8.14 | 0.00 |
| 6421.36 | 2.28 | -2.03 | 7.79 | 7.84 | 7.76 | 7.97 | 7.84 | 0.09 |
| 6481.88 | 2.28 | -2.98 | 8.24 | 8.14 | 8.19 | 0.07 | ||
| 6498.95 | 0.96 | -4.66 | 8.14 | 8.14 | ||||
| 6574.25 | 0.99 | -5.00 | ||||||
| 6593.88 | 2.43 | -2.42 | 8.09 | 8.14 | 8.14 | 8.04 | 8.10 | 0.05 |
| 6608.04 | 2.28 | -3.96 | 7.96 | 8.12 | 8.02 | 8.04 | 8.04 | 0.07 |
| 6609.12 | 2.56 | -2.69 | 8.14 | 8.13 | 8.14 | 8.14 | 0.01 | |
| 6703.58 | 2.76 | -3.00 | 7.79 | 7.79 | ||||
| 6713.75 | 4.80 | -1.41 | 7.89 | 7.96 | 7.96 | 7.94 | 0.04 | |
| 6725.36 | 4.10 | -2.21 | 7.94 | 8.14 | 8.04 | 8.02 | 8.04 | 0.08 |
| 6726.67 | 4.61 | -1.10 | 7.94 | 8.04 | 7.99 | 8.12 | 8.02 | 0.08 |
| Fe ii | ||||||||
| 6149.25 | 3.89 | -2.73 | 7.49 | 7.79 | 7.69 | 8.09 | 7.77 | 0.25 |
| 6247.56 | 3.87 | -2.33 | 7.89 | 7.99 | 7.89 | 8.09 | 7.97 | 0.10 |
| 6369.46 | 2.89 | -4.21 | 7.91 | 7.99 | 7.89 | 8.07 | 7.97 | 0.08 |
| 6416.93 | 2.89 | -2.70 | 7.89 | 7.89 | 7.87 | 7.89 | 7.89 | 0.01 |
| 6432.68 | 2.89 | -3.58 | 8.07 | 8.24 | 8.09 | 8.09 | 8.12 | 0.08 |
| 6456.39 | 3.90 | -2.10 | 8.19 | 8.29 | 8.19 | 8.11 | 8.20 | 0.07 |
3.2 Errors
Three kind of errors have to be considered:
Internal errors (the truly random component), that will show up in star-to-star comparisons;
Global errors (originating e.g., from the adopted atmospheric parameters), that affect all stars in a cluster in the same way;
Scale errors (originating e.g., from the solar reference composition, the un-adequacy of model atmospheres, the impact of non-LTE effects), that affect all analyses made in the BOCCE program.
These three kind of errors should be considered separately, because they are estimated using different techniques, and because they have a different impact on the discussion.
Internal errors are related to the star-to-star scatter. Up to now we have found very little evidence of any intrinsic scatter in our analysis of open cluster stars (at variance with the situation of globular cluster stars). Hence, a good check on the accuracy of the internal errors is then the observed star-to-star scatter, or for an individual star the line-to-line scatter.
Global (cluster) errors are the major matter of concern in the BOCCE program, because our goal is to use the open clusters as tracers of Galactic chemical evolution. While residual errors after averaging results for individual stars are not entirely negligible, the major source of these global errors are the adopted atmospheric parameters and their dependence on the interstellar reddening and the distance modulus, derived from photometry, mainly (but not exclusively) from our group. The main problem is the possible degeneracy existing between reddening and metallicity in photometric analyses. However, the cluster metallicity has a dependence on the assumed reddening that is exactly the opposite in the case of a CMD and a spectrum. In the first case, the highest the reddening, the most metal poor the cluster should be; in the second case the adoption of a higher reddening means assuming that the stars are warmer, which leads to a higher metal abundance from the analysis of the spectra. Hence, it is very important that results from the analysis of the CMDs are consistent with those obtained from the spectroscopic analysis.
Finally, we will leave out scale errors for now, not because we believe they are not present, but because they affect only at second order the discussion of the results in the whole BOCCE program, insofar our assumptions (e.g., line lists, model atmospheres, etc) are kept constant throughout our series of papers. This is the main reason we define our procedure as ”homogeneous”. Furthermore, even if these stars are not the brightest ones, we decided to analyze clump stars because they are not very cool and have a limited range of atmospheric parameters in all old open clusters. We think that this is much safer than observing the brightest cluster stars, that are generally very cool, so that concerns on the adequacy of model atmospheres or the impact of non-LTE effects are much more severe.
3.3 Metallicity of NGC 6253 from synthesis of Fe lines
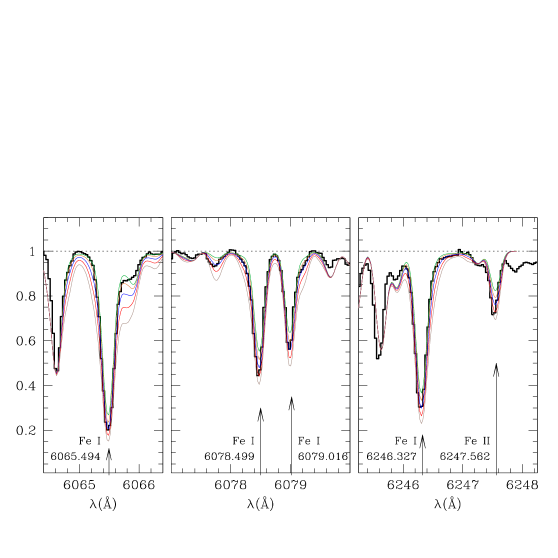
As in G06, we used spectrum synthesis on selected iron lines (Carretta et al. 2004) to derive the metallicity; we considered 36 Fe i and 6 Fe ii lines for the analysis (see Table 3). Holding fixed the , and values appropriate for each star, we extracted the corresponding models from the grid of model atmospheres by Kurucz (1993) with the overshooting option switched on; the model we considered have a solar-scaled mixture of heavy elements. We then generated synthetic spectra in a 2 Å region around each Fe line, by varying the iron abundances from [Fe/H]= to in steps of 0.2 dex. The [Fe/H] value most appropriate for each individual line was derived by best fitting (by eye) the synthetic spectrum to the observed one. This procedure allowed us to supersede the large uncertainties due to blending and alleviated the problem of correct continuum positioning in spectra of rather cool, very metal-rich giant stars. Examples of the fitting are given in Fig. 4.
A detailed description of the line lists used to compute the synthetic spectra is given in both Carretta et al. (2004) and G06 and it will not be repeated here. We only remind that line parameters for iron lines (oscillator strengths and damping broadening in particular) are as in Gratton et al. (2003); they are the same used in previous studies on abundances of old open clusters consistently derived by our group.
In G06 we adopted an estimate of 0.16 dex for the fitting error; this includes random errors due to photometric uncertainties on the line profile and to the estimate of the local continuum level. Using this approach, spectrum normalization is obtained by matching ”high” points in the observed spectrum to corresponding ”high” points in the synthetic spectrum. These high points do not necessarily have the intensity expected for the local continuum since we are using a very extensive line list tested on the very high resolution and S/N spectrum of the extremely line-rich K giant HR 3627 (see Carretta et al. 2004), whose lines are even stronger than in the program stars. Some uncertainty in this normalization procedure is clearly present; this is what we call ”error in the estimate of the local continuum level”. However, the present spectra are of much higher quality than those of NGC 6791, and we consider a better estimate for this error the value of 0.12 dex, the typical line-to-line rms scatter for the four program stars.
Results derived for individual Fe lines are listed in Table 3, expressed as abundances by number111We use the usual spectroscopic notation: log n(A) is the abundance (by number) of the element A in the usual scale where log n(H)=12; [A/H] is the logarithmic ratio of the abundances of elements A and H in the star, minus the same quantity in the Sun. both for Fe i and Fe ii lines. Average metallicities are summarized in Table 4, together with the number of lines used and the rms scatter for each star; in this Table, abundances are referred to the solar abundances adopted in Gratton et al. (2003): (Fe) = 7.54 and 7.49 from neutral and singly ionized lines, respectively. There is a very small scatter in metallicity and no trend as a function of effective temperature. In Table 4 we also give the metallicity of the four stars in NGC 6791 for immediate comparison (from G06, Table 3).
We do not report here the abundances for star 2508, whose spectrum has an RV differing from the average of the four others by about 10 and an abundance lower than the cluster average. This star could be a field interloper, notwithstanding its position on the RC, or a binary. The latter possibility is supported by the different RV we determined in Carretta et al. (2000) for this star ( versus the present km s-1), albeit on spectra of worse quality and with a probable zero point effect of the order of 2 to 3 km s-1. Furthermore, while writing the paper we were informed (S. Desidera and M. Montalto, private communication based on an on-going work on planet search in NGC 6253) that star 2508 has a 92 % probability of being a cluster member, based on its proper motion. Of course, complete confirmation of binarity will require the acquisition of a series of spectra in order to check for RV variations. The lower abundance could be explained by veiling from a secondary component; given the difference in line intensity between star 2508 and the other RC cluster stars (about 10 %), the secondary component should roughly provide a fraction of light of about 0.1, i.e., should be about 2.5 mag fainter, in the observed wavelength range. It could then be a main sequence star, just below the turn-off point. Its contribution makes the primary appear slightly brighter and bluer than single RC stars; taking this into account the primary still has magnitude and colour appropriate for a RC star. Given the larger uncertainties related to the analysis of this star, we have excluded it from further discussion.
Due to the quite similar procedure we used for both clusters (set of line parameters and model atmospheres, derivation of atmospheric parameters, spectrum synthesis technique and package), we adopt the same error budget derived in G06 for NGC 6791 (see their Table 4). The small, not statistically significant, difference [Fe/H]i - [Fe/H]ii dex we found between Fe i and Fe ii would be erased by choosing temperatures about 50 K higher or gravities 0.15 dex lower than those adopted. On the other hand, the trend of abundances with line excitation is [Fe/H]/E.P. = dex/eV, on average. Although not significant, this indicates that temperatures should be by K in order to match the excitation temperature. The conclusion is that these uncertainties are well within those estimated to affect the adopted atmospheric parameters.
In summary, we derive for NGC 6253 a metal abundance [Fe/H], where the first error bar refers to the random part (as estimated from the star-to-star scatter: rms=0.03 dex) and the second term takes into account the systematics due to the assumption of reddening, distance modulus, temperature scale, etc (see Sect. 3.3 in G06).
| ID | nr | [Fe/H] i | nr | [Fe/H] ii | ||
| NGC 6253 | ||||||
| 2509 | 26 | +0.45 | 0.11 | 6 | +0.42 | 0.24 |
| 2885 | 26 | +0.47 | 0.14 | 6 | +0.54 | 0.20 |
| 4510 | 26 | +0.42 | 0.12 | 6 | +0.45 | 0.18 |
| 3595 | 27 | +0.48 | 0.09 | 6 | +0.57 | 0.08 |
| NGC 6791 | ||||||
| 2014 | 26 | +0.40 | 0.12 | 6 | +0.41 | 0.11 |
| 3009 | 29 | +0.56 | 0.14 | 6 | +0.38 | 0.24 |
| 3019 | 28 | +0.45 | 0.11 | 5 | +0.36 | 0.21 |
| SE49 | 28 | +0.47 | 0.18 | 6 | +0.60 | 0.33 |
| (Å) | EPlow | |
| [O i] | ||
| 6300.311 | 0.00 | -9.75 |
| Na i | ||
| 6154.226 | 2.102 | -1.57 |
| 6160.747 | 2.104 | -1.26 |
| Mg i | ||
| 6318.717 | 5.108 | -1.94 |
| 6319.237 | 5.108 | -2.16 |
| 6319.494 | 5.108 | -2.67 |
| 7691.553 | 5.574 | -0.65 |
| Al i | ||
| 6696.032 | 3.140 | -1.32 |
| 6698.671 | 3.140 | -1.62 |
| Si i | ||
| 5666.686 | 5.616 | -1.81 |
| 5684.493 | 4.950 | -1.65 |
| 5690.425 | 4.930 | -1.87 |
| 6155.693 | 5.619 | -2.46 |
| 6721.844 | 5.860 | -1.21 |
| 7932.348 | 5.964 | -0.47 |
| Ca i | ||
| 6156.023 | 2.521 | -2.45 |
| 6161.297 | 2.523 | -1.27 |
| 6162.173 | 1.899 | -0.09 |
| 6163.754 | 2.521 | -1.29 |
| 6166.440 | 2.521 | -1.14 |
| 6717.687 | 2.710 | -0.52 |
| Sc ii | ||
| 5667.164 | 1.500 | -1.11a |
| 5669.040 | 1.500 | -1.00a |
| 5684.190 | 1.510 | -0.92a |
| 6245.637 | 1.507 | -1.05 |
| Ti i | ||
| 5689.487 | 2.297 | -0.47 |
| Mn i | ||
| 6013.498 | 3.07 | -0.25a |
| 6016.637 | 3.07 | -0.09a |
| 6021.802 | 3.08 | 0.03a |
| Ni i | ||
| 6384.663 | 4.154 | -1.00 |
| 6482.796 | 1.936 | -2.78 |
| Ba ii | ||
| 5853.675 | 0.600 | -1.00a |
| 6141.718 | 0.700 | 0.00a |
| 6496.896 | 0.600 | -0.38a |
| Eu ii | ||
| 6645.110 | 1.380 | 0.204 |
| a: line for which HFS has been considered | ||
4 Other abundances
Abundance derivation for other elements was also based on spectrum synthesis. Table 5 lists the excitation potentials and oscillator strengths adopted for each atomic line synthetized (C and N, for which we only studied the molecules CH, C2 and CN are not included); these line parameters are the same used throughout our BOCCE program. In summary, we have determined abundances of C, N, O, Na, Al, of the -elements Mg, Si, Ca, Ti, of Sc, Mn, Ni, Ba, Eu. Results for the individual stars in the two clusters are presented in Table 7, while Table 8 gives the average values.
We have determined the sensitivity of abundances to variations in atmospheric parameters using star 4510 in NGC 6253 (see Table 6); given the similarity of evolutionary status and metallicity, these are valid also for the other stars in this cluster and in NGC 6791.
| Element | [X/H] | |||
|---|---|---|---|---|
| +100 K | +0.2 dex | +0.1 dex | +0.1 km s-1 | |
| i | -0.181 | 0.018 | -0.006 | 0.046 |
| i | -0.247 | 0.066 | -0.038 | 0.047 |
| i | -0.020 | -0.029 | -0.037 | 0.027 |
| i | 0.076 | -0.068 | -0.015 | 0.024 |
| i | -0.023 | -0.029 | -0.011 | 0.023 |
| i | 0.048 | -0.025 | -0.029 | 0.012 |
| i | -0.093 | 0.007 | 0.000 | 0.036 |
| i | 0.096 | -0.073 | -0.011 | 0.010 |
| ii | 0.124 | -0.036 | -0.009 | -0.008 |
| i | 0.126 | -0.032 | -0.018 | -0.025 |
| i | 0.074 | -0.049 | 0.008 | 0.019 |
| i | 0.018 | 0.022 | 0.026 | -0.053 |
| ii | -0.146 | 0.124 | 0.044 | -0.036 |
| i | -0.033 | 0.016 | 0.002 | -0.003 |
| ii | 0.168 | -0.080 | 0.006 | -0.027 |
| ii | 0.138 | -0.039 | -0.010 | -0.020 |
4.1 NGC 6253
C, N, O -
For stars of this temperature and metallicity there is coupling between C and O due to the formation of CO; furthermore, the O line used (6300.3 Å) is contaminated by lines of the CN red system, meaning that we also need to consider N abundance in our computations. The abundances of C, N and O were derived following the classical procedure first described in Lambert & Ries (1978, 1981). We used the version applied by Gratton & Sneden (1990) to Leo, solving the full set of dissociation equations related to the coupling of these elements including among others the CO and CN molecules.
Briefly, we obtained a first set of C and O abundances by assuming a guess for the N abundance (actually, the solar-scaled [N/Fe] value); the best C and O abundances were obtained from the intersection of the loci in the C-O plane derived synthetic spectrum comparison with observed O and C features.
The oxygen abundances were derived from careful synthesis of the [O i] 6300.3 Å line, the best abundance indicator for red giants in the optical. We did not need to correct for telluric components the spectra of the stars observed with UVES, since we checked that the oxygen line was not affected by them by comparing to the spectrum of a rapidly rotating early type star. For star 3595, observed with FEROS, the heliocentric correction is very different; the presence of contamination by telluric lines was detected and cleaned up by using the same early type star spectrum. The contribution by the Ni i line at 6300.35 Å, whose effect is not negligible in moderately O-poor, metal-rich stars in open clusters (see Carretta et al. 2005), was duly considered adopting a solar [Ni/Fe] ratio: we included the for this line by Johansson et al. (2003) in the list for synthetic spectra.
Very good estimates of the C abundances can be obtained from the spectral synthesis of the C2 molecular features at 5086 Å. However, only the spectra obtained with FEROS contains this region; hence, the fitting was possible only for star 3595. All the stars in our sample have the same evolutionary status and a quite similar appearance of their spectra, so that we should be justified in adopting a value [C/Fe] dex also for the three stars observed with UVES. However, we confirmed the validity of this assumption with synthesis of the CH band near 4300 Å, present in all spectra. With this C abundance, we derived from the forbidden [O i] line trial values for their O abundances.
With these preliminary values of the C, O abundances we derived abundances of N from the comparison of synthetic spectra to a number of features of the CN red system, between 8158 and 8224 Å222 This wavelength range was not observed with SARG, hence the N abundance for the stars in NGC 6791, derived from weaker lines at shorter wavelengths, is more uncertain. We could match 15 to 24 such features, depending on the star. The averaged N values, having an rms of 0.10 to 0.16 dex, are shown in Table 5 for each individual star. We find on average a small depletion of N, with [N/Fe] (rms=0.03 dex, four stars).
Finally, with these N values we reiterated the derivation of C and O; however, results were found to be scarcely sensitive to the newly derived N abundances, with respect to the initial solar-scaled value adopted. In Table 7 we summarize the full set of C, N, O abundances obtained with this procedure.
The light elements Na and Al -
Since the strong Na doublets at 5682-88 and 8183-8194 Å are heavily saturated and a reliable abundance is difficult to obtain from these features even with spectrum synthesis, our Na values for NGC 6253 were derived from the weaker doublet at 6154-60 Å. The latter has the further advantage of smaller departures from the LTE assumption.
In Table 7 we list the [Na/Fe] ratios obtained for each star; the corrections for departures from LTE were found to be negligible, following the prescription by Gratton et al. (1999). As found for the majority of open clusters studied so far, the average Na in NGC 6253 is enhanced relative to the solar ratio, with no significant star-to-star scatter (average [Na/Fe]=, rms=0.02 dex).
Abundance of Al were derived from spectrum synthesis of the doublet at 6696-98 Å. We measured a [Al/Fe] slightly lower than solar-scaled (on average [Al/Fe], rms=0.12 dex).
-elements -
We measured Mg abundances through spectrum synthesis of the Mg i triplet at 6318-19 Å, and of the line at 7691.5 Å. The Mg lines are all strong and this triplet, although largely used, is not a perfect abundance indicator since damping is important and not well known333 Collisional damping used through this paper follows the precepts by Barklem et al. (2000). However, Mg lines have a large effective number and are then outside the validity range of these approximations. . We found a solar scaled ratio; on average [Mg/Fe]= (rms=0.03) dex. Although no significant star-to-star scatter is present, we attribute a larger uncertainty to our measure for the reason given just above.
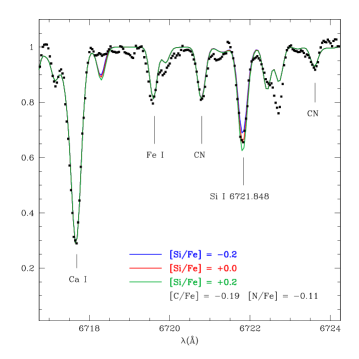
The Si abundances are based on three lines (six for the FEROS spectrum), among them the clean Si i 6721.85 Å line that falls in a region almost free from telluric contamination and where the spectra have a very high S/N. An example of the fitting for this line in star 2509 is shown in Fig. 5. A few other features are also indicated; in particular, we can appreciate from this figure how the derived C, N abundances reproduce fairly well the clean CN feature just blueward of the Si i line. We find an average [Si/Fe] (rms=0.06 dex).
We used spectrum synthesis of three or four moderately weak lines of Ca i (at 6156, 6161, 6163 and 6166 Å) and checked them with the 6717 Å line (which is blended with Fe i, hence provides less reliable abundances). They give the average value [Ca/Fe]= (rms=0.12) dex. We wish to note that our synthesis well reproduces the wings of the Ca i 6162.17 Å line, a very good indicator of surface gravity (see e.g., Mishenina et al. 2006, who used it in field RC stars, and literature therein); this is an independent validation of the gravities we adopted.
Only one Ti i line was available for synthesis, and only in star 3595; we derived the rather uncertain value of [Ti/Fe], that we retain since this same line was measured in all four NGC 6791 stars.
The average of elements is [/Fe] (rms=0.12) if we consider all four species, and [/Fe] (rms=0.07) if we exclude Ti. In both cases this value conflicts with the earlier claim of enhancement by Twarog et al. (2003) and confirms their later conclusion (Anthony-Twarog et al. 2007; see also Sestito et al. 2007 for a very similar result).
Iron peak elements -
We measured the abundances of Sc, Mn and Ni. Of the four Sc ii lines, only one was available in all stars; for the three others we considered the hyperfine structure (HFS, see Gratton et al. 2003 for references). The Sc abundance was found remarkably constant and we derived the average abundance [Sc/Fe] (rms=0.01) dex.
The Mn abundance was derived from the three saturated lines at 6013-6021 Å, admittedly not very sensible to abundance variations. We took HFS into consideration; the three lines gave reasonably consistent values and we found an average [Mn/Fe] (rms=0.07) dex.
The Ni abundance is based on two lines, and the average value is [Ni/Fe], without scatter.
All three Fe-peak elements have solar scaled ratios; this is expected for Sc and Ni. The ”right” Mn abundance is more difficult to tell, since it appears decoupled from the iron one for most metallicities (Gratton et al. 2004). Furthermore, there are very few measures for open clusters, and none for so metal-rich ones (see e.g., De Silva et al. 2007).
Neutron capture elements -
The Ba abundance was derived from two or three strong lines, for which HFS (from Prochaska et al. 2000) was considered; the final average value is [Ba/Fe]ii (rms=0.04). This element has been measured for many OCs, finding a very scattered distribution, with abundances varying by more than 1 dex (e.g., De Silva et al. 2007).
Finally, we measured one Eu line, finding the remarkably constant value [Eu/Fe]ii.
| element | Sun | nr | [X/Fe] | rms | nr | [X/Fe] | rms | nr | [X/Fe] | rms | nr | [X/Fe] | rms |
| NGC 6253-2509 | NGC 6253-2885 | NGC 6253-4510 | NGC 6253-3595 | ||||||||||
| C i | 8.52 | 10 | -0.19 | 0.11 | 10 | -0.15 | 0.18 | 11 | -0.13 | 0.14 | 6 | -0.10 | 0.11 |
| N i | 7.92 | 15 | -0.11 | 0.12 | 22 | -0.18 | 0.11 | 24 | -0.13 | 0.16 | 20 | -0.12 | 0.10 |
| O i | 8.79 | 1 | -0.15 | 1 | -0.25 | 1 | -0.20 | 1 | -0.12 | ||||
| Na i | 6.21 | 2 | 0.21 | 0.04 | 2 | 0.23 | 0.07 | 2 | 0.18 | 0.00 | 2 | 0.23 | 0.07 |
| Mg i | 7.43 | 4 | 0.00 | 0.04 | 4 | 0.02 | 0.09 | 3 | 0.05 | 0.04 | 4 | -0.03 | 0.01 |
| Al i | 6.23 | 2 | -0.12 | 0.01 | 2 | -0.19 | 0.07 | 2 | -0.09 | 0.01 | 2 | 0.10 | 0.01 |
| Si i | 7.53 | 3 | 0.01 | 0.19 | 3 | 0.07 | 0.21 | 3 | 0.14 | 0.20 | 6 | 0.14 | 0.13 |
| Ca i | 6.27 | 4 | 0.00 | 0.10 | 4 | -0.06 | 0.10 | 4 | -0.16 | 0.13 | 3 | 0.13 | 0.15 |
| Sc ii | 3.13 | 1 | -0.06 | 1 | -0.06 | 1 | -0.06 | 3 | -0.05 | 0.10 | |||
| Ti i | 5.00 | 1 | -0.19: | ||||||||||
| Mn i | 5.34 | 3 | 0.03 | 0.10 | 3 | 0.10 | 0.09 | 3 | 0.07 | 0.08 | 2 | -0.05 | 0.14 |
| Ni i | 6.28 | 2 | -0.05 | 0.27 | 2 | -0.05 | 0.27 | 2 | -0.05 | 0.27 | 2 | -0.05 | 0.02 |
| Ba ii | 2.22 | 2 | 0.13 | 0.14 | 2 | 0.18 | 0.21 | 2 | 0.13 | 0.14 | 3 | 0.20 | 0.16 |
| Eu ii | 0.55 | 1 | 0.03 | 1 | 0.03 | 1 | 0.03 | 1 | 0.03 | ||||
| NGC 6791-2014 | NGC 6791-3009 | NGC 6791-3019 | NGC 6791-SE49 | ||||||||||
| C i | 8.52 | 1 | -0.18 | 1 | -0.12 | 1 | -0.23 | 1 | -0.38 | ||||
| O i | 8.79 | 1 | -0.35 | 1 | -0.20 | 1 | -0.35 | 1 | -0.35 | ||||
| Na i | 6.21 | 1 | 0.28 | 1 | -0.02 | ||||||||
| Mg i | 7.43 | 3 | 0.24 | 0.09 | 3 | 0.24 | 0.14 | 3 | 0.18 | 0.23 | 3 | 0.14 | 0.15 |
| Al i | 6.23 | 2 | -0.24 | 0.01 | 2 | -0.17 | 0.01 | 2 | -0.32 | 0.01 | 2 | -0.12 | 0.01 |
| Si i | 7.53 | 4 | -0.06 | 0.17 | 4 | 0.12 | 0.17 | 3 | -0.11 | 0.10 | 4 | 0.02 | 0.11 |
| Ca i | 6.27 | 4 | -0.16 | 0.08 | 1 | -0.06 | 1 | -0.26 | 5 | -0.13 | 0.19 | ||
| Sc ii | 3.13 | 3 | -0.23 | 0.14 | 4 | -0.08 | 0.13 | 3 | -0.10 | 0.09 | 3 | -0.10 | 0.01 |
| Ti i | 5.00 | 1 | 0.01 | 1 | -0.04 | 1 | 0.16 | 1 | 0.01 | ||||
| Mn i | 5.34 | 3 | 0.13 | 0.16 | 3 | 0.10 | 0.22 | 3 | 0.10 | 0.10 | 3 | -0.03 | 0.03 |
| Ni i | 6.28 | 2 | 0.00 | 0.23 | 2 | -0.03 | 0.33 | 2 | -0.15 | 0.13 | 2 | -0.08 | 0.33 |
| Ba ii | 2.22 | 3 | 0.43 | 0.10 | 3 | 0.31 | 0.03 | 3 | 0.21 | 0.20 | 3 | 0.15 | 0.18 |
| Eu ii | 0.55 | 1 | -0.17 | 1 | -0.17 | ||||||||
4.2 NGC 6791
In G06 we determined Fe, C, O (and N) abundances in NGC 6791. Here we applied to our spectra the same technique described above for NGC 6253 but given the different instrument, wavelength coverage and S/N not all lines synthesized for NGC 6253 were available for NGC 6791 too.
Unfortunately the region near 6150-6170 Å falls near the separation between the two chips in the SARG mosaic with our setting and it was either missing or badly extracted in several spectra, depending on the exact location of the stars along the slit. For this reason we were able to reliably determine the Na abundance only for two stars (2014 and SE49) and using only the 6154 Å line. At variance with NGC 6253, where the Na abundance shows no scatter, we found two quite differing values, giving an average (rms=0.21) dex.
Also the Ca abundance was derived using the four lines between 6156.10 and 6166.44 Å only for the same two stars; for the two others we had to use only the 6717.69 Å line; there is no significant scatter for the Ca abundance and the average value is (rms=0.08) dex. Mg was measured only from the triplet near 6319 Å and the abundance ratio found is enhanced with respect to the solar ratio (, rms=0.05). The Ti line chosen was instead visible in all four stars and the average value is (rms=0.09). In the case of NGC 6791 (rms=0.14) dex.
Individual results for the four stars and average cluster values are presented in Tables 7 and 8 respectively. Here we also show the individual O and C abundances, while in G06 we only presented the averages for the four stars. Note that the present values slightly differ from the ones given in G06, since we used there different solar reference values. The present ones are as in Gratton et al. (2003) and Carretta et al. (2005) and will consistently be used for all the BOCCE clusters.
| element | NGC 6253 | NGC 6791 | Leo | ||
|---|---|---|---|---|---|
| mean | rms | mean | rms | ||
| 0.03 | 0.07 | ||||
| 0.04 | 0.11 | ||||
| 0.03 | |||||
| 0.06 | 0.08 | ||||
| 0.02 | 0.21 | ||||
| 0.03 | 0.05 | ||||
| 0.12 | 0.09 | ||||
| 0.06 | 0.10 | ||||
| 0.12 | 0.08 | ||||
| 0.01 | 0.07 | ||||
| : | 0.09 | ||||
| 0.07 | 0.07 | ||||
| 0.00 | 0.07 | ||||
| 0.04 | 0.12 | ||||
| 0.00 | 0.00 | ||||
5 Literature studies
5.1 Other analyses of the two clusters
We will restrict our comparison to papers based on high resolution spectroscopic studies in the case of NGC 6791, but consider also intermediate-band photometry for NGC 6253, for which the literature is far less copious.
Initial studies of NGC 6253 concentrated on broad-band photometry (Bragaglia et al. 1997; Sagar et al. 2001), in one case coupled with integrated spectra (Piatti et al. 1998). These papers agreed on a rather old age (from 2.5 to about 5 Gyr) and a high metallicity ([Fe/H]=+0.2 to +0.4).
As part of their series on Strömgren photometry of open clusters, Twarog et al. (2003) presented a study based on photometry (and a comparison to literature broad-band data). NGC 6253 is outside the calibrations available at the time of the and indices. With some extrapolations, they derived formal values of [Fe/H] of +0.7 to +0.9 dex, but their best fit with isochrones led to [Fe/H] closer to +0.4, a significant -enhancement, and an age between 2.5 and 3.5 Gyr. In Anthony-Twarog et al. (2007) they revised these results using an updated version of the colour-metallicity relations for Strömgren photometry, valid in the super-metal rich regime, and favoured instead solar scaled -elements, a reddening , an age of about 3 Gyr, and [Fe/H]. Following the reasoning in G06 (sect. 3.3 and Table 4), had we adopted their lower reddening instead of the value 0.23, we would have obtained a metallicity about 0.13 dex higher (the decrease in temperature also implies a decrease in microturbulent velocity and [Fe/H] is much more sensible to variations in the latter at these metallicities and temperatures). An important feature of their reanalysis of NGC 6253 is that the similarity of results from the index (that is dominated by CN features) and the index (dominated by Ca) should indicate that [C/Ca]0 for this cluster (we actually find a value of 0.1 dex). This is at variance with NGC 6791, where the two indices give discrepant results; Anthony-Twarog et al. (2007) explain this with C (and N, but not Ca) being underabundant in NGC 6791 with respect to solar. While C and N have less undersolar ratios in NGC 6253 than in NGC 6791 we do not know if this is enough to explain the different behavior of the metallicity indices in the two clusters.
We presented a preliminary metallicity for NGC 6253 (Carretta et al. 2000) based on two objects, the red clump stars 2508, later reobserved, and 2971. The spectra were obtained on July 1998 with EMMI on the ESO New Technology Telescope as a backup in poor weather conditions, at R=28000, degraded to about R15000 to improve the rather low S/N. From equivalent widths (EWs) analysis we found an average [Fe/H]= and concluded that the value could be taken as indicative of a metal abundance larger than solar, but with a large error attached. Further spectra at higher resolution and S/N were deemed necessary to conclusively define the cluster metallicity; the present work supersedes the old analysis.
The only other detailed analysis of high resolution spectra of NGC 6253 is by Sestito et al. (2007), who analyzed 5 stars observed with UVES/FLAMES, in different evolutionary phases (RC, RGB, SGB and Turn-Off). There are no stars in common with our set. Since they were mostly dealing with warmer stars than the ones studied here, they used EWs, only using synthetic spectra to check their results. For the elements in common, they derived [Fe/H]=, [Si/Fe]=, [Ca/Fe]=, [Ti/Fe]=, [Mg/Fe]=, [Ni/Fe]=, [Ba/Fe]=, and [Na/Fe]=. These values are in agreement with ours, with the exception of Ti (but our abundance is based on only one line in one star), Mg (that both papers consider among the less reliable derivations), and Na (for which two different corrections for NLTE were applied; actually their average LTE value is +0.20, similar to ours).
The literature on NGC 6791 is far more abundant because of its unique combination of very old age and high metallicity, that raised considerable interest. After the work by Peterson & Green (1998) who analyzed a single red horizontal branch star, this old, metal rich cluster has been the subject of three recent independent papers based on high resolution spectra. Our own (G06), Carraro et al. (2006) who measured [Fe/H] and elemental abundances for a sample of ten red giants observed with HYDRA at R=17000 finding [Fe/H]=+0.39, and Origlia et al. (2006) who used the near IR spectra at R=25000 of six cold giants obtained with NIRSPEC at R=25000 to determine[Fe/H]=+0.35 and several elemental abundances. Finally, in a very recent paper Anthony-Twarog et al. (2007) derived [Fe/H]=+0.45, based on the version of the colour-metallicity relations for Strömgren photometry valid for very high metallicity stars.
We will compare our findings to the spectroscopic works by Peterson & Green (1998), Carraro et al. (2006) and Origlia et al. (2006). Table 9 shows the abundances for the species in common; errorbars on these elemental ratios are of the order of 0.1 or 0.2 dex, depending on the species, in all papers. The agreement between different analyses is far from satisfactory. Iron shows formally the best accord since all measures agree within the quoted errorbars. Our measures are in good agreement with the others’ for some elements (e.g., for Mg, Si, Ti, Ni) while there are significant differences for other elements (e.g., for O, Na, Ca, and most notably N). We have no real explanation for this. A real comparison is difficult even if all investigators employed spectrum synthesis to analyze the data, because the studies use different stars and systematics can be hard to assess. Peterson & Green (1998) analyzed a single red HB star, i.e., a star much hotter (about 7300 K) than everyone else; Origlia et al. (2006) studied cold M giants (3600-4000 K) in a completely different wavelength range (the near IR); finally, Carraro et al. (2006) chose stars similar to ours (RC and RGB stars of magnitude comparable to the RC).
The latter study has also one star in common with us (their 8082, our SE49) and we may attempt some direct comparison. Both studies obtained for this star spectra of similar S/N (about 40), and measured a similar radial velocity ( km s-1 for them and km s-1 for us) but our spectra have a resolution of about 30000 while theirs of about 17000. They assumed a distance modulus , with (from Stetson et al. 2003) i.e., , and derived temperatures from and colours using three different relations. We adopted , with (as an average of literature determinations) and derived the temperature from and the Alonso et al. (1999) relations. The adopted atmospheric parameters for temperature, gravity and microturbulent velocity are quite different: , , for Carraro et al. (2006) and , , for G06.
The difference in temperature is mainly due to the different reddening values adopted; had Carraro et al. (2006) adopted the same higher reddening we used, they would have obtained temperatures similar to ours. The differing gravity is only partly due to the combination of lower temperature and shorter distance modulus. The large residual difference would be explained had they used a mass of about 2.5 M⊙, compared to the 0.9 M⊙ we adopted; they do not give explicitly the value, but this is what we understand from the spectral type and the Straizys & Kuriliene (1981) work referenced in their paper. This large mass is in contrast with the old age of the cluster.
Is there any way of independently checking the soundness of the assumptions on distance and reddening? We have not yet studied NGC 6791 using the synthetic colour-magnitude diagrams technique adopted for the BOCCE sample; however, we note that our values are close to the ones found by King et al. (2005) on HST/ACS photometric data and to the ones derived by Anthony-Twarog et al. (2007) on Strömgren data. The latter also provide (their sect. 6.3) an interesting discussion on the validity of different comparisons between the photometric data and isochrones and on the inconsistency of a reddening as low as . Carraro et al. (2006) provide a new determination of age, distance and reddening using their derived metallicity and two isochrone sets. From the Girardi et al. (2000) ones they confirm the reddening but find a best fit with or 13.45 depending on the age; from the Y2 ones (Yi et al. 2001) they find best fit values of and . However, they do not discuss the impact of these new parameters on their metallicity derivation. G06 discussed (their Sect. 3.3) the adopted temperature and reddening, finding that strongly differing values would result in gravities implying absolute magnitudes of the RC stars incompatible with what is expected from evolutionary models (i.e., , Girardi & Salaris 2001). We note also that with our adopted gravities we were able to reproduce very well the wings of the 6162.17 Å Ca i line which, as said in Sect. 4.1, is a good indicator of surface gravity.
The difference in adopted atmospheric parameters is not the main cause of the (small) difference in metallicity, as can be seen from the sensitivity of [Fe/H] on parameters variation (Table 6). Our analysis and the one by Carraro et al. (2006) use different synthesis codes and line lists ad cannot be readily compared. However, we note that the not ideal resolution of the HYDRA spectra has a direct impact on continuum tracing. From their fig. 4, the continuum level may have been underestimated by about 2%, implying a [Fe/H] lower by 0.1 dex. This (systematic) error of about 0.1 dex is within the uncertainties that can be reached with the quality of the HYDRA spectra for these very line-rich stars. The uncertainty in continuum tracing is lower in our spectra because of resolution and S/N (R versus and S/N higher by about a factor 1.5). We conclude that the difference of 0.08 dex in the mean cluster metallicity is well within of the (combined) uncertainties of the two derivations.
Finally, the difference in mean cluster metallicity between our work and Carraro et al. (2006) is small and has no impact on the science discussed in the two papers.
| Element | Present work | PG98 | C+06 | O+06 |
|---|---|---|---|---|
| 0.39 | 0.35 | |||
| 0.35 | ||||
| 0.07 | ||||
| 0.03 | ||||
| 0.15 | 0.05 | |||
| 0.02 | 0.02 | |||
| 0.03 | 0.05 | |||
| 0.02 | 0.03 | |||
| 0.01 | ||||
| 0.13 | ||||
5.2 Literature on high metallicity stars
Are NGC 6253 and NGC 6791 rare and unusual ? The answer is important if we want to gain more insight into their origin and to use them to understand the formation, the early enrichment and the metallicity distribution of the disk.
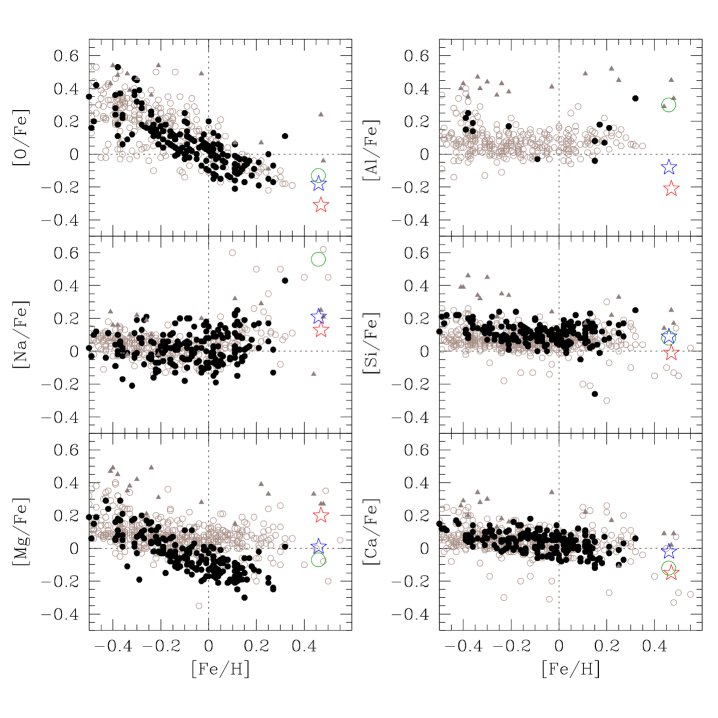
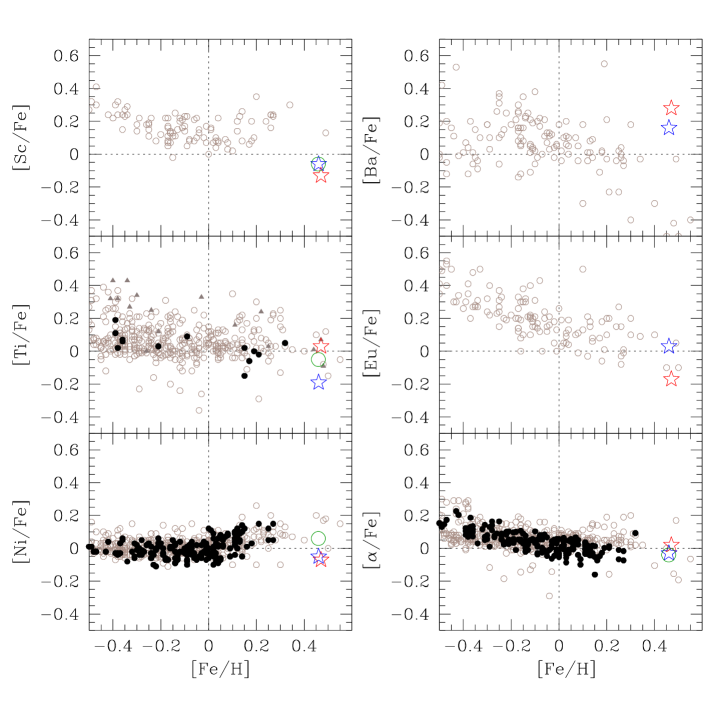
These two OCs are so metal rich that it is not easy to find suitable comparison samples in the literature, specially of giants, to see if the derived abundances follow the ”normal” trends generally found for disk objects. We consider here various possible comparisons: i) the very metal-rich giant star Leo, already used in G06 to confirm the validity of our assumptions and method, with abundances taken from Gratton & Sneden (1990) but brought to our same solar reference scale (see Table 8); ii) the sample of thin and thick disk dwarfs in Soubiran & Girard (2005), who put together and tried to homogenize a large number of studies444 Allende Prieto et al. (2004), Bensby et al. (2003, 2004), Chen et al. (2000), Edvardsson et al. (1993), Fulbright (2000), Gratton et al. (2003), Mishenina et al. (2004), Nissen & Schuster (1997), Prochaska et al. (2000), Reddy et al. (2003). ; iii) the metal-rich local dwarfs by Castro et al. (1997) and Pompeia et al. (2003), who selected stars of supposed inner disk or bulge origin on the basis of kinematics; iv) the field disk RC stars studied by Mishenina et al. (2006); v) the disk and the bulge giants in Fulbright et al. (2007). As usually done when such comparisons are presented, no effort was taken to study or correct for systematics between all samples; we only note, for example, that Leo has [Fe/H]=+0.32 in Fulbright et al. (2007) and +0.46 in our scale.
Fig. 6 shows the run of O, Na, Mg, Al, Si and Ca with metallicity for all stars in these samples (open symbols are for dwarfs and filled symbols for giants); the two OCs plus Leo are shown with larger symbols. The only two disk samples that contain stars as metal-rich as NGC 6253 and NGC 6791 are the ones by Castro et al. (1997) and Pompeia et al. (2003), so we miss a direct comparison for O and Al.
Taking into account that these ratios have an errorbar of about 0.1 dex, NGC 6253 and NGC 6791 display very similar abundance ratios, as seen also from Table 8, with the exception of Mg and Ti (note however that the Mg abundances have a larger errorbar attached -see Sect. 4.1- and that Ti is measured from one single line, and not in all stars). Both clusters generally follow the trend of the disk samples or its reasonable extrapolation. The Mg abundance in NGC 6791 seems more similar to that of the bulge giants in Fulbright et al. (2007) but, given also that the distributions for disk and giant stars for Mg differ while they do not for the other elements, we do not consider this as a strong indication that this cluster shows signature of a bulge-like origin. Carraro et al. (2006) suggested that NGC 6791 is either of extragalactic origin or originated in the inner disk region, near the bulge. While the first hypothesis is completely unsupported by the abundance ratios (ours or anyone else’s), the second one has received a confirmation by a new determination of the cluster absolute motion and orbit (Bedin et al. 2006). Clearly, NGC 6791 would require new theoretical studies to explain the very high metallicity for its age and to better understand its origin; however, these studies would have to take into account that NGC 6791 is not perhaps an exceptional object since there are at least two old clusters with similar high metallicity and abundance ratios. For a deeper insight on these clusters’ properties and origin, new, higher quality spectra would also be useful: not only the abundances would stand on firmer grounds, but new elements could be examined, e.g., adding more - and -process elements, that could be used to shed light on the enrichment path and discriminate among different origins. To this end we would benefit of a larger wavelength coverage, Especially in the blue, higher S/N and much higher resolution than obtained by all the presently existing studies.
6 Summary
With this paper we add two clusters to the very metal-rich end of the BOCCE sample, that now comprises objects from [Fe/H] to more than +0.4 dex. The fact that we concentrate on RC stars in all clusters helps to maintain a better homogeneity in our results, even if different spectrograph, or different analysis methods (EWs or synthetic spectra) are used. Furthermore, we use the same line lists, values, model atmospheres, reference solar values and we always check results of the EW analysis with synthesis, at least for Fe.
We have analyzed high resolution spectra of four RC stars in NGC 6253 and derived, using spectrum synthesis, their metallicity; the cluster has [Fe/H] dex (internal and systematic error). A fifth star is possibly a binary with the spectrum likely contaminated by the secondary. For this reason, it was not taken into account in our results. We also derived abundances for the light elements C, N, O, for Al and Na, for the -elements Mg, Si, Ca and Ti, for the iron-peak elements Sc, Mn, and Ni, and for the neutron-capture elements Ba and Eu.
On the basis of the present analysis, NGC 6253 turns out to be as metal-rich as NGC 6791, up to now the only cluster for which a metallicity well in excess of the Hyades’ had been convincingly derived, both on the basis of photometric data (e.g., Chaboyer et al. 1999) and of spectroscopic abundance analysis (Peterson & Green 1998, Carraro et al. 2006, Origlia et al. 2006, and G06).
Our metallicity determination for NGC 6253 is in agreement with the photometric derivations (e.g., Bragaglia & Tosi 2006, Anthony-Twarog et al. 2007). Also the comparison with Sestito et al. (2007) is favourable. We have measured Mg, Si, Ca (and Ti) abundances and the resulting [/Fe] is solar, as also found recently by Sestito et al. (2007) and Anthony-Twarog et al. (2007).
We have also completed our analysis of NGC 6791, deriving abundances for the same elements as in NGC 6253 for four RC stars. The two clusters show generally similar abundance ratios; an exception is Mg, which is overabundant in NGC 6791 -and more similar to values measured in bulge giants- but not in NGC 6253.
In NGC 6791 the [/Fe] value is solar, confirming earlier results by Carraro et al. (2006) and Origlia et al. (2006) and only slightly differing with Peterson & Green (1998) who obtained [/Fe]=+0.10. The agreement appears quite good, but could be completely accidental because of the different data sets and analysis methods.
The two clusters seem to follow rather well the trends of elemental ratios for metal-rich stars, as derived from the comparison to different literature samples, both for field dwarfs and giants and for bulge giants. They generally appear to conform to the disk stars run of elemental ratios with [Fe/H], with the possible exception of Mg for NGC 6791.
Acknowledgements.
This paper is part of the BOCCE project and we are grateful to M. Tosi for very useful discussions. We thank S. Desidera and M. Montalto for information about membership of star NGC 6253-2508. This research has made use of the WEBDA database, created by J.-C. Mermilliod and now operated at the Institute for Astronomy of the University of Vienna, and of data products from the Two Micron All Sky Survey, which is a joint project of the University of Massachusetts and the Infrared Processing and Analysis Center/California Institute of Technology, funded by the National Aeronautics and Space Administration and the National Science Foundation. This work was partially funded by the Italian MIUR under PRIN 2003-029437.References
- (1) Allende Prieto, C., Barklem, P.S., Lambert, D.L., & Cunha, K. 2004, A&A, 420, 183
- (2) Alonso, A., Arribas, S. & Martinez-Roger, C. 1999, A&AS, 140, 261
- (3) Anthony-Twarog, B.J, Twarog, B.A., & Mayer, L. 2007, AJ, 133, 1585
- (4) Barklem, P.S., Piskunov, N., & O’Mara, B.J. 2000, A&AS, 142, 467
- (5) Bedin, L.R., Piotto, G., Carraro, G., King, I.R., & Anderson, J. 2006, A&A, 620, L27
- (6) Bensby, T., Feltzing, S., & Lundstr m, I. 2003, A&A, 410, 527
- (7) Bensby, T., Feltzing, S., & Lundstr m, I. 2004, A&A, 415, 155
- (8) Bragaglia, A., & Tosi, M. 2006, AJ, 131, 1544
- (9) Bragaglia, A., Tessicini, G., Tosi, M., Marconi, G., & Munari, U. 1997, MNRAS, 284, 477
- (10) Bragaglia, A., et al. 2001, AJ, 121, 327
- (11) Carraro, G., Villanova, S., Demarque, P., McSwain, M.V., Piotto, G., & Bedin, L.R. 2006, AJ, 643, 1151
- (12) Carretta, E., Bragaglia, A., Tosi, M., & Marconi, G. 2000, ASP Conf. Ser. 198: Stellar Clusters and Associations: Convection, Rotation, and Dynamos, 198, 273
- (13) Carretta, E., Bragaglia, A., Gratton, R. G., & Tosi, M. 2004, A&A, 422, 951
- (14) Carretta, E., Bragaglia, A., Gratton, R. G., & Tosi, M. 2005, A&A, 441, 131
- (15) Castro, S., Rich, M.R., Grenon, M., Barbuy, B., & McCarthy, J. 1997, AJ, 114, 376
- (16) Chaboyer, B., Green, E.M., & Green, J. 1999, AJ, 117, 1360
- (17) Chen, Y.Q., Nissen, P.E., Zhao, G., Zhang, H.W., & Benoni, T. 2000, A&AS, 141, 491
- (18) De Silva, G.M., Freeman, K.C., Asplund, M., Bland-Hawthorn, J., Bessell, M.S., & Collet, R. 2007, ApJ, 133, 1161
- (19) Edvardsson, B., Andersen, J., Gustafsson, B., et al. 1993, A&A, 275, 101
- (20) Fulbright, J. P. 2000, AJ, 120, 1841
- (21) Fulbright, J.P., McWilliam, A., & Rich, R.M. 2007, ApJ, 661, 1152
- (22) Girardi, L., & Salaris, M. 2001, MNRAS, 323, 109
- (23) Girardi, L., Bressan, A., Bertelli, G., & Chiosi, C. 2000, A&AS, 141, 371
- (24) Gratton, R.G., & Sneden, C. 1990, A&A, 234, 366
- (25) Gratton, R.G., Sneden, C., & Carretta, E. 2004, ARA&A, 42, 385
- (26) Gratton, R.G., Bragaglia, A., Carretta, E., & Tosi, M. 2006, ApJ, 462, 469 (G06)
- (27) Gratton, R.G., Carretta, E., Eriksson, K., & Gustafsson, B. 1999, A&A, 350, 955
- (28) Gratton, R., Carretta, E., Claudi, R., Lucatello, S., & Barbieri, M. 2003, A&A, 404, 187
- (29) Johansson, S., Litz n, U., Lundberg, H., & Zhang, Z. 2003, ApJ, 584, L107
- (30) King, I.R., Bedin, L.R., Piotto, G., Cassisi, S., & Anderson, J. 2005, ApJ, 130, 626
- (31) Kurucz, R.L. 1995, CD-ROM No. 13, Smithsonian Astrophysical Observatory, Cambridge
- (32) Lambert, D. L., & Ries, L. M. 1977, ApJ, 217, 5088
- (33) Lambert, D. L., & Ries, L. M. 1981, ApJ, 248, 228
- (34) Mishenina, T.V., Bienaymé, O., Gorbaneva, T.I., Charbonnel, C., Soubiran, C., Korotin, S.A., & Kovtyukh, V.V. 2006, A&A, 456, 1109
- (35) Mishenina, T.V., Soubiran, C., Kovtyukh, V.V., & Korotin, S.A. 2004, A&A, 418, 551
- (36) Nissen, P. E., Schuster, W. J. 1997, A&A, 326, 751
- (37) Origlia, L,. Valenti, E., Rich, R.M., & Ferraro, R.F. 2006, ApJ, 646, 499
- (38) Peterson, R.C., & Green, E.M. 1998, ApJ, 502, L39
- (39) Piatti, A.E., Clariaá, J.J., Bica, E., Geisler, D., & Minniti, D. 1998, AJ, 116, 801
- (40) Pompeia, L., Barbuy, B., & Grenon, M. 2003, ApJ, 592, 1173
- (41) Prochaska, J. X., Naumov, S.O., Carney, B.W., McWilliam, A., & Wolfe, A.M. 2000, ApJ, 120, 2513
- (42) Reddy, B.E., Tomkin, J., Lambert, D L., & Allende Prieto, C. 2003, MNRAS, 340, 304
- (43) Sagar, R., Munari, U., & de Boer, K.S. 2001, MNRAS, 327, 23
- (44) Sestito, P., Randich, S., & Bragaglia, A. 2006, A&A, 465, 185
- (45) Skrutskie, M.F., et al. 2006, AJ, 131, 1163
- (46) Soubiran, C., & Girard, P. 2005, A&A, 439, 139
- (47) Stetson, P.B., Bruntt, H, & Grundahl, F. 2003, PASP, 115, 413
- (48) Straizys, V. & Kuriliene, G. 1981, Ap&SS, 80, 353
- (49) Twarog, B.A, Anthony-Twarog, B., & De Lee, N. 2003, AJ, 125, 1383
- (50) Twarog, B.A., Ashman, K.M., & Anthony-Twarog B.J. 1997, AJ, 114, 2556
- (51) Yi, S., Demarque, P., Kim, Y-C., Lee, Y.W., Ree, C.H., Lejeune, T., & Barnes, S. 2001, ApJS, 126, 417