Towards a Holistic View of the Heating and Cooling of the Intracluster Medium
Abstract
X-ray clusters are conventionally divided into two classes: “cool core” (CC) clusters and “non-cool core” (NCC) clusters. Yet relatively little attention has been given to the origins of this apparent dichotomy and, in particular, to the energetics and thermal histories of the two classes. We develop a model for the entropy profiles of clusters starting from the configuration established by gravitational shock heating and radiative cooling. At large radii, gravitational heating accounts for the observed profiles and their scalings well. However, at small and intermediate radii, radiative cooling and gravitational heating cannot be combined to explain the observed profiles of either CC or NCC clusters. The inferred entropy profiles of NCC clusters require that material is “preheated” prior to cluster collapse in order to explain the absence of low entropy (cool) material in these systems. We show that a similar modification is also required in CC clusters in order to match their entropy profiles at intermediate radii. In CC clusters, this modification is unstable, and an additional process is required to prevent cooling below a temperature of a few keV. We show that this can be achieved by adding a self-consistent AGN feedback loop in which the lowest-entropy, most rapidly cooling material is heated and rises buoyantly to mix with material at larger radii. The resulting model does not require fine tuning and is in excellent agreement with a wide variety of observational data from Chandra and XMM-Newton, including entropy and gas density profiles, the luminosity-temperature relation, and high resolution spectra. The spread in cluster core morphologies is seen to arise because of the steep dependence of the central cooling time on the initial level of preheating. Some of the other implications of this model are briefly discussed.
keywords:
galaxies: clusters: general — cooling flows — cosmology: theory — X-rays: galaxies: clusters1 Introduction
High quality X-ray data from the Chandra and XMM-Newton X-ray telescopes have spurred a great deal of excitement and debate over the competition between radiative cooling and non-gravitational heating in galaxy clusters. In particular, the association of X-ray cavities (“bubbles”) with diffuse radio emission in many nearby “cool core” (CC) clusters (e.g., Fabian et al. 2000; David et al. 2001; Bîrzan et al. 2004), and the lack of X-ray spectral signatures of cool ( keV or so) gas in such systems (e.g., Peterson et al. 2003) demonstrate that heating processes may be at least as important as cooling. Furthermore, we have detailed confirmation that the X-ray scaling properties of groups and clusters have been significantly modified by both radiative cooling and non-gravitational heating (e.g., Voit et al. 2002; McCarthy et al. 2004 (M04); Kay et al. 2004). As a consequence, greater theoretical attention is being given to possible heating mechanisms, such as thermal conduction (e.g., Narayan & Medvedev 2001) and heating due to active galactic nuclei (AGN) and their associated bubbles (e.g., Binney & Tabor 1995; Churazov et al. 2001; Mathews et al. 2004; Dalla Vecchia et al. 2004; Roychowdhury et al. 2004; Cattaneo & Teyssier 2007).
While a great deal has been learnt about the impact of heating and cooling on the intracluster medium (ICM) in recent years (see Voit 2005 for a recent review), we still have not obtained a complete picture and many problems remain unresolved. One important issue that has received very little attention is that the energy required to maintain a cluster in a given state can be very different from the energy required to set it in a particular configuration in the first place. Thus, while comparing the present-day heating and cooling rates of the ICM is clearly important, by its nature this test does not address the question of how the ICM reached its current configuration to begin with.
Another important issue that is related to the above and remains relatively unexplored is the apparent dichotomy between “cool core” (CC) and “non-cool core” (NCC) clusters. Typically, a cluster is classified as being a CC (NCC) cluster based on the presence (absence) of a central positive temperature gradient111The presence of a central positive temperature gradient is taken as an indicator of the importance of radiative cooling in the cluster core. Indeed, massive clusters with temperature dips typically have relatively short central cooling times in comparison to those clusters without positive temperature gradients. However, the observed distributions of central temperature, central cooling time, and central gas density (see, e.g., Fig. 7) appear to be more or less continuous across the cluster population, and so the exact dividing line used to assign CC/NCC status is somewhat arbitrary. This is not of concern for the present study, since we seek to explain the entire cluster population with the same physical model (see §4-5).. If defined in this way, one notes that the vast majority of published studies based on high quality Chandra and XMM-Newton data have been focused on the subset of CC clusters. However, studies based on data from the previous generation of X-ray satellites suggest that these systems could represent less than half the nearby cluster population, and perhaps an even smaller fraction of all systems at high redshifts (see §3). What is the origin of the NCC systems, and what is their relation to the CC clusters? The prevailing view, based on anecdotal evidence from the previous generation of satellites, is that they are the result of massive cluster mergers. However, there is now a growing body of theoretical work based on semi-analytic methods, idealised simulations, and full cosmological simulations (e.g., M04; Motl et al. 2004; Borgani et al. 2004; O’Hara et al. 2005; Balogh et al. 2006; Poole et al. 2006; 2007) that suggests mergers by themselves cannot disrupt cool cores for significant periods of time and are not responsible for the large spread in cluster core morphologies. The virtual absence of systems that resemble observed NCC systems (in terms of their gas radial profiles and stellar mass fractions) in cosmological simulations that include the effects of radiative cooling is perhaps the most compelling argument that mergers are not the answer. Some form of extreme non-gravitational heating appears to be required to explain these systems. One possibility, suggested originally by M04, is that the origin of NCC systems is linked to an early episode of entropy injection (i.e., “preheating”).
An obvious question is whether preheating might also shape the properties of CC clusters. At first sight this seems unlikely. The short central cooling times of observed CC clusters imply that without sufficient present-day heating, radiative cooling would rapidly establish extreme centrally-peaked gas density profiles and sharply declining temperature profiles with as . However, recent observations have convincingly demonstrated that present-day CC clusters are not in the state just described — their central cores are warmer than expected (e.g., Peterson et al. 2003). On the other hand, the observed power output from AGN activity appears to be only just sufficient to counteract radiative cooling losses (e.g., Dunn & Fabian 2006) in the clusters’ present-day configuration. If the central cores were previously cooler and denser than at present (as expected prior to the first heating episode), energy deposition of ergs would be required to drive the systems to their present configuration (see §4). This is larger than that provided by even the most extreme heating events observed to date. An alternative is that CC systems could have evolved to their present states from a hotter earlier configuration — perhaps from a state similar to the NCC clusters we observe today. In this paper, we will show evidence that today’s CC clusters are part of a continuous distribution of preheating levels. The apparent dichotomy arises from the steep dependence of the central cooling rate on the initial level of heating.
In order to begin to address these important issues, the role of non-gravitational heating in clusters needs to be quantified. Fortunately, progress can now be made on this front. In particular, cosmological simulations can now robustly predict the properties of the ICM in the non-radiative limit (e.g., Frenk et al. 1999). For example, Voit et al. (2005) have recently shown that the entropy structure of simulated clusters is independent of cluster mass (more precisely, the entropy profiles are self-similar) and is robust to simulation technique. Obviously, within the cooling radius the effects of radiative cooling are important and need to be factored in. This is relatively straightforward to accomplish with the aid of idealised 1-D hydrodynamic simulations (e.g., Kaiser & Binney 2003; Oh & Benson 2003; M04; Hoeft & Brüggen 2004). We refer to the model with the effects of cooling factored in as the “pure cooling model”.
The strategy we adopt in this paper is to use the difference between the pure cooling model and the observed profiles of clusters in order to quantify the non-gravitational contribution to the heating in both CC and NCC systems. Based on this empirical measurement we then explore various models for the heating mechanism. We demonstrate that a model that combines an early bout of preheating with ongoing AGN heating at the centre (that operates should the central cooling time of the gas following preheating be relatively short) provides a full description of the observed range of cluster properties.
The present paper is organised as follows. In §2, we present a description of the cluster models, including the pure cooling model. In §3, we compare the pure cooling model to a wide range of observations of CC clusters and to available data of NCC clusters. We calculate the (non-gravitational) heating energy required to explain the differences between the observed systems and the pure cooling model in §4. In §5, we propose a physical heating model that adheres to these requirements and provides an excellent match to the observational data. Finally, in §6, we present a summary of our findings and some conclusions. We assume the following cosmological parameters throughout: , , , and .
2 Cluster Models
2.1 The baseline gravitational model
The setup of our baseline cluster models is inspired by the results of recent cosmological simulations. The dark matter is assumed to follow a NFW distribution (Navarro et al. 1997):
| (1) |
where and
| (2) |
In the above, is the radius within which the mean density is 200 times the critical density, , and .
To fully specify the dark matter density profile of a halo of mass , a value for the scale radius, , must be selected. The scale radius can be expressed in terms of the concentration parameter, . We adopt the mass-concentration (-) relation recently derived from the Millennium Simulation (Springel et al. 2005) by Neto et al. (2007). For example, for a massive cluster with , Fausti Neto et al. find (see also Eke et al. 2001).
For the gaseous baryonic component, we adopt the baseline entropy profile of Voit et al. (2005), where the entropy is defined222Strictly speaking, is not the thermodynamic specific entropy () but rather, a proxy for the latter that has gained currency in X-ray astronomy because it can be easily constructed out of observed quantities and . Our “entropy proxy” and the thermodynamic specific entropy are, however, related to each other as: (see Balogh et al. 1999). For the sake of clarity, we keep to current practise and refer to as “entropy” throughout this paper. as . Briefly, Voit et al. found that the entropy profiles of clusters formed in non-radiative cosmological simulations are nearly self-similar (i.e., do not depend on cluster mass). The form of this profile at large radii is robust to simulation technique, with clusters simulated using either a Lagrangian smoothed particle hydrodynamics (SPH) code or a Eulerian adaptive mesh refinement (AMR) code having nearly the same entropy structure. Accordingly, we adopt the following entropy profile at large radii, which is consistent with both their SPH and AMR results (see their equations 9 and 10):
| (3) |
The characteristic entropy of the cluster, , is defined as:
In the above, is the universal mass ratio of baryonic to total matter. We adopt and (where and are the mean molecular weight and the mean molecular weight per free electron, respectively), appropriate for a gas with metallicity of . The last entry in eqn. (4) assumes .
At small radii, cores are present in the entropy profiles of both the SPH and AMR simulated clusters. The origin of this core is at least partially attributable to energy exchange between the gas and the dark matter (e.g., Lin et al. 2006; McCarthy et al. 2007a). However, the SPH and AMR codes predict significantly different core amplitudes (see also Frenk et al. 1999). The origin of this discrepancy is presently unclear. Fortunately, it is inconsequential for our purposes since the core is typically confined to radii where the cooling time333The cooling time, , is defined as . of the gas is short; i.e., the core is smaller than the cooling radius. Radiative cooling always modifies the entropy of the gas within the cooling radius, driving as . Thus, the initial conditions of the gas at small radii have little or no bearing on the properties of the (pure cooling) model clusters. But for specificity, we adopt a core amplitude of , which is consistent with the SPH simulations of Voit et al. (2005).
With the above dark matter density and gas entropy profiles, the remaining properties of the gas (e.g., temperature and density) are determined by assuming the gas is in hydrostatic equilibrium (hereafter, HSE) within the dark matter-dominated gravitational potential well:
| (5) |
where for simplicity we have neglected the self-gravity of the gas.
A boundary condition is required in order to solve equation (5). Non-radiative cosmological simulations of clusters demonstrate that the ratio of gas to total mass converges to nearly the universal ratio at large radii (e.g., Frenk et al. 1999; Kay et al. 2004; Crain et al. 2007). Accordingly, we iterate , the gas pressure at the outer boundary of the clusters, until the following condition is satisfied:
| (6) |
The bias factor, , is set to for our models (see Crain et al. 2007).
The above fully specifies the properties of the model clusters prior to modification of the gas owing to the effects of radiative cooling.
2.2 The effects of radiative cooling
2.2.1 The pure cooling model
To compute the effects of radiative cooling, we use the time-dependent 1-D hydro algorithm of M04 (see also Kaiser & Binney 2003; Oh & Benson 2003). We give a brief description of the model here, but refer the reader to §2.2 of that study for additional details.
The baseline profiles derived in §2.1 are discretised onto a non-uniform Lagrangian grid (i.e., the various quantities, such as temperature and density, are interpolated onto a grid of gas mass shells). A non-uniform grid is adopted so as to finely resolve the central regions of the cluster without investing a large computational effort on the outermost regions, where the effects of cooling are minimal.
We evolve the system with time by following the effects of radiative cooling (and, later, non-gravitational heating) on the gas entropy. Entropy is the most physically interesting quantity to track when cooling and non-gravitational heating are relevant, since convection will order the distribution such that the lowest entropy gas is at the bottom of the cluster potential well and the highest is located at the cluster periphery444But note convection plays a role even in the absence of radiative cooling and/or non-gravitational heating. The entropy of the vast bulk of the ICM is largely generated via gravitational shock heating during mergers. Since not all regions of a cluster are shock heated to the same degree during a particular merger, some convective mixing results (McCarthy et al. 2007a).. The temperature and density profiles of the ICM can therefore really just be thought of as manifestations of the underlying equilibrium entropy configuration (e.g., Voit et al. 2002; 2003; Kaiser & Binney 2003). Furthermore, entropy is more straightforwardly linked to cooling and non-gravitational heating since cooling always decreases the entropy and heating always raises it. Note this is not the case with the density or temperature, since heating the gas can cause it to expand and, therefore, potentially lower both quantities, as is the case in a self-gravitating gas cloud.
Radiative cooling reduces the entropy of a parcel (shell) of gas according to
| (7) |
where is the bolometric cooling function, which we calculate using a Raymond-Smith plasma model (Raymond & Smith 1977) with a metallicity fixed to .
Equation (7) is integrated over a time interval . The size of this time step is computed by adhering to the standard Courant condition: , where is the gas mass shell size and is its speed of sound. We calculate this quantity for all gas mass shells, find the shell with the minimum time step, and apply this time step uniformly to all shells.
Integrating equation (7) yields a new (lower) value for the entropy of each gas mass shell. If we assume that the total gravitational potential of the cluster, which is dominated by dark matter, does not evolve with time, we can use this new distribution555The quantity is most straightforwardly thought of in terms of its inverse, , which is the total mass of gas with entropy lower than . to update the other gas variables (e.g., temperature and density) as a function of time by simultaneously solving the equations of HSE and mass continuity (see M04).
We carry the integration forward in time until the onset of catastrophic cooling (i.e., when or of the innermost mass shell drops to zero). It is at this point in time that a central AGN is assumed to “switch on” and heat the gas (e.g., Kaiser & Binney 2003). We refer to the physical conditions of the ICM at the onset of catastrophic cooling, just prior to AGN switching on, as the “pure cooling model”.
Strictly speaking, a central AGN could switch on before the onset of catastrophic cooling since a massive black hole sitting at the centre of the cluster acts as a mass sink. According to the spherically symmetric model of Bondi (1952), the accretion rate, , onto a central black hole is given by
where is the mass of the black hole and is the entropy of the gas being accreted (e.g., Babul et al. 2002). The heating rate of the ICM, , is typically assumed to be a fraction of the rest mass energy of the accreting material, i.e., , where is the efficiency factor. Taking typical values for and (we assume and , respectively), we find that in order to offset radiative cooling at a rate of ergs s-1 within , must be lower than keV cm2. This is much lower than the minimum cluster entropy of keV cm2 for a cluster found in non-radiative cosmological simulations (see §2.1). If we evolve this baseline gravitational model with radiative cooling until the central entropy reaches keV cm2, we find that the resulting gas profiles are nearly identical to those of the pure cooling model.
It is important to note that there are essentially no free parameters in the pure cooling model. It is the configuration that must result when radiative cooling is applied to the baseline gravitational model specified in §2.1. The gravitational baseline model itself is fixed entirely by the total cluster mass and the baryon fraction , which is set by the cosmological ratio .
The model we are using is evidently idealised. In Appendix A, we briefly discuss the approximations that have been made and their validity. We show that the model provides an accurate description of the cooling problem.
Finally, we re-emphasise that we are not advocating the pure cooling model as a legitimate physical model for the ICM. The sole purpose of the model is to constrain the energetics (of non-gravitational heating) required to drive the observed systems to their present configurations. This is done by first empirically modifying the entropy profile of the pure cooling model as a function of radius so that it matches the observed systems and then comparing the total energies of the modified and pure cooling distributions. Quantifying the energetics in turn allows us to constrain physical heating models for the ICM, which we explore in §4-5.
3 Comparison with Observations
To obtain an unbiased picture of non-gravitational heating in clusters one would ideally like to compare the models to a large, statistically-representative sample observed at high spatial and spectral resolution. While Chandra and XMM-Newton data is of sufficiently high quality to achieve this goal, the construction of large representative samples of uniformly-analysed clusters observed with these telescopes has been slow going. Much of the early interest has been focused on a subset of the most X-ray luminous systems in the universe; i.e., so-called “cool core” (hereafter, CC) systems. By definition, these are systems that are characterised by their central positive temperature gradients and short central cooling times, with gigayears (see, e.g., Sanderson et al. 2006; Dunn & Fabian 2006).
However, it should be reiterated that CC systems are a particular subset of the cluster population. For example, Peres et al. (1998) found that approximately 50% of clusters in the flux-limited sample of Edge et al. (1990) have central cooling times that exceed 4 gigayears. A similar result has recently been reported by Chen et al. (2007) for the HIFLUGCS flux-limited sample (also based on ROSAT and ASCA data). Moreover, because of their high luminosities, one should expect flux-limited samples (as opposed to ideal volume- and mass-limited samples) to be biased in favour of including CC systems. This suggests that NCC systems could actually represent more than half the nearby cluster population, and perhaps an even larger fraction of more distant systems (Vikhlinin et al. 2007).
In light of the above, we have split the comparison to observations of CC and NCC clusters into two sections. In §3.1, we compare the models to new Chandra and XMM-Newton data of CC clusters. In §3.2, we compare the models to ROSAT and ASCA data of NCC clusters.
We attempt to treat the comparison between the observational data and the models in a fair fashion. First, where appropriate the observed quantities are adjusted to account for any differences in the assumed cosmologies. For the models, we compute “spectral” temperatures, as opposed to emission-weighted temperatures (see, e.g., Mazzotta et al. 2004; Rasia et al. 2005; Poole et al. 2007), by first generating synthetic spectra using the MEKAL plasma model (Mewe et al. 1985; Kaastra 1992; Liedahl et al. 1995) with a metallicity fixed to and a typical Galactic absorption column density of cm2 and then fitting the spectra using a single-temperature MEKAL model over the passband of the relevant X-ray instrument. Finally, for the sake of consistency, the same scaling relations used by the observers to estimate, e.g., characteristic radii such as are also applied to the models.
We restrict the comparison to high mass clusters only, with mean spectral temperatures of 3 keV or greater. The reason for this is as follows. As data quality decreases with cluster mass, owing to the decreasing X-ray luminosity with mass, it becomes more and more difficult to reliably measure, for example, spatially-resolved temperature and entropy profiles. As a result, there is an increasing need to take into account more carefully the details of the observing conditions by, e.g., folding the instrumental response of the relevant X-ray instrument into the theoretical models and then reducing the data in the same fashion as the observers. This is beyond the scope of the present study. However, recent analyses of mock Chandra observations of simulated massive clusters have demonstrated that, for example, the standard deprojection techniques for deriving the temperature and density profiles of the ICM from X-ray data should be accurate to within a few percent under typical observing conditions. This is good news for theorists since it means a detailed accounting of the observing conditions is typically not required for massive (high temperature) clusters such as those studied below (e.g., Rasia et al. 2005; Nagai et al. 2007).
3.1 Cool core (CC) clusters
In this section we show that a simple, empirical modification to the pure cooling entropy profile matches observed entropy profiles of CC clusters remarkably well. This modification also simultaneously brings the predicted density profiles, luminosity-temperature relation, and X-ray spectra into excellent agreement with observations. The simultaneous agreement with all these observations is non-trivial, and demonstrates that a wide range of observable quantities can be explained by a single modification to the entropy structure.
3.1.1 Physical Entropy Profiles
In Figure 1, we plot three different sets of observed entropy profiles. Donahue et al. (2006) (hereafter, D06) and Vikhlinin et al. (2006) (hereafter, V06) used Chandra data to derive the ICM radial profiles for two different samples of CC systems. In both studies the profiles were fitted with smooth parametric models. We use their models and associated best-fit parameters to reconstruct the entropy profiles of their systems (see Table 6 of D06 and Tables 1-3 of V06). The third data set is from Pratt et al. (2006) (hereafter, P06), who derived the ICM radial profiles of another sample of CC clusters using XMM-Newton data. In all three studies, the ICM radial profiles were derived using a standard deprojection technique incorporating the spatially-resolved projected temperature and surface brightness profiles of their clusters.
The sample of D06 was constructed from archival Chandra data, typically limiting their analysis to relatively small radii ( kpc). The observations of V06 and P06, by contrast, were designed to probe out to much larger radii ( Mpc). The three data sets therefore complement each other nicely, providing good continuous radial coverage out to . The observed entropy profiles show a high degree of uniformity, particularly at large radii. This is in spite of the fact that the mean temperatures of their systems span more than a factor of 3 or so. Reassuringly, the entropy profiles of the three studies show very similar properties at intermediate radii ( kpc kpc), where there is significant overlap between them. At very small radii, a minimum entropy ranging from keV cm2 is apparent in the data of D06, while at large radii the profiles appear to asymptote to a near powerlaw distribution.
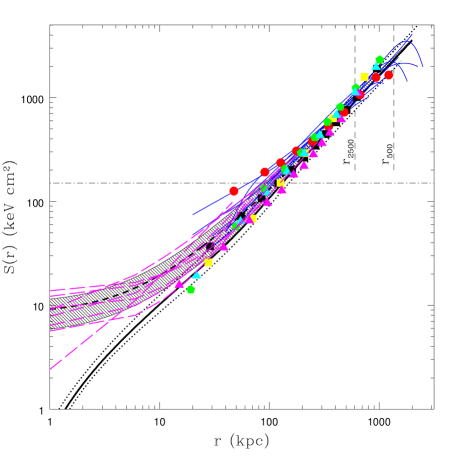
The entropy profiles predicted by the pure cooling model for three different masses are also plotted in Fig. 1. This mass range is chosen so that the corresponding range in mean spectral temperatures is comparable to that of the observed clusters. A comparison of the observed profiles to the profiles predicted by the pure cooling model leads us to conclude that: (1) at small radii ( kpc or so), the observed systems show evidence for excess entropy relative to the pure cooling model; and (2) at larger radii, where the effects of radiative cooling are minimal, the observed systems tend to converge to the theoretical distributions. We comment on this second point in more detail below.
Voit & Donahue (2005) recently reached the same conclusions by comparing a similar cooling-only model (see Voit et al. 2002) with the profiles of D06. (However, since the data of D06 is limited to kpc, the second conclusion was less evident.) Like Voit & Donahue (2005), we find that modifying the pure cooling model by adding an entropy pedestal (i.e., a constant value to all radii) of keV cm2 results in reasonable agreement with the observed profiles; however at intermediate radii of roughly kpc 300 kpc a pedestal of this amplitude produces entropies that are somewhat too low compared to the observed profiles. We find that the following linear relation
| (8) |
yields a better fit to data at radii of kpc or so, beyond which the data map closely onto the baseline profile. We therefore construct a “linear modification” in which the entropy profile follows equation (8) until it intersects666Note that the radius at which these profiles intersect varies with total cluster mass. with the pure cooling entropy profile. However, it is worth bearing in mind that the clusters studied by D06, V06, and P06 all have implied central cooling times of less than 1 gigayear or so and therefore represent somewhat extreme examples of CC clusters (what would previously been termed “massive cooling flow systems”). CC systems with higher central cooling times (but less than about 4 Gyr) do exist (see, e.g., Fig. 7), but typically do not have published Chandra or XMM-Newton data available. Therefore, as discussed in §4, use of equation (8) to represent observed CC clusters will yield the minimum amount non-gravitational heating needed to explain the structural properties of the CC cluster population.
Finally, in §5 we show that a plausible physical origin for this modification given by equation (8) could arise from the combined effects of preheating and radiative cooling. It is important to note, however, that since the central cooling time of these CC systems is quite short this configuration is not stable. Therefore, some form of episodic or continuous heating is required to maintain it. As we demonstrate in §5, this can be achieved with AGN heating at the cluster centre.
3.1.2 Scaled Entropy Profiles
Gravitational shock heating naturally boosts the entropy of the intracluster gas at large radii to high values. Under such conditions, any additional entropy/energy injection of the level normally associated with AGNs will only comprise a small perturbation. In the limit where non-gravitational physics is negligible at large radii, gravitational self-similarity is expected to hold. This implies that systems of varying total masses all have identical structure. Therefore, once the total mass dependence of the various structural profiles (such as the temperature and density profiles) have been removed by dividing by some appropriate set of characteristic quantities (such as the virial temperature, some multiple of the critical density, etc.), the radial profiles of systems of varying mass will be equivalent. Comparing the profiles in these scaled units therefore tests further our understanding of the physics of the ICM. We use the data of V06 and P06, which probe out to large radii, for this purpose.
For the observed systems, we scale the radial coordinate by the observationally-inferred estimates of . This quantity was estimated both by V06 and P06 (see also Pointecouteau et al. 2005 in case of P06) by deriving the total mass profiles via a HSE analysis incorporating the spatially-resolved temperature and surface brightness profiles of the systems. Both studies find that a NFW profile matches the inferred mass structure remarkably well and the resulting mass-concentration relationships are in excellent agreement with that derived from cosmological simulations and assumed by our models. Self-similarity implies that the characteristic entropy of a system should scale with its temperature. Thus, to scale the entropy of the observed profiles we make use of the measured mean spectral temperatures777We note that P06 have also presented their entropy profiles in scaled units (see their Figure 6) in order to make a direct comparison with the baseline entropy profile of Voit et al. (2005) (see equation 3). However, this requires a significant extrapolation of the observed profiles, which typically can only reliably be measured out to (see Arnaud et al. 2005). Thus, there is some risk of introducing a bias by comparing the observed and theoretical properties out to (see, e.g., the discussion in the appendices of V06). Accordingly, we elect to compare the models to the data within .. In both cases, the mean spectral temperatures have been “cooling flow corrected” by excising data from the central regions. In the case of V06, the central (3-D) 70 kpc was excised, while in P06 (see also Arnaud et al. 2005) (projected) data within was excised. In the models, we find that this mismatch results in only a few percent difference in the estimated mean spectral temperature. We neglect this small difference.
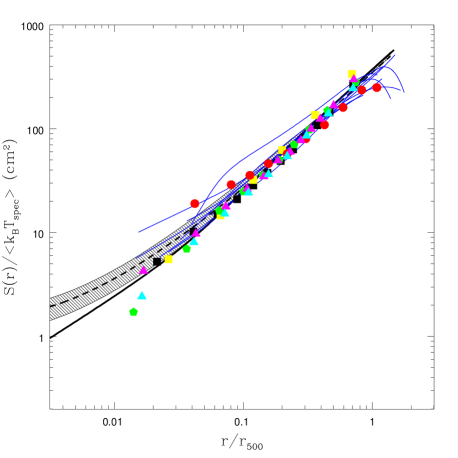
To make a fair comparison between the models and the data, we compute the mean spectral temperature over a similar passband to that of Chandra and XMM-Newton (we use 0.1-10.0 keV) within the annulus for the model clusters. This is done by fitting a single-temperature MEKAL plasma to the synthetic spectra extracted from this annulus. We use the true (physical) value of to scale the radial coordinate for the model clusters.
We plot in Figure 2 a comparison of the scaled observed and theoretical entropy profiles. Scaling according to the self-similar model has the effect of significantly reducing the scatter in the observed profiles. In fact, the remaining scatter is consistent with statistical measurement uncertainties (typically of order 5-10%), at least at large radii. More importantly, the agreement between the observed and theoretical profiles, particularly at large radii, is exquisite.
Recently, there have been reports that the observed entropy profiles at large radii are better described by a scaling of , as opposed to the self-similar scaling . However, based on Fig. 2, such a scaling does not seem to be required for high mass systems. (We remind the reader that we have omitted low mass systems with spectral temperatures less than 3 keV.) The higher mass systems appear to obey self-similarity at large radii.
3.1.3 Gas Density Profiles
If the ICM is in HSE, then its density will be set by its entropy distribution and the depth of the (dark matter-dominated) gravitational potential well (see §2.1). Therefore, a comparison between the observed and theoretical gas density distributions provides an excellent check of the results in §3.1.1-3.1.2.
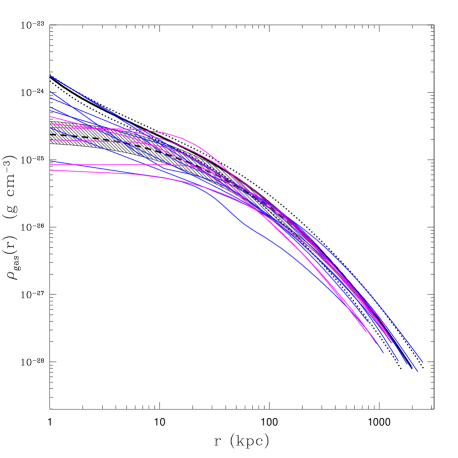
In Figure 3, we plot the fits of V06 and P06 to their observed gas density profiles along with the gas density profiles of the model clusters plotted in Fig. 1. A comparison of the observed gas density profiles with those predicted by the pure cooling model leads to the following conclusions: (1) at small radii the observed clusters are under-dense with respect to the pure cooling model; and (2) at large radii the observed and theoretical profiles show evidence for convergence. If the pure cooling entropy profiles are modified as in §3.1.1, we find that this yields gas density profiles in excellent agreement with the observed profiles at small radii.
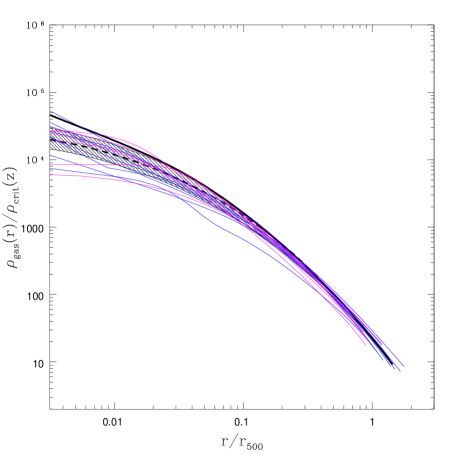
Figure 4 presents the gas density profiles scaled according to the gravitational self-similar model. In these scaled units the linear modification to the pure cooling model (see eqn. 8) is in excellent agreement with the data over all radii. As noted above, this agreement is non-trivial. Moreover, it confirms the results of §3.1.2, that the ICM at large radii scales according to the gravitational self-similar model. If the entropy scaled as , as recently proposed, this would imply , but we see no evidence for this in the hot clusters plotted in Fig. 4.
3.1.4 Luminosity-Temperature Relation
Up this point we have examined only the radial profiles of CC systems and their ability to be explained by a simple modification to the pure cooling model. However, derivation of the deprojected (3-D) radial profiles is a model dependent process. For example, spherical symmetry is often assumed as it considerably simplifies the analysis. A single-phase medium is also implicitly assumed in this process. The validity of these assumptions can be tested to some degree by comparing to the integrated luminosities and mean temperatures of clusters. The idea is to compare the theoretical predictions to data that has undergone as little processing as possible.
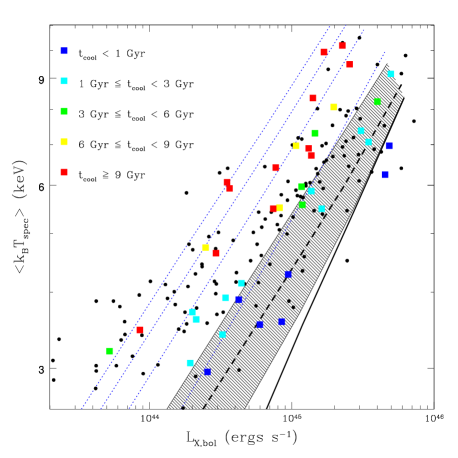
Plotted in Fig. 5 is the bolometric X-ray luminosity—mean spectral temperature relation of clusters in the ASCA Cluster Catalog of Horner (2001). Importantly, neither the luminosities nor temperatures of the observed systems have been corrected for the presence of cool cores. As noted in previous studies (e.g., Markevitch 1998; M04, O’Hara et al. 2006; Balogh et al. 2006, Chen et al. 2007), the scatter in the (uncorrected) observed luminosity-temperature relation cannot be accounted for by measurement uncertainties. Rather it is due mainly to variations in the properties of the ICM in the cores of clusters. This is clearly demonstrated by colour coding a subset of the clusters according to their central cooling time, which we estimate using the central ROSAT gas density measurements Mohr et al. (1999) (kindly provided by J. Mohr) and the ACC temperatures. Clearly there is a strong trend in Fig. 5, with clusters that have short (long) cooling times being over-(under-)luminous with respect to the mean relation.
Consistent with the results presented above, we find that the observed systems are under-luminous (because they are under-dense) with respect to the pure cooling model (see also Voit et al. 2002; M04). Modifying the entropy profile at small radii as done in §3.1.1 brings the theoretical predictions into excellent agreement with the observed relation of CC systems. We discuss the NCC systems plotted in Fig. 5 in §3.2.
3.1.5 Spectral Properties
A further important observation that must be reproduced is the absence of many low-energy iron lines in the XMM-Newton RGS spectra of CC systems. As discussed in Peterson et al. (2003) (hereafter P03), a number of transitions in Fe provide a very sensitive thermometer of low temperature ( keV keV or so) plasmas. P03 compared their RGS spectra of a sample of CC systems with the predictions of the cooling flow model of Fabian and collaborators (e.g., Fabian & Nulsen 1977; Fabian et al. 1984; Johnstone et al. 1992; see also Cowie & Binney 1977) and concluded that there is a significant deficit of emission from many key low-energy iron lines (see also Peterson et al. 2001; Kaastra et al. 2004). The implication is that the cooling of the ICM appears to be halting at a temperature floor of a few keV.

Given the excellent simultaneous match of the modified pure cooling model to the entropy and gas density profiles, one might expect automatic agreement with the X-ray spectra. However, it should be kept in mind that: (1) the P03 cluster sample differs from the samples of V06 and P06; (2) the instrument characteristics (and systematics) of the XMM-Newton RGS are quite different from those of the Chandra ACIS or XMM-Newton EPIC instruments; and (3) in the case of V06 and P06 single-phase spectral models were assumed and the profiles were azimuthally-averaged. This last point is worth particular attention. Unlike the other instruments, which have comparatively poor spectral resolution, the XMM-Newton RGS can resolve the low-energy Fe L complex. Consequently, if there is a significant amount of cool gas (below a few keV) it will be detected, regardless of whether the gas is single- or multi-phase or if there has been azimuthal averaging. Thus, an examination of the agreement (or lack of) between the RGS spectra and the models is worthwhile.
Plotted in Figure 6 is the predicted low-energy X-ray spectra of the pure cooling model and the linear modification to the pure cooling model. The various spectral lines all probe slightly different temperature ranges, but the ones to focus on are Fe XXII, Fe XXI, Fe XX, Fe XIX, Fe XVIII, and Fe XVII (which are labelled), all of which are sensitive to temperatures of keV (see Table 1 of P03). These lines are completely absent in the RGS spectra of the moderate mass ( keV keV) CC clusters studied by P03, and show up only weakly in their lower mass systems.
A comparison of the predicted spectra clearly demonstrates that the relevant lines are virtually absent when the pure cooling model is modified by eqn. (8). The simple reason for this behaviour is that boosting the central entropy has the effect of boosting the central temperature of the ICM. For our model clusters spanning the mass range we find minimum (3-D) temperatures ranging from keV keV, with the highest minimum temperatures corresponding to the most massive systems. Phrased in another way, we find that the coolest gas in the modified pure cooling model is only times lower than the ambient ICM temperature. This agrees very well with the observational estimates of P03.
The simultaneous agreement with the RGS spectra and the gas and density profiles therefore points to a simple picture for the ICM in CC systems; it is fully consistent with a single-phase medium in hydrostatic equilibrium within a gravitational potential whose shape was predicted by cosmological simulations. (In Appendix B, we go further and show that previous arguments used in support of multi-phase cooling are, in fact, fully consistent with our single-phase models.) In §5, we describe a simple physical model that can give rise to the appropriate entropy distribution of CC clusters.
3.2 Non-cool core (NCC) clusters
There is currently a dearth of high spatial and spectral resolution observations of NCC clusters, even though they could represent more than half of all clusters. We therefore compare our models to available ROSAT and ASCA data.
In terms of radial profiles, only the gas density profile (as opposed to the temperature or entropy profile) can be robustly determined in the absence of high quality spatially-resolved spectra. The gas density profile can essentially be derived from the X-ray imaging alone, since the X-ray luminosity scales as . So even if one assumes an ICM temperature that is incorrect by a factor of 2 this translates to less than a 20% error in the gas density estimate. This is good news since theoretical models predict (and new spatially-resolved observations confirm, at least in the case of CC systems) that the temperature of the ICM varies by less than about a factor of 2 from the cluster centre to its periphery.
Plotted in Figure 7 are the ROSAT gas density profiles of a sample of 45 hot clusters (selected from the 55 clusters in the flux-limited sample of Edge et al. 1990) studied by Mohr et al. (1999; kindly provided by J. Mohr). These profiles were derived assuming an isothermal ICM using mean spectral temperature measurements from the literature. We have adjusted the gas density profiles to conform with the more recent (uniform) ASCA temperature measurements of Horner (2001) but, for the reason mentioned above, this is only a very minor correction. The radial coordinate has been normalised by , where this quantity has been estimated using the observationally-calibrated relation (see Mohr et al. 1999):
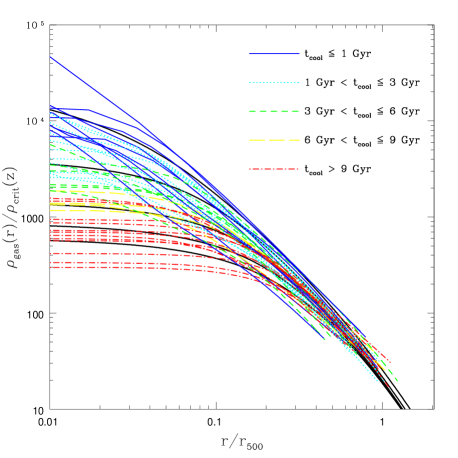
| (9) |
At small radii, the observed gas density profiles show more than an order of magnitude in dispersion, with the scatter clearly being strongly correlated with the estimated central cooling time and therefore CC/NCC designation. The bulk of the dispersion at small radii, however, is associated with the NCC population. At large radii (beyond ), the gas density profiles tend to converge and there is no strong evidence for a correlation between central cooling time and the dispersion in the gas density there. In other words, outside the core the ICM properties of NCC and CC clusters are very similar, as noted previously (e.g., Markevitch 1998; Neumann & Arnaud 1999).
In the absence of high quality data to actually measure for the NCC systems in which we are interested here, we assume that their entropy structure can be explained by adding a pedestal (i.e., a constant value to all radii) to the pure cooling entropy profile, and we constrain the range of amplitudes necessary to explain the observed gas density profiles. Note that this procedure implicitly assumes that the ICM in NCC systems is similar to that in CC systems; i.e., it is a single-phase medium in HSE confined within a similar NFW gravitational potential. Detailed measurements are obviously needed to test these assumptions.
In agreement with our previous findings, adding a pedestal of keV cm2 to the entropy profile of the pure cooling model results in a scaled gas density profile that is in reasonably good agreement with the extreme CC systems in Fig. 7 (see §3.1.1). Although from the comparison with higher quality data we can expect the linear modification (see eqn. 8) would yield even better agreement with these systems, since our focus here is on the NCC systems where such high resolution data is unavailable, use of this more complex modification is unwarranted.

Modifying the pure cooling entropy profile with pedestals of amplitudes ranging from approximately keV cm2 to 700 keV cm2 brackets the gas density profiles of most of the observed NCC systems. Not only does the pedestal modification with this range of amplitudes simultaneously match the intrinsic scatter at small and large radii, but it also does well in matching the shapes of individual profiles.
A look back at Fig. 5 reveals that this range of amplitudes also brackets the NCC systems on the observed luminosity-temperature relation. (The predicted slope of the relation for a model with fixed pedestal amplitude is steeper than the observed relation, but this is not of concern since the observed scatter and Fig. 7 clearly rule out a universal pedestal amplitude.) In fact, the inferred range of pedestal amplitudes necessary to explain the data plotted in Figs. 5 & 7 is in excellent agreement with constraints based on studies of the scatter in various other X-ray and SZ effect scaling relations (e.g., Babul et al. 2002; McCarthy et al. 2002; 2003; M04; Balogh et al. 2006).
Finally, in anticipation of the release of representative samples of clusters observed at high resolution (e.g., with Chandra), we present in Fig. 8 our expectation for the distribution of the central entropies in these clusters. The central entropies are derived by placing the ROSAT gas density profiles of Mohr et al. (1999) in hydrostatic equilibrium within a NFW gravitational potential. The central entropies, , are measured at a fiducial radius of , typically corresponding to a physical radius of kpc. Our results are not sensitive to this choice of radius, since almost all the clusters show evidence for cores at least this size.
Fig. 8 shows that only 5% of systems should have central entropies of keV cm2 or lower. This puts into perspective the focus of the majority of observational studies based on Chandra and/or XMM-Newton data so far. Furthermore, we find that 25%, 50%, and 75% of clusters should have central entropies that are approximately less than 40, 120, and 290 keV cm2, respectively. Note that, at least in the models, systems with central entropies of keV cm2 have gigayears and would therefore be classified as CC clusters.
To a good approximation, we find that the distribution plotted in Fig. 8 can be represented by the following functional form:
| (10) |
for keV cm2 keV cm2.
Note that, given the current data, this is the distribution that should result if NCC clusters are dominated by NFW profiles, with single-phase gas in hydrostatic equilibrium, as the CC clusters appear to be. If the upcoming studies reveal a distribution that is significantly different from this one, it might signal a break down of one or more of these assumptions for the NCC population.
4 Heating Energy Requirements
To explain the observed properties of the ICM, energy is required to (1) transform the initial pure cooling state to the observed one; and to (2) maintain this state. We demonstrate below that in order to satisfy the first condition, huge amounts of energy are required if the systems are heated from within at (or near) the present day. This is especially the case for the NCC systems. Preheating is an attractive, energy-efficient alternative for satisfying the first condition. We then demonstrate that once the observed state has been achieved, maintaining this configuration is energetically much easier to accomplish. This energy might, for example, come from jets or bubbles injected by AGN at the cluster centre, although the details of the energy injection are not pertinent to the argument.
4.1 Reaching the observed state with internal heating
If the ICM evolves initially to the convergent pure cooling state and then is heated from within at (or near) the present day, the total energy that must be injected in order to explain the structure of clusters is just the difference of the total energies of the observed systems and the pure cooling model. We use the modifications to the pure cooling model discussed in §3.1-3.2 to represent “smoothed” versions of the observational data. Note that this energy calculation does not make any assumptions about the form of the heating. In the absence of sources or sinks, there is a unique (path-independent) energy requirement to transform the properties of a gas from some initial configuration to some final configuration. In the case of the ICM, radiative losses that take place after (or during) the heating are likely relevant, which implies that the above calculation actually yields a minimum energy requirement. However, the structural uniformity of the gas at small radii in extreme CC clusters (e.g., all have minimum entropies of keV cm2) combined with fact that the majority of time spent cooling is at the highest entropies (lowest densities) argues against energy injection levels significantly higher than inferred with the above approach, at least for the CC systems in §3.1. In the case of extreme NCC systems, radiative losses should be unimportant and therefore our energy estimates should be robust for these systems as well. It is the systems that lie in between these two extremes where our energy estimates could be underestimated by up to a factor of two or so.

In Figure 9, we present the cumulative energy distributions required to transform from the pure cooling state to the observed state of CC clusters. Evidently, a total energy ranging from ergs, with a typical value of ergs, must be injected into the ICM to explain the structural properties of cool core clusters. It is interesting to note that an energy of ergs is roughly equivalent to 10% of the total thermal energy of a CC cluster (within ) or half the total energy a CC cluster would radiate over a period of 10 gigayears. But such a large injection of energy is not beyond the realm plausibility. For example, the recently discovered “cluster-scale” X-ray bubbles in Hercules A (Nulsen et al. 2005) and MS0735.6+7421 (McNamara et al. 2005), which were presumably blown by a central AGN, require up to ergs to inflate. This is only a factor of a few lower than required to account for CC systems. However, such systems appear to be rare at the present epoch.
In order to explain the observed structure of NCC systems, we find that typically an order of magnitude more energy is required. In particular, total energies ranging between ergs are needed, where the lower and upper values correspond to the 100 keV cm2 and 700 keV cm2 pedestal modifications, respectively. This dwarfs the energy output for the most powerful AGN bursts known in Hercules A and MS0735.6+7421. But McCarthy et al. (2007b) have shown that such large energy requirements are still within the range of theoretical plausibility for AGN if one adopts an efficiency factor of , as predicted by jet models with near-maximally rotating black holes (e.g., Nemmen et al. 2007), and takes into account outflows from not only the central BCG but from all the bulge-dominated systems in the cluster (e.g., Nusser et al. 2006). On the other hand, the above calculations would imply that every cluster has had outbursts at least as powerful as those observed in Hercules A and MS0735.6+7421 at some point during their lifetimes and perhaps 50% of those have had bursts that were an order of magnitude larger still.
4.2 Reaching the observed state with preheating
In §4.1, we assumed that the ICM reached the pure cooling configuration and was then heated by some means to the observed configuration. The energy requirements to reach the observed configuration can potentially be lowered, however, if the intracluster gas is heated before it falls into the cluster potential well (e.g., Kaiser 1991; Evrard & Henry 1991; Bower 1997; Balogh et al. 1999; Babul et al. 2002; Voit et al. 2002; Oh & Benson 2003). Such “preheating” is much more energetically efficient than internal heating (see Appendix C for a detailed comparison between the energetics of preheating and internal heating). Using simple 1-D models, Voit et al. (2003) have shown that if the accretion is smooth, preheating adds a pedestal to the baseline gravitational entropy profile with an amplitude that is basically the preheating level, (see also Lu & Mo 2007). Assuming the gas is initially cold, and therefore its thermal energy prior to preheating is negligible, the energy required to add a pedestal of amplitude to the baseline gravitational entropy profile888Note this is essentially equivalent to adding a pedestal to the pure cooling entropy profile so long as the level of preheating is large compared to the difference between the baseline gravitational and pure cooling entropy profiles. This condition is easily satisfied for physically interesting values of . is given by:
The energy required to preheat the ICM therefore scales linearly with the preheating entropy and with redshift as . The redshift dependence enters through decreasing baryon density of the universe due to Hubble expansion. We note, however, that equation (11) will underestimate the required energy somewhat at low redshifts. This is because the density of the baryons will likely exceed the universal mean value , since some of the baryons will have begun to collapse and will have decoupled from the global expansion of the universe (see, e.g., Balogh et al. 1999). In addition, some fraction of these baryons may already have collapsed into smaller dense (possibly virialised) subsystems (e.g., Voit et al. 2003). Equation (11) therefore represents the minimum energy required to preheat the gas to entropy at redshift .

The relevant range of redshifts would presumably fall between the epochs of cluster formation and reionization, which is when the first sources of non-gravitational heating turned on. A physically sensible range would therefore be . In Fig. 10 we plot the energy required to preheat the ICM of a typical cluster as a function of redshift for various choices of . As we discuss later (see §5), for clusters preheated to less than about keV cm2, there is sufficient time between the epoch of preheating and the present day for radiative cooling losses to reduce the amplitude of the entropy core to the level observed in present-day CC clusters. Clusters preheated above this level, however, will not have had the time to remove their initial entropy cores. Such systems could potentially provide a viable explanation for present-day NCC clusters.
We find that if preheating occurs late, say from (i.e., approximately when the universal star formation rate peaks), one can plausibly explain the present-day structure of both CC and NCC clusters with up to two orders of magnitude less energy than if these systems were heated from within at the present-day. For example, a Hercules A-like outburst at could potentially account for even the most extreme NCC clusters today. However, there is little to be gained if preheating occurs close to the epoch of reionization, simply because the baryon density is much higher then and therefore much greater energy is required to raise the entropy of the gas to the required level.
While (late) preheating is a physically attractive scenario, whether or not it actually occurred is still not known. At present, there is no theory that self-consistently links preheating to galaxy and/or black hole formation. There are several pieces of circumstantial evidence in support of preheating. For one, there are no observed sources of non-gravitational heating powerful enough to explain the structure of moderate and extreme NCC clusters if heated from within. Secondly, it is now well known that AGN, the most likely culprit behind preheating, were much more active in the past than they are at present-day (e.g., Schmidt & Green 1983; Hasinger et al. 2005). Finally, the observed diffuse X-ray background appears to be too faint compared to that predicted by cosmological simulations that do not include some very energetic and widespread form of non-gravitational heating (Pen 1999; Bryan & Voit 2001; but see Roncarelli et al. 2006).
On the other hand, high resolution Chandra data (e.g., D06; Sanderson et al. 2006) indicates that the central cooling time of the gas in many CC clusters typically ranges from yr. The abundance of such systems makes it highly unlikely that preheating is the whole story for these CC systems. It would be a remarkable coincidence if such clusters were (pre)heated only once and that now we just happen to be observing them a mere yrs before the onset of catastrophic cooling. The same argument also applies in the case of heating following cluster formation — a single burst seems irreconcilable with the short central cooling time of the ICM in CC clusters. It therefore seems inevitable that there is either episodic or continuous heating occurring in CC clusters at the present day. But, as we demonstrate in §5, this does not imply that preheating does not have a role to play in the formation of CC systems.
In the case of NCC clusters, the central cooling times are many gigayears (by definition), so a single bout of preheating is fully compatible with the current suite of observational data (see M04 for additional discussion).
4.3 Maintaining the observed state
Maintaining the current (observed) structural properties is energetically much easier than getting to this state in the first place. For example, within the central 300 kpc, where the pure cooling model deviates from the observed systems, a typical CC cluster radiates ergs s-1. The central cooling time of the gas in CC clusters is yr, implying that non-gravitational heating events must be occurring on this timescale or shorter. There is mounting observational evidence that suggests AGN-blown bubbles are somehow offsetting radiative losses in CC clusters. Typical (i.e., not cluster-scale) X-ray bubbles in massive clusters require ergs to inflate (e.g., Bîrzan et al. 2004) which, in order to balance radiative losses, must be dissipated on a timescale of yr. This is consistent with the cooling time estimates and also with the estimated ages of observed bubbles (e.g., Dunn & Fabian 2006), which is suggestive that the bubbles could indeed be responsible for offsetting radiative cooling losses.
It would be possible to stop the paper at this point, and conclude that, while preheating must play a role in NCC clusters, the energetics of bubble heating appear sufficient to offset the cooling luminosity of CC clusters. However, it has proved difficult to construct a simple, steady-state model for CC clusters in this way, since it is then necessary to efficiently distribute this energy over the entire cooling region. In the following section we demonstrate that preheating alleviates this necessity, by greatly delaying the cooling of CC clusters, holding them in their observed states for longer than the lifetime of the systems. Moreover, this allows us to construct a single framework for explaining both NCC and CC clusters. We emphasise, however, that the conclusions we have reached in this section do not depend at all on the particular heating model we describe below.
5 A SIMPLE HEATING MODEL FOR COOL CORE CLUSTERS
Clearly preheating cannot be the whole story for CC clusters. Given the relatively short central cooling times in clusters preheated to keV cm2, some form of ongoing heating is also needed. Bubbles inflated by AGN have the energy required to do this; the difficulty lies in coupling this energy to the cooling gas. Conventionally, the heat input is pictured as balancing the cooling emissivity throughout the cooling region. If heating matches cooling shell by shell, there is no flow of gas and the cluster will exist in a steady state. The problem with this approach is that it is difficult to imagine mechanisms where the radial distribution of the heat input is naturally tuned to match the radial dependence of the cooling rate. Heating is typically a -dependent process, while collisional cooling depends on . For example, in Appendix D, we outline the difficulties of distributing heat through thermal conduction: without ad-hoc tuning of the magnetic field structure, heating the centre of the cluster actually leads to increased cooling at intermediate/large radii.
We therefore take another approach to this problem: an acceptable solution does not necessarily require a balance between heating and cooling within each shell that maintains a perfect steady state. Indeed, it is acceptable to preferentially heat the cluster at its centre so long as the resulting gas flows preserve the system’s density profile, only allowing the profile to evolve over timescales longer than the lifetime of the system (i.e., on timescales gigayears). Below we consider an extreme example of such a scenario. By heating the gas only at the cluster centre and then allowing it to float buoyantly outwards, we show that a quasi-steady state can be established. By combining this heating model with the preheating that we have discussed in §4, we show that this model provides a good explanation of CC cluster properties.
5.1 The “wood stove” approximation
A wood stove is able to heat your house even though it is small and located in the corner of a room. It does this by heating the air in its immediate surroundings. The warm air convects around the house mixing with the cooler air and distributing its heat. It works because of the buoyancy of the hot air compared to the ambient temperature. Compared to an open fire, relatively little heat is radiated, making the stove vastly more efficient. This type of heating is somewhat analogous to the picture of AGN heating that we are presenting. In our model, we are assuming that the radiant heating (referred to as “distributed heating” in clusters) is negligible. Because it heats at a lower temperature, an immersion water heater is possibly a better, but less poetic, analogy.
5.1.1 Model description
In the following sections, we consider the effect of embedding an AGN “wood stove” within a cluster. We first consider a cooling cluster that has not been preheated. This is essentially a simplified version of the detailed “circulation flow” models explored by Mathews et al. (2003; 2004). The treatment described below is incorporated into our time-dependent hydro algorithm outlined in §2. First, we specify a minimum entropy threshold that signals when the central AGN is to ‘switch on’. So when radiative cooling reduces the entropy of a parcel of gas below this threshold, we assume that it is heated by the AGN. We use the observations of D06 as a guide and adopt a minimum entropy threshold of 10 keV cm2 (note, however, that the minimum entropy need not be fixed to match these specific data). As in Mathews et al. (2003; 2004), we do not specify the physical mechanism that is responsible for heating the gas at small radii. One possibility is that outflowing bipolar jets shock heat the gas at small radii, so long as they do not introduce large entropy inversions in the ambient ICM (Voit & Donahue 2005). Another possibility is heating by cosmic rays associated with the jet. Since the entropy profiles of the model clusters increase monotonically with radius, the heating always occurs near the cluster centre, at radii of a few kpc. The minimum entropy threshold of 10 keV cm2 corresponds to the minimum entropy that the gas parcel can be heated to, . The maximum entropy that the parcel of gas can be heated to, , is left as a free parameter which we vary. As described below, this is equivalent to varying the maximum (3-D) radius a bubble can float to.
Physically, there is no reason to expect that successive AGN bursts will always heat gas to the same entropy. Variations are to be expected as the local properties of the ICM are time variable. However, it is beyond the scope of the present study to self-consistently link the properties of the cooling ICM with the accretion disk physics of black holes. Instead, we simply assume a uniform probability heating distribution between and , so that any value within this range is equally likely to result. Once a new entropy has been randomly assigned, we assume the parcel of gas floats adiabatically out to the radius where its entropy matches that of the ambient ICM. This is the termination radius, where the material is deposited.
In order to clearly distinguish our model from conventional “distributed” heating scenarios, we assume that the bubbles do no heating as they rise (see Appendix E for further discussion). In order to further simplify the calculations, we assume that the bubbles convect out to their isentropic surface instantaneously. One could instead properly take into account the rise time of the material by computing the drag force exerted on the rising material by the ICM if the bubble size is known. However, since the entropy of the material is typically much higher than that of the surrounding ICM (except when it approaches the termination radius), this implies that its density is much lower999We assume the bubbles remain in pressure equilibrium with the ambient ICM as they rise. (this is why the bubbles appear as depressions in X-ray images). Consequently, the material will not contribute much to the observed X-ray properties of clusters, so long as the volume occupied by the bubbles is relatively small. For this reason, one can justifiably neglect the contribution of the hot rising material to those properties of interest here, such as the predicted entropy profiles (see also the appendix of D06).
The models are evolved for a maximum duration of 13 gigayears (i.e., a Hubble time, ) so that we can see the evolution of the core structure, and compare the evolving profiles to those of observed clusters.
5.1.2 Comparison to observed CC clusters
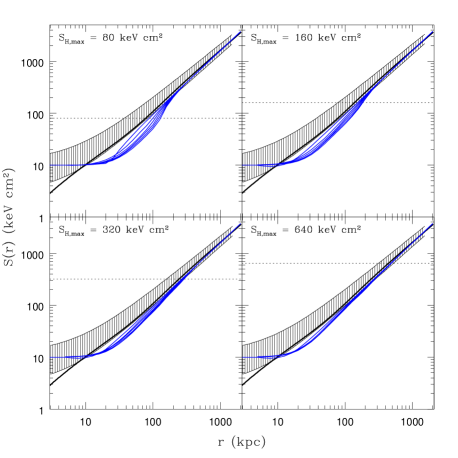
Plotted in Figure 11 are the entropy profile predictions of the “wood stove” model for various choices of the maximum heating level . Since the clusters are in convective equilibrium, can also be thought of as a parameter that controls the maximum radius that the bubbles can float to. If the maximum heating level is relatively small (as in the top two panels of Fig. 11), such that the material is being circulated only within the central 100 kpc or so, we find that entropy profiles evolve relatively rapidly away from the observed profiles at radii of roughly kpc kpc. While the AGN prevents gas from dropping below the minimum at the centre, it clearly does not not prevent material further out in the cluster from cooling. Over the period of 13 gigayears, this cooling material piles up near centre, driving the theoretical profiles away from the observational data.
If the maximum heating level is increased, some fraction of the heated material floats beyond the cooling radius. In this case, the piling up of cool gas at the centre is reduced significantly. However, even in this case a satisfactory match to the mean observed profile is not achieved. Instead, the “wood stove” heating simply maintains the pure cooling entropy profile (except, of course, near ). Physically, this is what one should expect, since the heating source has been designed to affect only the gas at the very centre.
Therefore, it appears that central heating by itself cannot solve the problem. Mathews and collaborators have argued that such a model can maintain the observed profiles of CC systems for long time scales. However, their initial conditions are based on the observed properties of prototypical CC clusters, which can be maintained for long times with this simple heating model. Our results show that this model is not sufficient if one starts from initial conditions based on radiative cooling applied to clusters with properties guided by cosmological simulations.
5.2 Preheating + AGN “wood stove” heating
What is needed is a mechanism for starting the ICM off on a higher adiabat, which the AGN “wood stove” can then maintain. Naively, one way to do this is to simply lower the initial baryon fraction, , of clusters by assuming a larger value of or a smaller value of . (Although the observed baryon fractions of clusters do not permit large adjustments of these parameters; see McCarthy et al. 2007b.) However, this would only have the effect of shifting the theoretical profiles in Fig. 11 up or down. What is really needed is a change in shape of the profiles by preferentially raising the entropy at small and intermediate radii. This is exactly what preheating achieves.
Of course, in our simplified model neither preheating nor convectively rising gas provide heat to the gas at intermediate/large radii (following cluster formation, that is), so the tendency of a model that combines preheating and AGN central heating is to evolve towards the pure cooling state. However, as we demonstrate below, the timescale for this to occur is long compared to the age of the cluster if the level of preheating is sufficiently high. For this reason, the scenario is worth a closer look. Moreover, since we have already seen that preheating is required to explain systems without cool cores (i.e., the NCCs), it is only natural to apply the same model to CC systems as well.
5.2.1 Applying preheating + AGN “wood stove” heating to CC clusters
To mimic the effects of preheating we modify the baseline gravitational entropy profile (eqn. 3) by adding a pedestal of amplitude . The model is then evolved with radiative cooling and AGN heating as described in the previous section. We evolve the model for a maximum duration of gigayears. We will see that relatively small differences in the initial level of heating lead to a very large difference in entropy at the final time.
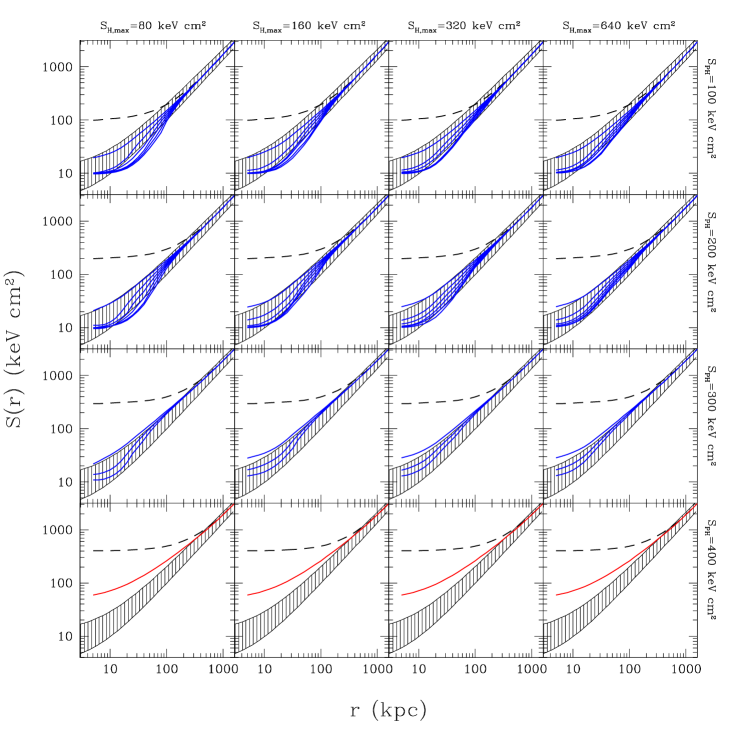
We present the results in Figure 12 for various choices of the level of preheating. As the top panels indicate, preheating the gas to a relatively mild level of keV cm2 certainly yields an improvement relative to the no-preheating case, at least initially. However, after a few gigayears of evolution the theoretical profiles tend to evolve to the lower envelope of the data. This conclusion holds almost irrespective of the “wood stove” heating input. Increasing the level of preheating to keV cm2 or keV cm2, however, results in entropy profiles that are in much better agreement with the observed profiles and remain so for many gigayears following AGN ignition. Note that in the case of keV cm2 (second row from the bottom), only three theoretical curves are visible in each panel. This is simply because it takes nearly 10 gigayears of evolution before the onset of central catastrophic cooling, leaving only 3 gigayears for the AGN “wood stove” to operate. Thus, 300 keV cm2 corresponds nearly to the cooling threshold for massive clusters (see also Voit et al. 2002; M04). This is clearly illustrated by the bottom row of panels, which demonstrates that if the system is preheated to keV cm2 there is insufficient time for catastrophic cooling to occur and, consequently, no heating is initiated. Systems preheated to this degree (or higher) clearly cannot explain CC clusters but may provide a viable explanation for NCC systems (see §4.2).
Based on Fig. 12, we conclude that combining preheating with the AGN “wood stove” model can successfully match the observed properties of CC clusters. This conclusion is not particularly sensitive to the level of preheating or the strength of the heat input. In terms of preheating, entropy injection at the level of keV cm2 keV cm2 results in good agreement with the CC clusters data. If the level of preheating is much lower than this, the model basically reverts back to the no-preheating case (see Fig. 11). If the level of preheating is much higher than this, then: (1) one could not match the observational data for CC clusters at intermediate radii; and, (2) there would be insufficient time by the present day for clusters to form cool cores.
This last point is particularly interesting since both conditions did not have to be met simultaneously. If, for example, the data at intermediate radii actually required heating levels of much greater than keV cm2, this would actually rule out preheating since we do not expect cool cores to form by the present day when the ICM has been preheated at levels much greater than this (see the panels in the bottom row of Fig. 12). In this case, we would be forced to abandon preheating for a more complex form of highly-energetic distributed heating following cluster formation. Instead, the entropy profiles of observed CC clusters can accommodate entropy injection only up to the level of keV cm2 or so, which is consistent with the preheating scenario.
A cluster preheated to the lower bound of keV cm2 requires gigayears of cooling to form a cool core. For a concordance cosmology, this implies that there should be no CC clusters at . In fact, the maximum redshift that one should see CC clusters to under this scenario would likely have to be somewhat lower than this, since . Interestingly, Vikhlinin et al. (2007) have recently reported a deficit of CC clusters at high compared to their abundance today (see also Santos et al. 2008). They suggest that increased merger activity might account for this finding, but this phenomenon could also plausibly be accounted for by preheating. However, a quantitative comparison with the data is required before a more definitive statement can be made. We leave this for future work.
While we have demonstrated that preheating combined with the AGN “wood stove” model is successful at matching the mean radial structure of CC clusters, the model could potentially violate a number of observational constraints. For example, it has been argued that the convective outflows triggered by significantly heating gas at the cluster centre would rapidly destroy the observed peaked metallicity gradients in many CC clusters. We consider these constraints in Appendix E, where we show that the model is entirely consistent with current data. Equally importantly, the simplest “wood stove” model neglects heating in the ambient medium associated with the inflation of bubbles as well as distributed heating by the bubbles as they rise. We discuss these and other relevant issues in Appendix E. We stress, however, that even if the simplest “wood stove” model could be demonstrated to be overly naive, this does not detract from our main conclusion that preheating is required to set the stage for present-day heating (whatever its form) in CC clusters.
6 Summary & Conclusions
Although there has been much progress in understanding the present-day competition between heating and cooling in clusters in recent years, little is currently known about the early heating processes that set the properties of the ICM in the first place. The observed spread in cluster core morphologies is another poorly understood feature of clusters and may provide an important clue to these early heating processes. The purpose of the present study was to shed light on both of these important issues. To quantify the effects of non-gravitational heating in clusters, we developed a physical model for the ICM that includes the effects of gravitational shock heating, which dominates at large radii, and radiative cooling, which is important at small radii. We refer to this as the “pure cooling model”.
A comparison of the pure cooling model to the observations yields the following results:
-
•
At large radii, the profiles of CC and NCC clusters scale according to the gravitational self-similar model, but at small radii the profiles of both types of clusters clearly deviate from the predictions of the pure cooling model.
-
•
A simple modification of the predicted entropy profile of the pure cooling model (see eqn. 8) yields an excellent simultaneous match to the entropy and density profiles of CC clusters and to their luminosity-temperature relation and high resolution X-ray spectra as well (see §3.1).
-
•
NCC clusters, on the other hand, show a much broader scatter in entropy at small radii but their gas density profiles and luminosity-temperature relation can still be described well by a simple pedestal modification (of varying amplitude) to the pure cooling model (see §3.2).
-
•
The energy required to drive most clusters to their observed distributions from the pure cooling state is huge (far exceeding the most energetic AGN bursts observed in the nearby universe for most clusters) if the heating occurs internally following cluster formation (see §4.1). Alternatively, if clusters were preheated at or so, the required energetics can be reduced by up to two orders of magnitude (see §4.2). This puts even the most extreme NCC clusters within reach of observed AGN power output.
-
•
The short central cooling times of CC clusters imply that, in addition to preheating, there must be significant present-day heating as well. (NCC clusters, on the other hand, require no further heating.) In §5, we showed using a simple model that combining preheating and a AGN feedback loop, which is triggered at the onset of catastrophic cooling, can successfully explain the observed properties of CC clusters without fine tuning of the preheating or AGN feedback strengths. We note, however, that AGN central heating by itself (i.e., without preheating) cannot explain the observed systems.
Based on the above findings (and those of our previous studies), we envisage a scenario in which all clusters are preheated to varying degrees. The inferred spread in the central entropies of present-day clusters is large, ranging from keV cm2 up to possibly keV cm2. How would such a large spread be achieved? In particular, since clusters are built hierarchically from many smaller systems, the implication is that NCC clusters would somehow have been built from systems that preferentially had higher levels of preheating activity (associated with galaxy- and supermassive black hole formation). As a consequence, one therefore might expect NCC clusters to have larger galaxy/bulge populations. This is presently an open question. However, it is important to recognise that the spread in present-day central entropies is not equivalent to the spread in intrinsic preheating levels. Radiative cooling losses following preheating act to amplify the intrinsic spread. For example, we have demonstrated that for systems preheated to less than about keV cm2, there is sufficient time for cooling to lower the central entropy to the level observed in CC clusters. On the other hand, if the level of preheating is as high as, say, keV cm2, the effects of cooling will be minimal following preheating. In this way, a factor of only two in the intrinsic spread of preheating levels can give rise to almost two orders of magnitude in dispersion in the distribution of present-day central entropies.
An additional way to generate scatter in the central entropies of local clusters is via cluster mergers. While such mergers do not seem capable of transforming a CC cluster into a NCC cluster (see §1), if the core has already been heated (say, to a moderate CC state) the impact of the merger could be significant. This is simply because the entropy generated in the shock depends on the inverse of the pre-shock density to the two-thirds power (e.g., Voit et al. 2003). Heating the gas non-gravitationally first lowers the density of the ICM which, in turn, will increase the efficiency of the shock heating that occurs as a result of the merger (e.g., Borgani et al. 2005; McCarthy et al., in preparation).
Whatever the mechanism that generates the dispersion, we hypothesise that the systems that were significantly preheated may have evolved into NCC clusters we see today. Systems that were initially heated to keV cm2 or lower, however, have sufficient time to develop cool cores. In this case, eventually catastrophic cooling feeds a supermassive black hole at the cluster centre which initialises a jet that heats the gas and inflates buoyantly rising bubbles. However, the signature of preheating is still left behind in these systems as an excess entropy (relative to the pure cooling profile) at intermediate radii ().
Our findings do not rule out the contribution of additional sources of heating such as thermal conduction or distributed AGN heating. However, we would argue that our model represents the most physically simple and energy efficient heating scenario yet proposed that is consistent with the observed properties of the whole (i.e., both CC and NCC) cluster population. Detailed high quality measurements of large representative samples would go a long way towards confirming or ruling out our proposed picture. Fortunately, we may not have to wait long, as the release of several such samples appears imminent (see, e.g., Sanderson et al. 2006; Pratt et al. 2007; Vikhlinin et al. 2007; Hudson, Reiprich et al. in prep.).
Acknowledgments
The authors thank the referee for suggestions that significantly improved the paper. They also thank Brian McNamara, Alastair Edge, and Mark Voit for useful comments and Megan Donahue, Don Horner, Gabriel Pratt, Alexey Vikhlinin, Joe Mohr, and Alastair Sanderson for providing their observational data. IGM thanks Mark Fardal and Andisheh Mahdavi for helpful discussions and acknowledges support from a NSERC Postdoctoral Fellowship. AB and MLB acknowledge support from NSERC Discovery Grants. AB also extends his appreciation to the Universities of Durham and Oxford for hosting him during his tenure as the Leverhulme Visiting Professor, during the course of which the present study was carried out. RGB acknowledges the support of a PPARC senior fellowship.
References
- Abadi, Bower, & Navarro (2000) Abadi M. G., Bower R. G., Navarro J. F., 2000, MNRAS, 314, 759
- Allen (2000) Allen, S. W. 2000, MNRAS, 315, 269
- Arnaud et al. (2005) Arnaud, M., Pointecouteau, E., & Pratt, G. W. 2005, A&A, 441, 893
- Babul et al. (2002) Babul, A., Balogh, M. L., Lewis, G. F., & Poole, G. B. 2002, MNRAS, 330, 329
- Balbus (1986) Balbus, S. A. 1986, ApJL, 303, L79
- Balogh et al. (1999) Balogh, M. L., Babul, A., & Patton, D. R. 1999, MNRAS, 307, 463
- Balogh et al. (2006) Balogh, M. L., Babul, A., Voit, G. M., McCarthy, I. G., Jones, L. R., Lewis, G. F., & Ebeling, H. 2006, MNRAS, 366, 624
- Balogh et al. (2001) Balogh, M. L., Pearce, F. R., Bower, R. G., & Kay, S. T. 2001, MNRAS, 326, 1228
- Bertschinger (1989) Bertschinger, E. 1989, ApJ, 340, 666
- Best et al. (2007) Best, P. N., von der Linden, A., Kauffmann, G., Heckman, T. M., & Kaiser, C. R. 2007, MNRAS, 379, 894
- Binney & Tabor (1995) Binney, J., & Tabor, G. 1995, MNRAS, 276, 663
- Binney & Tremaine (1987) Binney, J., & Tremaine, S. 1987, Princeton, NJ, Princeton University Press, 1987, 747
- Bîrzan et al. (2004) Bîrzan, L., Rafferty, D. A., McNamara, B. R., Wise, M. W., & Nulsen, P. E. J. 2004, ApJ, 607, 800
- Blanton et al. (2001) Blanton, E. L., Sarazin, C. L., McNamara, B. R., & Wise, M. W. 2001, ApJL, 558, L15
- Bondi (1952) Bondi, H. 1952, MNRAS, 112, 195
- Borgani et al. (2005) Borgani, S., Finoguenov, A., Kay, S. T., Ponman, T. J., Springel, V., Tozzi, P., & Voit, G. M. 2005, MNRAS, 361, 233
- Borgani et al. (2004) Borgani, S., et al. 2004, MNRAS, 348, 1078
- Bower (1997) Bower, R. G. 1997, MNRAS, 288, 355
- Brighenti & Mathews (2006) Brighenti, F., & Mathews, W. G. 2006, ApJ, 643, 120
- Brüggen et al. (2007) Brüggen, M., Heinz, S., Roediger, E., Ruszkowski, M., & Simionescu, A. 2007, MNRAS, 380, L67
- Brüggen & Kaiser (2002) Brüggen, M., & Kaiser, C. R. 2002, Nature, 418, 301
- Bryan & Voit (2001) Bryan, G. L., & Voit, G. M. 2001, ApJ, 556, 590
- Cattaneo & Teyssier (2007) Cattaneo, A., & Teyssier, R. 2007, MNRAS, 376, 1547
- Chen et al. (2007) Chen, Y., Reiprich, T. H., Böhringer, H., Ikebe, Y., & Zhang, Y.-Y. 2007, A&A, 466, 805
- Churazov et al. (2001) Churazov, E., Brüggen, M., Kaiser, C. R., Böhringer, H., & Forman, W. 2001, ApJ, 554, 261
- Churazov et al. (2002) Churazov, E., Sunyaev, R., Forman, W., Böhringer, H. 2002, MNRAS, 332, 729
- Cohn & White (2005) Cohn, J. D., & White, M. 2005, Astroparticle Physics, 24, 316
- Cowie & Binney (1977) Cowie, L. L., & Binney, J. 1977, ApJ, 215, 723
- Crain et al. (2007) Crain, R. A., Eke, V. R., Frenk, C. S., Jenkins, A., McCarthy, I. G., Navarro, J. F., & Pearce, F. R. 2007, MNRAS, 377, 41
- Dalla Vecchia et al. (2004) Dalla Vecchia, C., Bower, R. G., Theuns, T., Balogh, M. L., Mazzotta, P., & Frenk, C. S. 2004, MNRAS, 355, 995
- David et al. (2001) David, L. P., Nulsen, P. E. J., McNamara, B. R., Forman, W., Jones, C., Ponman, T., Robertson, B., & Wise, M. 2001, ApJ, 557, 546
- De Grandi et al. (2004) De Grandi, S., Ettori, S., Longhetti, M., & Molendi, S. 2004, A&A, 419, 7
- Donahue et al. (2006) Donahue, M., Horner, D. J., Cavagnolo, K. W., & Voit, G. M. 2006, ApJ, 643, 730 (D06)
- Dunn & Fabian (2006) Dunn, R. J. H., & Fabian, A. C. 2006, MNRAS, 373, 959
- Dunn et al. (2005) Dunn, R. J. H., Fabian, A. C., & Taylor, G. B. 2005, MNRAS, 364, 1343
- Edge & Frayer (2003) Edge, A. C., & Frayer, D. T. 2003, ApJL, 594, L13
- Edge et al. (1990) Edge, A. C., Stewart, G. C., Fabian, A. C., & Arnaud, K. A. 1990, MNRAS, 245, 559
- Edge et al. (2002) Edge, A. C., Wilman, R. J., Johnstone, R. M., Crawford, C. S., Fabian, A. C., & Allen, S. W. 2002, MNRAS, 337, 49
- Egami et al. (2006) Egami, E., et al. 2006, ApJ, 647, 922
- Eke et al. (2001) Eke, V. R., Navarro, J. F., & Steinmetz, M. 2001, ApJ, 554, 114
- Evrard & Henry (1991) Evrard, A. E., & Henry, J. P. 1991, ApJ, 383, 95
- Evrard et al. (1996) Evrard, A. E., Metzler, C. A., & Navarro, J. F. 1996, ApJ, 469, 494
- Fabian & Nulsen (1977) Fabian, A. C., & Nulsen, P. E. J. 1977, MNRAS, 180, 479
- Fabian et al. (1984) Fabian, A. C., Nulsen, P. E. J., & Canizares, C. R. 1984, Nature, 310, 733
- Fabian et al. (2000) Fabian, A. C., et al. 2000, MNRAS, 318, L65
- Frenk et al. (1999) Frenk, C. S., et al. 1999, ApJ, 525, 554
- Gardini (2007) Gardini, A. 2007, A&A, 464, 143
- Hasinger et al. (2005) Hasinger, G., Miyaji, T., & Schmidt, M. 2005, A&A, 441, 417
- Hatch et al. (2006) Hatch, N. A., Crawford, C. S., Johnstone, R. M., & Fabian, A. C. 2006, MNRAS, 367, 433
- Heinz et al. (2006) Heinz S., Brüggen M., Young A., Levesque E., 2006, MNRAS, 373, L65
- Hoeft & Brüggen (2004) Hoeft, M., & Brüggen, M. 2004, ApJ, 617, 896
- Horner (2001) Horner, D. J. 2001, PhD Thesis, University of Maryland
- Johnstone et al. (1992) Johnstone, R. M., Fabian, A. C., Edge, A. C., & Thomas, P. A. 1992, MNRAS, 255, 431
- Kaastra & Mewe (1993) Kaastra, J. S., & Mewe, R. 1993, A&AS, 97, 443
- Kaastra et al. (2004) Kaastra, J. S., et al. 2004, A&A, 413, 415
- Kaiser & Binney (2003) Kaiser, C. R., & Binney, J. 2003, MNRAS, 338, 837
- Kaiser (1991) Kaiser, N. 1991, ApJ, 383, 104
- Kay et al. (2004) Kay, S. T., Thomas, P. A., Jenkins, A., & Pearce, F. R. 2004, MNRAS, 355, 1091
- Kim & Narayan (2003) Kim, W.-T., & Narayan, R. 2003, ApJ, 596, 889
- Kravtsov et al. (2005) Kravtsov, A. V., Nagai, D., & Vikhlinin, A. A. 2005, ApJ, 625, 588
- Lewis et al. (2000) Lewis, G. F., Babul, A., Katz, N., Quinn, T., Hernquist, L., & Weinberg, D. H. 2000, ApJ, 536, 623
- Liedahl et al. (1995) Liedahl, D. A., Osterheld, A. L., & Goldstein, W. H. 1995, ApJL, 438, L115
- Lin et al. (2006) Lin, W. P., Jing, Y. P., Mao, S., Gao, L., & McCarthy, I. G. 2006, ApJ, 651, 636
- Lin et al. (2003) Lin, Y.-T., Mohr, J. J., & Stanford, S. A. 2003, ApJ, 591, 749
- Loeb (2002) Loeb, A. 2002, New Astronomy, 7, 279
- Lu & Mo (2007) Lu, Y., & Mo, H. J. 2007, MNRAS, 377, 617
- Malyshkin & Kulsrud (2001) Malyshkin, L., & Kulsrud, R. 2001, ApJ, 549, 402
- Markevitch (1998) Markevitch, M. 1998, ApJ, 504, 27
- Markevitch et al. (2003) Markevitch, M., et al. 2003, ApJL, 586, L19
- Mathews et al. (2004) Mathews, W. G., Brighenti, F., & Buote, D. A. 2004, ApJ, 615, 662
- Mathews et al. (2003) Mathews, W. G., Brighenti, F., Buote, D. A., & Lewis, A. D. 2003, ApJ, 596, 159
- Mazzotta et al. (2004) Mazzotta, P., Rasia, E., Moscardini, L., & Tormen, G. 2004, MNRAS, 354, 10
- McCarthy et al. (2002) McCarthy, I. G., Babul, A., & Balogh, M. L. 2002, ApJ, 573, 515
- McCarthy et al. (2004) McCarthy, I. G., Balogh, M. L., Babul, A., Poole, G. B., & Horner, D. J. 2004, ApJ, 613, 811 (M04)
- McCarthy et al. (2007b) McCarthy, I. G., Bower, R. G., & Balogh, M. L. 2007, MNRAS, 377, 1457
- McCarthy et al. (2007a) McCarthy, I. G., et al. 2007, MNRAS, 376, 497
- McCarthy et al. (2003) McCarthy, I. G., Holder, G. P., Babul, A., & Balogh, M. L. 2003, ApJ, 591,526
- McNamara & Nulsen (2007) McNamara, B. R., & Nulsen, P. E. J. 2007, ARA&A, 45, 117
- McNamara et al. (2005) McNamara, B. R., Nulsen, P. E. J., Wise, M. W., Rafferty, D. A., Carilli, C., Sarazin, C. L., & Blanton, E. L. 2005, Nature, 433, 45
- Mewe et al. (1985) Mewe, R., Gronenschild, E. H. B. M., & van den Oord, G. H. J. 1985, A&AS, 62, 197
- Mohr et al. (1999) Mohr, J. J., Mathiesen, B., & Evrard, A. E. 1999, ApJ, 517, 627
- Motl et al. (2004) Motl, P. M., Burns, J. O., Loken, C., Norman, M. L., & Bryan, G. 2004, ApJ, 606, 635
- Nagai et al. (2007) Nagai, D., Vikhlinin, A., & Kravtsov, A. V. 2007, ApJ, 655, 98
- Narayan & Medvedev (2001) Narayan, R., & Medvedev, M. V. 2001, ApJL, 562, L129
- Navarro et al. (1997) Navarro, J. F., Frenk, C. S., & White, S. D. M. 1997, ApJ, 490, 493
- Nemmen et al. (2007) Nemmen, R. S., Bower, R. G., Babul, A., & Storchi-Bergmann, T. 2007, MNRAS, 377, 1652
- Neto et al. (2007) Neto, A. F., et al. 2007, MNRAS, 381, 1450
- Neumann & Arnaud (1999) Neumann, D. M., & Arnaud, M. 1999, A&A, 348, 711
- Nulsen (1986) Nulsen, P. E. J. 1986, MNRAS, 221, 377
- Nulsen et al. (2005) Nulsen, P. E. J., Hambrick, D. C., McNamara, B. R., Rafferty, D., Bîrzan, L., Wise, M. W., & David, L. P. 2005, ApJL, 625, L9
- Nusser et al. (2006) Nusser, A., Silk, J., & Babul, A. 2006, MNRAS, 373, 739
- Oh & Benson (2003) Oh, S. P., & Benson, A. J. 2003, MNRAS, 342, 664
- O’Hara et al. (2006) O’Hara, T. B., Mohr, J. J., Bialek, J. J., & Evrard, A. E. 2006, ApJ, 639, 64
- Omma & Binney (2004) Omma, H., & Binney, J. 2004, MNRAS, 350, L13
- Omma et al. (2004) Omma, H., Binney, J., Bryan, G., & Slyz, A. 2004, MNRAS, 348, 1105
- Ostriker et al. (2005) Ostriker, J. P., Bode, P., & Babul, A. 2005, ApJ, 634, 964
- Pavlovski et al. (2007) Pavlovski, G., Kaiser, C. R., Pope, E. C. D., & Fangohr, H. 2007, ArXiv e-prints, 709, arXiv:0709.1790
- Pen (1999) Pen, U.-L. 1999, ApJL, 510, L1
- Peres et al. (1998) Peres, C. B., Fabian, A. C., Edge, A. C., Allen, S. W., Johnstone, R. M., & White, D. A. 1998, MNRAS, 298, 416
- Peterson & Fabian (2006) Peterson, J. R., & Fabian, A. C. 2006, Physics Reports, 427, 1
- Peterson et al. (2001) Peterson, J. R., et al. 2001, A&A, 365, L104
- Peterson et al. (2003) Peterson, J. R., Kahn, S. M., Paerels, F. B. S., Kaastra, J. S., Tamura, T., Bleeker, J. A. M., Ferrigno, C., & Jernigan, J. G. 2003, ApJ, 590, 207
- Pointecouteau et al. (2005) Pointecouteau, E., Arnaud, M., & Pratt, G. W. 2005, A&A, 435, 1
- Ponman et al. (1999) Ponman, T. J., Cannon, D. B., & Navarro, J. F. 1999, Nature, 397, 135
- Poole et al. (2006) Poole, G. B., Fardal, M. A., Babul, A., McCarthy, I. G., Quinn, T., & Wadsley, J. 2006, MNRAS, 373, 881
- Poole et al. (2007) Poole, G. B., Babul, A., McCarthy, I. G., Fardal, M. A., Bildfell, C. J., Quinn, T., & Mahdavi, A. 2007, MNRAS, 380, 437
- Pope et al. (2006) Pope, E. C. D., Pavlovski, G., Kaiser, C. R., & Fangohr, H. 2006, MNRAS, 367, 1121
- Pratt et al. (2006) Pratt, G. W., Arnaud, M., & Pointecouteau, E. 2006, A&A, 446, 429 (P06)
- Pratt et al. (2007) Pratt, G. W., Böhringer, H., Croston, J. H., Arnaud, M., Borgani, S., Finoguenov, A., & Temple, R. F. 2007, A&A, 461, 71
- Quilis et al. (2001) Quilis, V., Bower, R. G., & Balogh, M. L. 2001, MNRAS, 328, 1091
- Rasia et al. (2005) Rasia, E., Mazzotta, P., Borgani, S., Moscardini, L., Dolag, K., Tormen, G., Diaferio, A., & Murante, G. 2005, ApJL, 618, L1
- Raymond & Smith (1977) Raymond, J. C., & Smith, B. W. 1977, ApJS, 35, 419
- Robinson et al. (2004) Robinson, K., et al. 2004, ApJ, 601, 621
- Roncarelli et al. (2006) Roncarelli, M., Moscardini, L., Tozzi, P., Borgani, S., Cheng, L. M., Diaferio, A., Dolag, K., & Murante, G. 2006, MNRAS, 368, 74
- Roychowdhury et al. (2004) Roychowdhury, S., Ruszkowski, M., Nath, B. B., & Begelman, M. C. 2004, ApJ, 615, 681
- Ruszkowski et al. (2004) Ruszkowski, M., Brüggen, M., & Begelman, M. C. 2004, ApJ, 615, 675
- Ruszkowski et al. (2007) Ruszkowski, M., Enßlin, T. A., Brüggen, M., Heinz, S., & Pfrommer, C. 2007, MNRAS, 378, 662
- Sanderson et al. (2006) Sanderson, A. J. R., Ponman, T. J., & O’Sullivan, E. 2006, MNRAS, 372, 1496
- Santos et al. (2008) Santos, J. S., Rosati, P., Tozzi, P., Boehringer, H., Ettori, S., & Bignamini, A. 2008, ArXiv e-prints, 802, arXiv:0802.1445
- Schmidt & Green (1983) Schmidt, M., & Green, R. F. 1983, ApJ, 269, 352
- Simionescu et al. (2007) Simionescu, A., Werner, N., Finoguenov, A., Boehringer, H., & Brueggen, M. 2007, ArXiv e-prints, 709, arXiv:0709.4499
- Soker & Pizzolato (2005) Soker, N., & Pizzolato, F. 2005, ApJ, 622, 847
- Spitzer Härm (1953) Spitzer, L., Harm, R. 1953, Physical Review , 89, 977
- Springel et al. (2005) Springel, V., et al. 2005, Nature, 435, 629
- Sternberg et al. (2007) Sternberg, A., Pizzolato, F., & Soker, N. 2007, ApJL, 656, L5
- Tozzi & Norman (2001) Tozzi, P., & Norman, C. 2001, ApJ, 546, 63
- Tozzi et al. (2000) Tozzi, P., Scharf, C., & Norman, C. 2000, ApJ, 542, 106
- Vernaleo & Reynolds (2006) Vernaleo, J. C., & Reynolds, C. S. 2006, ApJ, 645, 83
- Vikhlinin et al. (2007) Vikhlinin, A., Burenin, R., Forman, W. R., Jones, C., Hornstrup, A., Murray, S. S., & Quintana, H. 2007, Heating versus Cooling in Galaxies and Clusters of Galaxies, 48 (arXiv:astro-ph/0611438)
- Vikhlinin et al. (2006) Vikhlinin, A., Kravtsov, A., Forman, W., Jones, C., Markevitch, M., Murray, S. S., & Van Speybroeck, L. 2006, ApJ, 640, 691 (V06)
- Vikhlinin et al. (2005) Vikhlinin, A., Markevitch, M., Murray, S. S., Jones, C., Forman, W., & Van Speybroeck, L. 2005, ApJ, 628, 655
- Voigt & Fabian (2004) Voigt, L. M., & Fabian, A. C. 2004, MNRAS, 347, 1130
- Voit (2005) Voit, G. M. 2005, Reviews of Modern Physics, 77, 207
- Voit & Donahue (2005) Voit, G. M., & Donahue, M. 2005, ApJ, 634, 955
- Voit et al. (2002) Voit, G. M., Bryan, G. L., Balogh, M. L., & Bower, R. G. 2002, ApJ, 576, 601
- Voit et al. (2003) Voit, G. M., Balogh, M. L., Bower, R. G., Lacey, C. G., & Bryan, G. L. 2003, ApJ, 593, 272
- Voit et al. (2005) Voit, G. M., Kay, S. T., & Bryan, G. L. 2005, MNRAS, 364, 909
- Younger & Bryan (2007) Younger, J. D., & Bryan, G. L. 2007, ApJ, 666, 647
- Zakamska & Narayan (2003) Zakamska, N. L., & Narayan, R. 2003, ApJ, 582, 162
Appendix A: ACCURACY OF THE PURE COOLING MODEL
The key approximations are:
I. Quasi-hydrostatic equilibrium. At all times
the ICM is assumed to be in HSE within the potential
well of the cluster. This assumption is motivated by the
results of
cosmological simulations (e.g., Evrard et al. 1996; Lewis et
al. 2000; Kravtsov et al. 2005; Rasia et al. 2005). While
such simulations do show
deviations from HSE (e.g., due to merger events), they are
typically only at the level of 10%. This result is re-enforced
by high resolution simulations of idealised cluster mergers
(e.g., Poole et al. 2006). Depending on the depth of
the potential well and the properties of the ICM,
quasi-HSE can also potentially be violated in the central
regions by simple inflow from loss of pressure support due to
radiative cooling. However, for the massive systems of interest
here, we verify that, at all radii greater than a few kpc,
exceeds the local free-fall time and,
therefore, the ICM can be considered to be in quasi-HSE.
II. Static gravitational potential. We assume the
cluster gravitational potential does not evolve with time. This
will be violated if the cluster grows significantly via mergers
and accretion or if large quantities of baryons are able to
completely cool and subsequently settle at the cluster centre.
With regards to the former, cosmological simulations indicate
that most of the mass of a typical rich cluster has been in
place since (e.g., Cohn & White 2005). Thus, for a
concordance cosmology the typical age of a cluster corresponds
to gigayears, which exceeds its dynamical time
by a factor of a few, implying the equilibrium assumption is
justified. As for the latter, if a significant fraction of
the baryons are able to cool and collect at the cluster centre,
this can significantly deepen the gravitational potential there
(see, e.g., Lewis et al. 2000). However, it is now well known
that large quantities of cold baryons are not piling up in
the centres of clusters (e.g., Balogh et al. 2001; Peterson et
al. 2003). The implication is that some form of
non-gravitational heating is offsetting radiative cooling. We
therefore neglect the effects of cold gas and stars on the
gravitational potential, assuming by default that some source of
non-gravitational heating (significantly moderates or even wins
over radiative cooling) is initiated shortly following the onset
of catastrophic cooling.
III. Spherical symmetry. Our theoretical
clusters are spherically symmetric. With suitable redefinition
of the coordinate system, the model can also be applied to
ellipsoidal systems. Of course, real systems deviate from such
strict symmetry. One can minimise this bias by comparing to
large samples of clusters, as we do in §3, so that any
asymmetries present are averaged out. This bias can be
minimised further by selecting observed systems that appear
visually relaxed (see, e.g., Poole et al. 2006). The cluster
samples studied in §3, particularly in §3.1, have largely
been constructed so that the clusters meet some isophotal
regularity criterion.
IV. Single-phase cooling. Our models
assume that at each radius the properties of the gas can be
characterised by a unique entropy, density, temperature, etc.
Consequently, if the ICM is actually a multi-phase medium a
comparison of these models to the observational data could lead
to spurious conclusions. Over the past few decades there has
been debate about the role of multi-phase cooling in clusters.
We examine this issue in more detail in Appendix B and
demonstrate that the observational evidence usually put forward
in support of multi-phase cooling is actually fully consistent
with our single-phase models. We argue further that the current
suite of multi-wavelength cluster observations strongly favours
single-phase cooling for the vast bulk of the gas in massive
clusters.
Finally, we have tested the numerical accuracy of our
cooling algorithm against the analytic cooling wave similarity
solutions of Bertschinger (1989) and find excellent accordance.
Appendix B: SINGLE- VS. MULTI-PHASE COOLING
There has been debate over the role of multi-phase cooling in the ICM for a couple of decades now. It is beyond the scope of this paper to summarise in detail all of the many facets of this discussion. For ease of discussion, therefore, we summarise just the main arguments usually put forward in support of a multi-phase ICM and comment on them in the context of our single-phase models.
There are three main arguments that have traditionally been used in support of a multi-phase ICM: (1) multi-temperature plasma models give better fits to the observed X-ray spectra of cool core clusters; (2) the observed X-ray surface brightness/ICM gas density profiles are too steep compared with a single-phase cooling model; and (3) the ICM is thermally unstable. The first two arguments are observational in nature while the last one is theoretical. We address each of these arguments in order.
Multi-temperature plasma models have been demonstrated to yield statistically better fits than single-temperature models to the X-ray spectra of cool core systems (e.g., Allen 2000), even when the spectra are properly deprojected (Kaastra et al. 2004). But clearly an important consideration is the width of the annulus from which the X-ray spectra are extracted. If the width is larger than the typical scale over which the temperature profile changes appreciably, one should expect a multi-phase model to fit the spectrum better than a single-phase model even if the gas is single phase at all radii within that annulus. Normally it is the width of the PSF X-ray instrument that dictates the minimum width one will select for each annulus. For example, ASCA has a broad PSF with a FWHM of arcminutes, which corresponds to a physical size of kpc for a cluster at . This is comparable or slightly larger than the cooling radius of a typical cool core system, so it is not surprising that multi-temperature plasma models fit ASCA spectra better than single-temperature models. The Chandra X-ray Observatory, with its good spectral resolution, wide passband, and, importantly, its high spatial resolution ( arcsecond) should place the best constraints on whether the ICM is actually multi-phase. Numerous recent studies (e.g., David et al. 2001; V06; D06) have demonstrated that, probably with the exception of the innermost radial bin, the spatially-resolved Chandra spectra of cool core clusters are fit well by single-temperature models. Multi-temperature models also fit the data well, but the improvement over the single-temperature models is not statistically significant. Therefore, with the exception of the innermost radial bin (which for nearby systems typically corresponds to a physical size of a few up to 10 kpc or so), there is no longer strong spectral evidence for multi-phase cooling in cool core clusters. Whether or not the gas at very small radii is cooling in a multi-phase fashion will require even higher resolution observations that can rule out the possibility that the spectra can be simply explained with a single-phase plasma characterised by a steep temperature gradient.
The observed surface brightness/gas density profiles of cool core clusters also potentially yield important clues about the nature of cooling of the ICM. Several studies (e.g., Nulsen 1986; Johnstone et al. 1992; Peterson & Fabian 2006) have argued that the observed profiles are not steep enough to be explained by a single-phase cooling model. The plots in §3.1.3 confirm this is true when a comparison is made between the pure cooling model101010We note that our pure cooling model is the configuration of the ICM at the onset of catastrophic cooling. If one instead evolved this model further until a steady-state cooling flow developed, as assumed by Nulsen (1986), Johnstone et al. (1992), and Peterson & Fabian (2006), the resulting gas density profiles would be even more strongly peaked. and the observed profiles. This gas density problem is often recast in terms of a (so-called morphological) “mass deposition rate problem”. The argument is that single-phase models supposedly predict is constant with radius inside the cooling radius, whereas the observations typically show that integrated mass deposition rate scales nearly linearly with radius . Nulsen (1986) has shown that this kind of behaviour can be broadly accounted for by a model in which the ICM cools in an inhomogeneous multi-phase fashion. As such, the fact that observed cool core systems have relatively “shallow” surface brightness profiles is often taken as support for a multi-phase ICM. However, the above argument against a single-phase ICM is flawed because it neglects the effects of non-gravitational heating. As we have shown throughout the paper, a simple modification of the pure cooling entropy profile results in excellent simultaneous agreement with a wide variety data.
Finally, regarding thermal instability, in the absence of any sources of non-gravitational heating the ICM can easily be demonstrated to be thermally unstable by considering the generalised Field criterion (e.g., Balbus 1986). If the perturbations are initially small, the growth time is two-thirds the local isobaric cooling time (see Kim & Narayan 2003). However, in a quasi-hydrostatic cooling medium, the cooling time of the gas is always close to the inflow time (see, e.g., Bertschinger 1989). (We have verified this for our algorithm by tracking individual gas shells in our 1-D model as they flow from the cooling radius to the cluster centre.) Since the growth time of perturbations is only slightly faster than the cooling time, this implies the growth time and the inflow time are also comparable. So gas that is initially perturbed at some radius (say, the cooling radius) only becomes non-linear as it reaches the centre of cluster. Following this line of argument, B89 have estimated, for example, that a 10% density perturbation at the cooling radius in M87 would only become nonlinear at kpc. However, if the density perturbations are much larger than this (i.e., non-linear, or nearly so, to begin with), as in the models of Nulsen (1986), a multi-phase medium can potentially result.
Recent observational results suggest that any multi-phase cooling present in clusters is limited in scope. First, as noted in §3.1.5, XMM-Newton spectra indicate that very little gas is cooling below approximately one half the ambient ( virial) temperature. Assuming that the perturbations are in pressure equilibrium with the ambient ICM, this implies that the variation in density of the ICM at a fixed location is at most a factor of two. But in order to retain consistency with the fact that spatially-resolved Chandra spectra are fit well by single-temperature models, the variation in density will likely have to be much smaller than this. Furthermore, recent surveys for cold gas and dust in cool core clusters (e.g., Edge et al. 2002; Edge & Frayer 2003; Egami et al. 2006) generally indicate that, if present, they are typically confined to small radii ( kpc or so). The implication is that either the typical ICM density perturbation is quite small (which could account nicely for the limited spatial extent of cold gas and dust) or that some form of non-gravitational heating is counteracting the growth of perturbations (or that both are true). In any case, the above argues in favour of using single-phase models to study the vast bulk of the ICM in galaxy clusters.
APPENDIX C: ENERGETICS OF CLUSTER HEATING
At first sight it seems strange that the energy required to modify the gas distribution in a cluster should depend on whether the energy is injected before or after cluster collapse. Below we outline the thermodynamics of the heating process and explain why greater energy is required after the collapse of the cluster.
We should not be surprised that the two heating scheme require different energies to achieve the same change in gas entropy. This is what powers your car. Consider two isolated parcels of gas. We will heat one, keeping its density (and hence volume) fixed. We will adiabatically compress the other, and then heat it at constant density such that the two parcels of gas have the same entropy. We then let this second parcel expand back to its initial density. The two parcels have the same initial and final states but require different heat inputs, as we will show below. Since the entropy is conserved during the expansion and compression, the entropy change of the two parcels is the same. However, since the entropy change is directly proportional to the (logarithm of the) change in thermal energy divided by its density to the two-thirds power, it is immediately apparent that the amount of energy that must be thermalised in the gas to raise its entropy by some specified amount depends on the density of the gas at the time of heating and that it is different for the two parcels. In particular, the higher the gas density the more energy that is required to reach the desired entropic state. Applying this simple rationale to galaxy clusters (as done, e.g, by Ponman et al. 1999; Balogh et al. 1999; Tozzi et al. 2000; Tozzi & Norman 2001), one concludes that in order to achieve the same ICM state (e.g., the observed state at ), it is energetically more efficient to heat the ICM at high redshift prior to collapse (i.e., “preheat”), when its mean density was lower, than it is to heat it today after the cluster has fully collapsed and virialised.
An obvious question is “what happens to the extra energy?”. In the case of an isolated parcel of gas, the additional heat energy is balanced by the work required to compress the system and then bring it back to the initial density. The heat input is given by
where is the volume of the gas when the heat input occurs, and are the initial and final adiabats of the gas.
Demonstrating that the simple rationale of the isolated gas parcel applies in detail to the case of galaxy clusters where the gas is gravitationally bound to a massive (evolving) dark matter potential is slightly more involved but is still tractable. As we show below, the difference in the energies between the preheating and internal heating cases corresponds to the work that must be done by the gas (in the internal heating case) against the gravitational potential and on the external medium as it expands to the same final configuration. To demonstrate this, we make an explicit comparison of the required internal and pre-heating energetics for a cluster with a final entropy profile that is given by the addition of a keV cm2 pedestal to the pure cooling profile.
Let us first consider the case where the heating takes place after the cluster has collapsed (i.e., internal heating). Key to a good estimate of the energetics for this form of heating is an accurate estimation of the surface bounding pressure term (as noted in §2, the properties of the ICM are set by its entropy distribution, the depth of its dark matter potential well, and the bounding pressure at the virial radius). The bounding surface pressure term is estimated as follows. We place the pure cooling entropy profile in HSE within a NFW dark matter potential. The bounding surface pressure is whatever it needs to be so that the total mass of gas within matches that in the simulations (see eqn. 6). In the case of a typical cluster, we find the bounding pressure is ergs/cm3 at . (A virtually identical result is obtained if one instead uses the baseline gravitational entropy profile.)
In order to heat the gas to the desired state, internal energy must be added to the system. We find that the total energy required to modify the Lagrangian entropy distribution of the pure cooling model so that it matches the desired final Lagrangian entropy distribution of the keV cm2 pedestal model is ergs. Heating the gas causes it to expand, so that the gas mass within of the final system is only about 70% of what it was before heating (this number is sensitive to the bounding surface pressure, which is why we required an accurate estimate of this quantity). So the estimate of the energy required to heat the gas given above is only for the gas that remains within of the final system.
As the gas expands, much of the internal energy added to the system will be used to do work against the dark matter-dominated gravitational potential of the cluster (i.e., as the gas expands, work is required to lift gas sitting at larger radii). We calculate the work done as follows. For each gas mass shell, we calculate the volume occupied by the shell before, , and following, , the heating (where and are the initial and final thicknesses of the shell). The net work done by a shell against the potential is just the integral of over the interval to . The initial pressure, , is the pressure of the shell at the instant it has been heated (but before expansion), while is the pressure of the shell in the final (hydrostatic) configuration. The expansion of the shell in going from to is adiabatic, such that . Summing up the work done by all of the shells yields the total work done against the potential. For the specific example, we find that heat input required is . As the gas expands and rises in the potential, the total work done during expansion is . The majority of this energy goes into lifting the gas in the gravitational potential () while the remaining energy goes into work done at the outer boundary (lifting the exterior gas in the potential). The change in the internal of the system is much smaller than the above quantities, only . All these quantities refer to the gas that remains within . Thus we find that 99.9% of the energy added to the system goes into work done against the potential, while the remaining energy stays in the form of internal energy.
Let us now consider the preheating case. To a good approximation, the addition of a pedestal of keV cm2 to the pure cooling model can be achieved by uniformly preheating the proto-ICM to this level (see, e.g., Balogh et al. 1999; Voit et al. 2003; Lu & Mo 2007; Younger & Bryan 2007). As the density of the proto-ICM is much lower than the density typical of a collapsed cluster, the required amount of energy that must be added in the preheating case (see eqn. 11) is much lower than in the internal heating case. For example, if we heat the gas when it has a mean density corresponding to , the energy required is . Note that while some of this energy will be converted into work done in the expansion of the gas, this energy will eventually be retrieved when the system turns around and collapses (i.e., infall kinetic energy of the shells will be converted back into internal energy via shock heating).
To complete our energy budget, we need to consider the energy that is thermalised during the system collapse. Without pre-heating, the system collapses to a denser, more bound configuration: yet we have seen that the internal energies of the two systems (measured within the Lagrangian region) are quite similar. While this is puzzling at first sight, the key difference is that initially the gas collapses along with the dark matter into a steepening gravitational potential, while when it is heated the potential is fixed. During collapse, the gas is shock heated and then compressed as the rest of the cluster collapses around it (for a detailed discussion, see Bertschinger 1989, Abadi et al. 2000, Voit et al. 2003). To reverse the collapse and reach the desired final state, we must heat the gas, puffing it out by doing work against a fixed (and deep) dark matter potential. A detailed calculation of the shock heating and work during collapse is beyond the scope of this appendix, but we can estimate an upper limit to the amplitude of this correction by assuming that the gas is compressed along a fixed adiabat. This corresponds to the case we presented in the initial discussion of compression in a gas cylinder, and amounts to ignoring the growth of the potential with time and the role of shocks in heating the gas. We are also ignoring the greater efficiency of shocks and work in the collapse of the preheated gas. Following this methodology sets an upper limit on the work done on the gas during the collapse of 30% of that done by the gas during expansion. Thus (if the argument based on entropy is set aside) our comparison of the preheating and in-situ heating energies could be modified by up to 30% to account for the work done in the collapse. Nevertheless, the central result is still clear: “preheating” is approximately two orders of magnitude more efficient than heating the gas halo once it has formed.
Finally, we stress that while we concluded in §4.1 that radiative cooling losses were not very important in the internal heating case after the heating had taken place, the amount of energy that must be radiated in going from the baseline gravitational model to the pure cooling model (in order to trigger the central black hole into action) is ergs. This alone is approximately an order of magnitude more energy than is required to preheat the gas.
APPENDIX D: THE ROLE OF THERMAL CONDUCTION
The idea that thermal conduction could be important in offsetting radiative losses in CC clusters has been revived in recent years. This is largely due to recent theoretical work (e.g., Malyshkin & Kulsrud 2001; Narayan & Medvedev 2001) that suggests that the magnetic fields present in clusters may not suppress conduction as much as previously thought. If the magnetic field lines are chaotically tangled, the effective conductivity, , could be as high as 0.3 times the unmagnetised Spitzer rate (). As demonstrated by several different groups (e.g., Narayan & Medvedev 2001; Zakamska & Narayan 2003; Voigt & Fabian 2004; Hoeft & Brüggen 2004), such minor suppression could allow conduction to balance radiative losses in the central regions of some, but not all, CC clusters. (Although to balance radiative losses in detail seems to require that the suppression coefficient vary somewhat strongly as a function of radius, changing by up to factors of several within ; see Pope et al. 2006.) But whether or not is actually of order 0.3 is still not known. Observations of sharp temperature discontinuities in many clusters provide some evidence that the suppression coefficient is actually much smaller than this (e.g., Markevitch et al. 2003). Furthermore, theoretical work by Loeb (2002) suggests that if thermal conduction was not heavily suppressed, this would result in a significant fraction of the thermal energy of the ICM being transported out of the cluster interior and into the surrounding intergalactic medium. The net result is that clusters would be much cooler than we observe them to be.
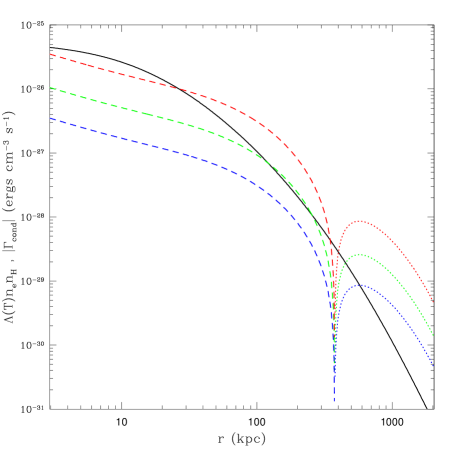
We leave these issues aside and simply ask how conduction characterised by a rate of would change our results or conclusions. As noted above, conduction at this level is a non-negligible source of energy transport. However, it has already been demonstrated (e.g., Zakamska & Narayan 2003; Voigt et al. 2004) that conduction at this level cannot by itself balance cooling in the most extreme cool core clusters or for moderate to low mass systems characterised by temperatures of keV or so (note that the conductivity scales steeply with temperature as ). Although nature may not be so kind, we seek a single heating model to explain the properties of all clusters. With this as our goal, we are interested in whether thermal conduction (with ) plus AGN “wood stove” heating can yield a satisfactory replacement to the preheating plus AGN heating model explored in §5.2. For this to be the case, conduction must raise the adiabat of the gas at intermediate radii in the same fashion that preheating would.
In Fig. 13, we plot the radiative cooling and thermal conduction heating/cooling rates (per unit volume) for a typical cluster set up according to the baseline gravitational model (§2.1). The thermal conduction rate, , is defined as:
| (12) |
where
| (13) |
and and is defined in Spitzer & Harm (1953).
At very small radii, thermal conduction with cannot balance radiative losses, as expected. However, this can plausibly be taken care of by AGN heating. Of more interest is the conductive heating rate at intermediate radii. Interestingly, over the range 60 kpc 200 kpc (roughly), thermal conduction with can balance or even win over radiative losses. This implies the entropy of the gas at these radii will be elevated by conduction, as required. Naively, therefore, this suggests that thermal conduction and AGN central heating in tandem has the correct behaviour to explain the observed structure of CC clusters.
However, there are at least two problems with this scenario. First, at large radii ( kpc or so) it is apparent that conduction substantially increases the cooling rate of the gas. The reason for this behaviour is that there is a negative temperature gradient at large radii (this is a robust prediction of cosmological simulations that has been confirmed by observations) and, therefore, conduction acts to transfer energy down the gradient (see also Hoeft & Brüggen 2004). We have investigated the seriousness of this effect by including conduction in our time-dependent 1-D algorithm. Over the course of a Hubble time, we find that at large radii ( kpc) conduction reduces the normalisation of the ICM entropy profile by at least . This is sufficient to yield serious tension with the amplitude of the observed profiles at large radii. However, this issue could be mitigated to some degree by appealing to the fact that conduction has likely only been energetically important since the cluster obtained the bulk of its mass ( or so).
Secondly, thermal conduction by itself or combined with AGN “wood stove” heating has no hope of explaining NCC clusters. These systems seem to require large entropy cores ranging anywhere from 100 keV cm2 to 700 keV cm2 (see Fig. 7). However, we find that if conduction is extremely efficient (), such that it wins over radiative cooling at small radii, the largest entropy core it can produce is 100 keV cm2 for a cluster (see also Hoeft & Brüggen 2004). It cannot produce cores larger than this since this would require a negative temperature gradient at small radii. The tendency of conduction, on the other hand, is to transfer heat to the central regions in order to establish an isothermal core. Once an isothermal core is established the conductive heating rate drops to zero.
One of our main goals in this paper is to see if there is single heating model that can plausibly account for the observed properties of the whole cluster population (i.e., both CC and NCC systems). This does not appear to be possible with thermal conduction or thermal conduction plus AGN central heating. One needs to invoke some additional form of heating to rectify the issues mentioned above. The preheating plus AGN central heating model presented in §5.2, however, seems capable of matching the properties of the observed systems and physically is more simple. For this reason, it is our preferred model.
APPENDIX E: Other challenges for the “wood stove” model
E.1 The effect on metallicity gradients
An important consideration for the preheated AGN “wood stove” model is that of observed metallicity gradients in CC clusters. It has been argued that the convective outflows that result from strong central heating would rapidly destroy the gradients. However, the metallicity peaks in CC clusters are typically quite wide, with kpc (e.g., De Grandi et al. 2004; we note that this still remains the case when one uses higher spatial resolution Chandra data; see Vikhlinin et al. 2005). This is roughly a factor of 3-7 larger than the typical effective radius of the central BCG. If the metals that make up the peak originated from the stellar component of the central BCG, then some mechanism is required to lift the metals to larger radii. Mathews et al. (2004) have shown that central heating and convective outflows can provide the necessary transport mechanism to explain the width of the observed gradients. We perform a slightly different test using our model. In particular, just prior to the “wood stove” switching on we assume the metallicity distribution of our model clusters is identical to the average CC cluster profile observed by De Grandi et al. (see their Fig. 2). We then track the evolution of this profile after the AGN heating turns on. We find that for the range of central heating strengths explored above, the metallicity gradients does not evolve significantly for many () gigayears. The reason for this behaviour is two-fold. First, even though some material buoyantly rises to very large radii, a sizeable fraction of it remains within radii that are smaller than the width of the peak. So the peak is maintained to some degree by the feedback loop. Second, and more importantly, the width of the peak is comparable to the cooling radius. This means it will take nearly a Hubble time for all the metals to enter into the feedback loop just once. Furthermore, we have neglected additional metal injection due to stellar evolution of the central BCG and the effects of sedimentation. Therefore, in accordance with Mathews et al. , we find that the observed metallicity gradients are extremely robust to strong central heating and its associated convective outflows.
E.2 Comparison to observed X-ray bubbles
The “wood stove” heating model assumes that the ICM at small radii is reheated by some mechanism and then convects to larger radii perhaps in the form of “bubbles”, such as those commonly observed in CC clusters. In addition to the reheated ICM, the bubbles may also contain a relativistic component in the form of magnetic fields and/or relativistic particles. Analysis of radio data appears to confirm this is the case for several well-known sets of observed bubbles (e.g., Bîrzan et al. 2004; Dunn et al. 2005). In order for the preheating plus “wood stove” heating model to be successful, virtually all of the cooling ICM at small radii must be reheated and entrained within the rising bubbles, otherwise cool gas will rapidly pile up at the cluster centre, violating observational constraints. Therefore, there is an upper limit to the fraction of bubble material that can reside in a relativistic component and still retain consistency with the (reheated ICM) mass transfer rate required for the “wood stove” heating model to be successful. It is therefore interesting to calculate whether the observed bubble sizes, duty cycles, and relativistic content are consistent with the proposed model.
We have tested the above as follows. In our preheating + AGN “wood stove” model, the central mass inflow rate is yr-1 for several gigayears following AGN ignition. This is the rate at which material must be recycled in the rising bubbles. The mass of each bubble is set by selecting a bubble duty cycle, ; i.e., . The density of the reheated ICM inside the bubbles can then be calculated if the bubble size is known; i.e., assuming spherical symmetry, . The pressure of the (non-relativistic) reheated ICM can be calculated as , if the entropy of the reheated ICM, , is known. In addition to reheated ICM, we assume the rising bubbles contain a relativistic component with pressure . Assuming the bubble is in pressure equilibrium with the ambient ICM, we therefore have . The relativistic content of the bubble, , is therefore fixed when appropriate choices for , , and are made.
The bubble duty cycle, , of observed clusters is difficult to pin down exactly (e.g., Bîrzan et al. 2004), but it can be said with some certainty that it typically exceeds yr, since most CC clusters with bubbles contain only a single set of (visible) bubbles and have inferred ages of roughly this long (e.g., Dunn et al. 2005). If AGN bubble heating is triggered at the onset of catastrophic cooling, then we should expect to be of order years. In addition, observed bubbles typically have radii ranging from 5 kpc kpc (Bîrzan et al. 2004). Unfortunately, there are currently no strong constraints on the properties of the reheated ICM contained within bubbles (if, in fact, bubbles contain reheated ICM). In order for the bubbles to appear as surface brightness depressions in Chandra X-ray images, though, the reheated material must be fairly hot ( keV). Assuming a duty cycle of yrs and a bubble radius of 10 kpc, the reheated ICM must therefore have an entropy, , greater than about 200 keV cm2. As we demonstrated above (in Fig. 12), convective outflows driven by this level of heating yield an excellent fit to the observed entropy profiles of CC clusters for a fairly broad range of preheating levels. If the entropy of the reheated material is assumed to be at this minimum level of keV cm2, we find the relativistic component contributes of the total bubble pressure. Increasing the entropy of the reheated ICM has the effect of lowering . For example, we find the entropy of the reheated material cannot exceed much beyond keV cm2, otherwise the model requires . However, it should be noted that our quoted results are specific to the kpc case. Adopting a larger bubble radius, say of 20 kpc, will lead to a more important contribution from the relativistic component.
Clearly better constraints on the properties of the reheated ICM and the sizes of bubbles are needed to pin down (or vice-versa). However, the above demonstrates that the proposed model is at the very least consistent with the the presence of relativistic material in some bubbles. This is encouraging since it certainly did not have to be the case.
E.3 Energetics and distributed heating
In the simple heating model explored in §5, all of the (post-preheating) energy is assumed to be deposited near the centre of the cluster. This raises the entropy of the gas there and it begins to rise buoyantly, perhaps in the form similar to observed bubbles111111Note the transported material could, in addition to reheated ICM, be composed of entrained cooler material which is also deposited at large radii and mixed with the ICM there.. However, conventional wisdom is that energy must be deposited at all radii to offset cooling and the heating process must be relatively gentle. This raises several important questions about the energetics of the preheating + AGN “wood stove” model. For example: How much energy does the model require in order to stave off catastrophic cooling at the cluster centre? Will injecting this energy cause large entropy inversions in the ICM? How can heating just the central regions solve the long term problem that all of the gas within the cooling radius will cool significantly over the lifetime of the cluster? What about distributed heating? Let us now consider these questions in order.
In the preheating + “wood stove” model, the central mass inflow rate (that is, after central heating is initiated) is typically yr-1 for a typical cluster. This is the minimum rate of mass that must be recycled in the flow. Adopting this rate and the central gas density of our model, we find the time-averaged rate of thermal energy injection, , is
where is the entropy of the reheated gas inside the bubble. The energy required to operate the central feedback loop is therefore typically lower than most other heating models (that distribute heat throughout the volume enclosed by the cooling radius) and is within reach of observed AGN power output.
Will introducing all of this energy at the centre cause an entropy inversion? This is an important constraint, since inversions in the ambient ICM are not typically observed in CC clusters. First, we note that the proposed model differs from most other heating models in that it assumes that the observed bubbles are made up of the heated material (instead of the bubbles being comprised entirely of relativistic material). So, in this sense, the observed bubbles are entropy inversions. Importantly, the reheated material must be hot enough such that the bubbles appear as X-ray surface brightness depressions that do not contribute much to the X-ray flux or the mean radial profiles derived for CC clusters (as observed). As noted above, this requires an entropy of about keV cm2 or higher. Whether or not material outside the bubble is heated significantly by the inflation of the bubble to cause an entropy inversion in the ambient ICM depends on how fast the bubble is inflated (i.e., super- or subsonically; see, e.g., Nusser et al. 2006). If the bubble is inflated gently, then no significant heating of the ambient ICM need occur during the inflation of the bubble. This would be consistent with the observed lack of strong shocks near most young bubbles (e.g., Fabian et al. 2000; Blanton et al. 2001).
How does the “wood stove” model avoid the long term cooling problem? It is clear that since neither preheating nor adiabatically rising bubbles are able to balance radiative cooling losses at larger radii (but still within ), the model we have proposed cannot avoid the long term cooling problem indefinitely. However, if the level of preheating is sufficiently high ( keV cm2 for clusters), the long term cooling problem is severely mitigated. The reason for this is that because the system starts off on a higher adiabat, the initial cooling time of the ICM at all radii is significantly increased relative to the no preheating case. Consequently, clusters that have been significantly preheated will not undergo catastrophic at the centre until many gigayears following cluster formation. At the onset of catastrophic cooling at the cluster centre, the AGN switches on and heats the coolest gas. It is important to recognise, however, that in the preheating case the onset of catastrophic cooling at the very centre does not coincide with the time when the cluster entropy profile at larger asymptotes to the pure cooling state. As one can see in Fig. 12, the tendency of the model is indeed to evolve towards the pure cooling state, as expected. But because preheating reduces the initial cooling rate of the gas at larger radii, the time required to complete this transition is long compared to the typical age of massive clusters ( Gyr, according to cosmological simulations) or between the onset of catastrophic cooling at the centre and the present day. In other words, when preheating is introduced the long term cooling problem is not really “long term” at all. A clear prediction of the model, therefore, is that CC clusters should be much less abundant at high redshifts. Recent observations appear to suggest that this is indeed the case (Vikhlinin et al. 2007; Santos et al. 2008).
If we continue to evolve the model into the future, a further prediction is that the CC clusters we observe today will, in several gigayears time, complete their transition to states similar to those plotted in Fig. 11 (i.e., the no preheating case). By the same logic, many NCC clusters are expected to slowly evolve into systems that resemble present-day CC clusters. In this respect, our model differs from many other recently proposed models that seek to balance the heating and cooling rates of clusters, and thus arrive at a perfect steady-state configuration for the ICM. It is worth noting that there are several different pieces of observational evidence that support a scenario in which cooling and heating are not balanced and, as a result, the ICM is slowly evolving in a manner similar to that proposed in the present study. These include: (1) the lack of CC clusters at reported recently by Vikhlinin et al. (2007); (2) the accumulation of some cold gas (e.g., Edge et al. 2002) and moderate star formation rates (e.g., Egami et al. 2006) in the BCGs of some extreme CC clusters; and (3) the scaling between total radio-AGN energy output and cluster velocity dispersion is observed to be considerably shallower than the scaling of the radiative cooling rate with cluster velocity dispersion (Best et al. 2007).
Finally, in its simplest form, the preheating plus AGN “wood stove” model neglects distributed heating by the bubbles as they rise buoyantly through the ICM. However, most existing theoretical models and simulations of bubbles (e.g., Quilis et al. 2001; Brüggen & Kaiser 2002; Churazov et al. 2002; Omma & Binney 2004; Robinson et al. 2004; Omma et al. 2004; Dalla Vecchia et al. 2004; Roychowdhury et al. 2004; Voit & Donahue 2005; Heinz et al. 2006) show that the bubbles do not just float up to the level which their contents are at home and then simply melt away. Instead some of the energy associated with the bubbles is expected to be dissipated in the ambient ICM as they rise (e.g., through shocks, dissipation of work as the bubbles rise and expand, dissipation of turbulent motions generated by the rising bubbles; see McNamara & Nulsen 2007). Since the estimated energy associated with observed bubbles is fairly large (typically ergs), distributed bubble heating could be quite significant and may even be capable of balancing cooling losses. But, as noted earlier, the difficulty in completely balancing cooling losses lies in distributing the heat throughout the extremely large volume contained within the cooling radius and over the appropriate timescales. Many recent simulations (e.g., Soker & Pizzolato 2005; Vernaleo & Reynolds 2006; Gardini 2007; Pavlovski et al. 2007) show that buoyantly rising bubbles may not deposit the heat where and when it is needed. (Highly efficient thermal transport mechanisms, such as conduction or large physical viscosities, can help to distribute the heat more evenly and over larger scales, but may lead to a variety of other problems; see, e.g., Appendix D.) Nevertheless, the assumption of the proposed model that the bubbles rise adiabatically is clearly unrealistic and should be addressed in further explorations of the model. This will require the use of full hydrodynamic simulations, since distributed bubble heating is inherently a 3-D problem.
Having said the above, we do not expect that incorporating a more realistic treatment of the bubble heating will change the general concept of the proposed model. The mass transport in CC clusters must be quite efficient if this mechanism is to explain the observed widths of metallicity peaks (which are much more extended than the light of the central BCG) in such systems. Indeed, some recent observations show strong evidence that bubbles are transporting metals to large radii (e.g., Simionescu et al. 2007). In addition, recent observational studies of emission-line filaments in a few CC systems have revealed that the filaments are outflowing and the flow patterns are consistent with simulations of buoyantly rising bubbles (e.g., Hatch et al. 2006). Finally, hydrodynamic simulations of jets (e.g., Omma et al. 2004; Dalla Vecchia et al. 2004; Brighenti & Mathews 2006; Heinz et al. 2006; Sternberg et al. 2007; Brüggen et al. 2007) demonstrate that large quantities of gas are being transported to large radii and mixed with the gas there. All of these arguments provide support that the mass transport mechanism that lies at the heart of the “wood stove” model is indeed appropriate in CC clusters.
Finally, while there are several reasons to recommend the preheating + AGN “wood stove” model, we recognise that this model is not conventionally invoked to resolve the cooling problem in clusters. Here, we would simply like to stress that while we have adopted this simple heating model as a convenient foil, the central result of this paper is that all clusters require preheating to establish their structural properties in the first place. This conclusion does not rest on the assumed form of present-day heating.