The hyperyoung Hii region in G24.78+0.08 A1††thanks: Based on observations obtained at the Very Large Array (VLA) of the National Radio Astronomy Observatory (NRAO). NRAO is a facility of the national Science Foundation operated under cooperative agreement by Associated Universities, Inc.
Abstract
Context. G24.78+0.08 A1 is a star surrounded by a hypercompact (HC) Hii region, driving a CO bipolar outflow, and located at the center of a massive rotating toroid undergoing infall towards the HC Hii region. Recent water maser observations suggest that the HC Hii region is expanding and accretion onto the star is halted.
Aims. This study aims to confirm the expansion scenario proposed for the HC Hii region on the basis of recent H2O maser observations.
Methods. We carried out continuum VLA observations at 1.3 cm and 7 mm with the A array plus Pie Town configuration to map the HC Hii region towards G24.78+0.08 A1.
Results. The emission of the HC Hii region has been resolved and shows a ring shape structure. The profiles of the emission obtained by taking slices at different angles passing through the barycenter of the HC Hii region confirm the shell structure of the emission. The ratio between the inner and the outer radius of the shell, , derived fitting the normalized brightness temperature profile passing through the peak of the 7 mm emission, is 0.9, which indicates that the shell is thin. The deconvolved outer radius estimated from the fit is 590 AU. These results imply that the HC Hii region in G24 A1 cannot be described in terms of a classical, homogeneous Hii region but is instead an ionized shell. This gives support to the model of an expanding wind-driven, ionized shell suggested by the kinematics and distribution of the H2O masers associated with the HC Hii region. According to this model, the HC Hii region is expanding on very short times scales, 21–66 yr.
Key Words.:
ISM: individual objects: G24.78+0.08 A1 – ISM: Hii regions – stars: circumstellar matter – stars: formation1 Introduction
In the context of massive star formation, significant progress has been recently made with the detection of Keplerian circumstellar disks around newly born B-type stars, and of massive toroids around young O-type stars. These results lend support to the accretion models that describe the formation of high-mass stars as a scaled-up version of the formation of solar-type stars. Among the objects where rotation evidence has been inferred, one stands unique: this is G24.78+0.08 A1 (hereafter G24 A1). G24 A1 is one of the three massive rotating toroids detected in G24.78+0.08 (Beltrán et al. beltran04 (2004), beltran05 (2005)), a massive star formation region located at a distance of 7.7 kpc. At the center of G24 A1, an unresolved hypercompact (HC) Hii region has been detected at 1.3 cm by Codella et al. (codella97 (1997)). According to these authors, the spectral type of the star is at least O9.5, based on the free-free continuum flux, implying a stellar mass . Very Large Array (VLA) observations in the NH line have revealed that the gas in the toroid is undergoing infall towards the HC Hii region (Beltrán et al. beltran06 (2006)), suggesting that accretion onto the star might still be going on, even through the HC Hii region as described in some models (see e.g. Keto & Wood keto06 (2006)). However, recent VLBA proper motion measurements of H2O masers associated with the HC Hii region (Moscadelli et al. moscadelli07 (2007); hereafter MGCBF) indicate that the latter might be expanding, thus questioning the possibility of accretion onto the star.
To discriminate between the accretion and expansion scenarios, knowledge of the internal structure of the HC Hii region is crucial. According to MGCBF, the expansion should be driven by the stellar wind and the HC Hii region should thus have a shell-like appearance. With this in mind, we have imaged the free-free emission of the HC Hii region in G24 A1 in order to resolve its structure.
2 VLA Observations
We carried out interferometric observations in the 1.3 cm and 7 mm continuum with the VLA on April 7 and 8, 2006. The observations were carried out with the A array plus Pie Town configuration. The field phase center was set to the position (J2000) = , (J2000) = . The detection of strong H2O and CH3OH maser emission, respectively at 1.3 cm and 7 mm, within a few arcsec from the continuum source allowed us to self-calibrate on the maser spots and then apply the phase corrections to the continuum. The absolute position of the continuum at 1.3 cm was shifted 17 mas eastward and 35 mas northward to allow matching of our H2O maser spot positions with those measured with much greater accuracy by MGCBF with the VLBA. Final maps were created with the ROBUST parameter set equal to 0 at 1.3 cm, and with natural weighting at 7 mm. The resolution and sensitivity (3) attained were (PA=) and 0.25 mJy beam-1 at 1.3 cm, and (PA=) and 0.86 mJy beam-1 at 7 mm. Continuum images at 21 and 6 cm were obtained from VLA archive data (projects AB544 and AB515). The flux density at 6 cm and the upper limit at 21 cm were calculated from gaussian fits to G24 A1 and B (Codella et al. codella97 (1997)), made with the task JMFIT of AIPS. Since the angular resolutions (5136 and 5542 respectively at 6 and 21 cm) are insufficient to resolve A1 from B (separation 4″), in the fit we fixed the diameter of A1 to the half power beam width (HPBW) of the corresponding map, and its position to that obtained from our VLA + Pie Town observations. All parameters of G24 B were left free.
| Positiona | |||||
|---|---|---|---|---|---|
| h m s | (cm) | (K) | (mJy) | (AU) | |
| 18 36 12.555 | 12 10.83 | 1.3 | 72 | 580 | |
| 18 36 12.556 | 12 10.80 | 0.7 | 101 | 550 | |
(a) obtained from a 2D gaussian fitting
(b) geometrical mean of the major and minor semi-axes, obtained from gaussian
deconvolution

3 Results and discussion
3.1 Structure of the HC Hii region
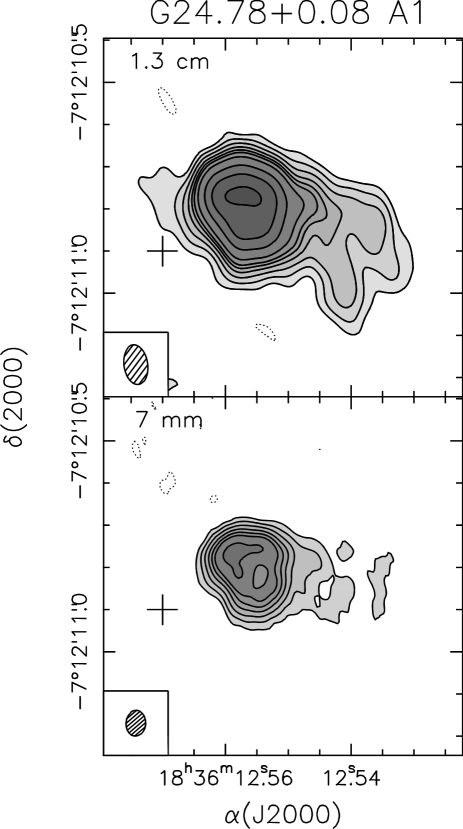
Figure 1 shows the emission of the HC Hii region towards G24 A1 at 1.3 cm and 7 mm wavelengths. Table 1 reports the absolute position, the maximum brightness temperature measured in the synthesized beam, , the flux density, , and the deconvolved radius, , of the HC Hii region at both wavelengths. In Fig. 2 we show the radio continuum spectrum of G24 A1 and the fit obtained for a classical Strömgren Hii region with radius of 013 (1000 AU at 7.7 kpc) and a stellar Lyman continuum of s-1, corresponding to an O9.5 type star.
The HC Hii region appears to be almost circular at both wavelengths, despite a faint “tail” extending towards the southwest. This slight asymmetry could be due to lower density of the ambient gas, as suggested by the fact that the peak of the 1.3 mm continuum emission imaged by Beltrán et al. (beltran04 (2004)) lies on the opposite side of the HC Hii region (see cross in Fi.g 1). Such a “tail” is unlikely to be related to the velocity gradient observed on a larger scale in the CH3CN lines (Beltrán et al. beltran04 (2004)), as the directions of the two are quite different (PA245° and 222° respectively for the “tail” and the gradient). Moreover, the expansion of the HC Hii region cannot affect the velocity field over a region 10 times larger, like that where the gradient is observed.
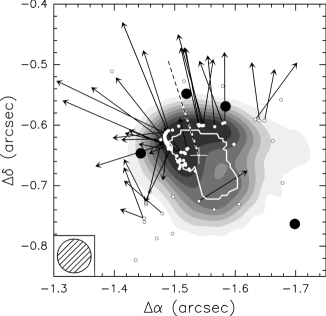
As can be seen in Figure 1, the emission is resolved at both wavelengths, and shows limb brightening, especially in the eastern edge of the HC Hii region. The resolution at 7 mm is high enough to resolve the structure of the HC Hii region, which resembles a ring. To better study this ring morphology, a 7 mm map with ROBUST=0 and reconstructed with a circular beam of was created. Using this map, we obtained profiles of the emission at different angles by taking slices passing through the barycenter of the HC Hii region (cross in Fig. 3), located at (J2000) = , (J2000) = . Such emission profiles, not shown here, show two peaks, as one would expect in the case of an emission ring. In Fig. 3, we have outlined the ring by joining the positions of these peaks. This suggests that what we are observing in the continuum is an ionized gas shell. This is not in contradiction with the continuum spectrum of the region (Fig. 2), because as discussed by Shull (shull80 (1980)), the free-free spectrum of a shell Hii region is basically indistinguishable from that of a homogeneous, spherical Strömgren Hii region with the same angular radius and Lyman continuum. The only distinction between the shell and the spherical models is the presence of limb brightening at optically thin frequencies, as observed in G24 A1.
Although the existence of an emission shell appears evident, the resolution of our observations is not sufficient to derive the intrinsic diameter of the ring in Fig. 3. For this purpose we have taken the brightness temperature profile along a cut (dashed line in Fig. 3) passing through the barycenter of the 7 mm image and the peak of the emission. This profile (see Fig. 4) has been normalized both in temperature and radius, dividing the former by the brightness temperature measured at the position of the barycenter ( K) and the latter by the full width at half power (FWHP=017) of the HC Hii region. For a shell Hii region, this profile depends on three parameters only: the ratio FWHP/HPBW, the optical depth at the center of the Hii region, and the ratio between the inner and outer radius of the shell. In our case, we know that FWHP/HPBW=3.085 and for an electronic temperature of K. The best fit is then obtained for and is shown in Fig. 4.
Such a result is in agreement with the prediction of Shull (shull80 (1980)) that the shell should be very thin, i.e. . From the fit it is also possible to estimate the deconvolved radius of the shell, which is 590 AU. Note that this is significantly smaller than the value of AU needed to fit the observed radio continuum spectrum of the HC Hii region (see Fig. 2). This is due to the fact that the HC Hii region is not perfectly spherically symmetric, but shows an emission “tail” towards the southwest (see above), which in spite of its relatively low brightness, conveys a non-negligible fraction of the total flux – 28% (20 mJy) at 1.3 cm and 30% ( mJy) at 7 mm. This “extra” flux cannot be accounted for by the simple shell model.
3.2 Expansion of the HC Hii region
As shown before, the HC Hii region in G24 A1 cannot be described in terms of a classical compact and spherical Hii region, but of an ionized shell. This result confirms the interpretation given by MGCBF to explain the distribution and proper motions of the 22.2 GHz water maser features towards G24 A1. As seen in Fig. 3, the water masers are well correlated with the eastern edge of the HC Hii region and have proper motions directed approximately perpendicular to the arc described by the maser spots. According to MGCBF, this configuration indicates that the water masers are tracing expansion, which in turn suggests that the HC Hii region is expanding. Because of the high velocity ( km s-1), such an expansion cannot be lead by the thermal pressure of the ionized gas, as in the classical case depicted, e.g., by De Pree et al. (depree95 (1995)). Therefore, it must be some additional mechanism driving the expansion. This is also suggested by the line width (40 km s-1) of the H66 recombination line (Goddi, private communication): this is well in excess of the thermal width in Hii regions (typically 20 km s-1) and thus requires additional broadening (see Sewilo et al. sewilo04 (2004)), such as large scale motions, consistently with our expanding model. Note however, that the width of the recombination line appears to indicate a smaller expansion velocity (Robinson et al. robinson82 (1982); Welty welty83 (1983)) than that traced by the water masers. However, a caveat is in order. The problem posed by the detection of such broad recombination lines is not yet solved (see Sewilo et al. sewilo04 (2004)), especially because their strength is inconsistent with the Hii region being optically thick in the continuum. For this reason, to describe the recombination line emission from hypercompact Hii regions, and thus obtain a correct estimate of the expansion velocity, one needs a better model, where kinematics and radiative transfer are properly taken into account, which goes beyond the purposes of the present work.
Following the model by Shull (shull80 (1980)), MGCBF, conclude that the Hii region expansion may be driven by a powerful stellar wind. In such a model, there is an initial phase of free expansion at the wind velocity, when the wind sweeps up its own mass in interstellar matter. After that, the system evolves into a four-zone structure, in which a thin, dense ionized shell containing most of the swept up material is created. In this process two phases can be identified: a pressure-driven expansion, followed by a momentum-driven expansion after a critical time that depends on the wind mechanical luminosity and density of the surrounding environment. For a given wind mechanical luminosity and density, the radius () and velocity () of the expanding shell can be expressed as a function of time (Shull shull80 (1980)). For our estimates we have adopted a Lyman continuum of s-1 (see Sect. 3.1), an inner-to-outer radius ratio of 0.9 for the shell (see Sect. 3.1), and the fiducial values of cm-3, erg s-1, and 2000 km s-1 respectively for the environment density, mechanical luminosity of the wind, and wind speed (see MGCBF for a detailed discussion on the input model parameters).


The values of the shell radius and velocity as a function of time are shown in Fig. 5, as well as the 1.3 cm and 7 mm continuum fluxes of the HC Hii region. For the sake of comparison, we also show the same quantities for a classical Strömgren Hii region (dashed curves). The corresponding observed values with the associated uncertainties are also reported and demonstrate that only the wind-driven can fit all the data. Note that the fluxes used here (56 mJy at 1.3 cm and 74 mJy at 7 mm) do not contain the contribution from the emission “tail” mentioned in Sect. 3.1.
Given the very short time scale involved (21–66 yr), the size variation expected in only 5 yr (10 mas) should be easy to reveal using the H2O maser spots as probes, thus providing us with a robust test for our model.
4 Conclusions
Our radio continuum images with 90 mas resolution have revealed a ring shaped structure in the HC Hii region at the center of the rotating toroid imaged by Beltrán et al. (beltran04 (2004)), supporting the model of a wind-driven, ionized shell proposed by MGCBF. We thus conclude that very likely the HC Hii region is expanding on very short time scales (21–66 yr). This finding appears to contradict the fact that the gas on a larger scale is infalling towards the HC Hii region (Beltrán et al. beltran06 (2006)). A possible explanation is that the infalling gas is not accreting any more onto the star, but is stopped (and possibly diverted into the outflow observed by Furuya et al. furuya02 (2002)) at the surface of the HC Hii region, right at the shock front traced by the H2O maser spots. It is worth noting that the CH3OH masers observed by MGCBF appear to lie further from the HC Hii region than the H2O masers, suggesting that they might be located in the pre-shock material. If this is the case, methanol masers should be participating to the infall and their proper motions should be directed towards the HC Hii region, unlike the water masers which are clearly expanding from it. Future VLBI multi-epoch measurements are bound to confirm or rule out this scenario.
Acknowledgements.
MTB is supported by MEC grant AYA2005-08523-C03.References
- (1) Beltrán, M. T., Cesaroni, R., Codella, C., Testi, L., Furuya, R. S., & Olmi, L. 2006, Nature, 443, 427
- (2) Beltrán, M. T., Cesaroni, R., Neri, R., Codella, C., Furuya, R. S., Testi, L., & Olmi, L. 2005, A&A, 435, 901
- (3) Beltrán, M. T., Cesaroni, R., Neri, R., Codella, C., Furuya, R. S., Testi, L., & Olmi, L. 2004, ApJ, 601, L187
- (4) Codella, C., Testi, L., & Cesaroni, R. 1997, A&A, 325, 282
- (5) De Pree, C. G., Rodríguez, L. F., & Goss, W. M. 1995, RevMexAA, 31, 39
- (6) Forster, J. R., & Caswell, J. L. 2000, ApJ, 530, 371
- (7) Furuya, R. S., Cesaroni, R., Codella, C. et al. 2002, A&A, 390, L1
- (8) Keto, E., & Wood, K. 2006, ApJ, 637, 850
- (9) Moscadelli, L., Goddi, C., Cesaroni, R., Beltrán, M. T., & Furuya, R. S. 2007, A&A, submitted (MGCBF)
- (10) Robinson, G. J., Reay, N. K, & Atherton, P. D. 1982, MNRAS, 199, 649
- (11) Sewilo, M., Churchwell, E., Kurtz, S., Goss, W. M., & Hofner, P. 2004, ApJ, 605, 285
- (12) Shull, J. M. 1980, ApJ, 238, 860
- (13) Welty, D. E. 1983, PASP, 95, 217