The Monitor project: JW 380 – a , pre main sequence eclipsing binary in the Orion Nebula Cluster
Abstract
We report the discovery of a low-mass (, ) pre-main-sequence eclipsing binary with a orbital period. JW 380 was detected as part of a high-cadence time-resolved photometric survey (the Monitor project) using the Isaac Newton Telescope and Wide Field Camera for a survey of a single field in the Orion Nebula Cluster (ONC) region in and bands. The star is assigned a per cent membership probability from proper motion measurements, and radial velocity observations indicate a systemic velocity within of that of the ONC. Modelling of the combined light and radial velocity curves of the system gave stellar radii of and for the primary and secondary, with a significant third light contribution which is also visible as a third peak in the cross-correlation functions used to derive radial velocities. The masses and radii appear to be consistent with stellar models for age from several authors, within the present observational errors. These observations probe an important region of mass-radius parameter space, where there are currently only a handful of known pre-main-sequence eclipsing binary systems with precise measurements available in the literature.
keywords:
stars: individual: JW 380 – open clusters and associations: individual: Orion Nebula Cluster – binaries: eclipsing – stars: pre-main-sequence – surveys.1 Introduction
Detached eclipsing binaries (EBs) provide one of the most precise ( per cent) and accurate (largely model and distance independent) methods for measurement of fundamental stellar properties (particularly, masses and radii). These can be used to place stringent constraints on stellar evolution models.
On the pre-main-sequence (PMS), such constraints are presently extremely scarce below , and to our knowledge there are only known PMS EB systems in this mass range. These are a , EB (Stassun et al., 2004) and a , EB (Covino et al. 2004; Covino et al. 2001), both in Orion (the former is thought to belong to the Ori 1c association), with corresponding age , an M-dwarf EB in NGC 1647 (; Hebb et al. 2006), and two EBs in the ONC: a brown dwarf-brown dwarf system (Stassun, Mathieu & Valenti 2006; Stassun, Mathieu & Valenti 2007) and a , M-dwarf EB (Cargile, Stassun & Mathieu, submitted). Comparison of the NGC 1647 and ONC brown dwarf systems to a variety of stellar models (specifically: Baraffe et al. 1998; Siess, Forestini & Dougados 1997; Yi et al. 2001; Girardi et al. 2000 for the former, and Baraffe et al. 1998; Burrows et al. 1997; D’Antona & Mazzitelli 1997 for the latter) by the respective authors has indicated that none fit both components of the binaries simultaneously. In the case of the brown dwarf EB, the models do seem to be reasonably consistent with both objects, but the secondary appears to be hotter than the primary, a very surprising result that was not predicted by any of the models.
The study of low-mass stars poses a challenge for stellar models. Stars near to the hydrogen burning limit are sufficiently cool that the interior is in a partially-degenerate state on the main sequence (Chabrier & Baraffe, 1997), and magnetic fields may play an important role (Mullan & MacDonald, 2001). The approximations underlying the usual ‘grey’ atmosphere models break down, so non-grey model atmospheres must be determined, taking account of effects such as the recombination of molecules (e.g. H2 and TiO) due to the low temperatures (Baraffe et al., 2002). One of the only ways to test these models is by comparison with precise observations of low-mass stars.
It is therefore essential that a larger sample of pre-main sequence systems be found and characterised, to provide better constraints on the models. This is the primary aim of the Monitor project (Aigrain et al. 2007; Hodgkin et al. 2006), a photometric monitoring survey we have undertaken of all suitable nearby, pre-main sequence open clusters and star forming regions, to search for detached eclipsing binary and transiting planet systems. This publication presents the first of these, a detached EB in the Orion Nebula Cluster, which has age and distance (Hillenbrand, 1997).
2 Photometry
2.1 Survey photometry
Eclipses in JW 380 were initially detected in our photometric monitoring data of the ONC obtained using the Isaac Newton Telescope (INT), with the Wide Field Camera (WFC), during two -night observing runs, one in late-November 2004, and one in January 2005. This was supplemented by two further -night runs in December 2005 and 2006.
A single field centred on the Trapezium region ( Ori) was observed for the entire time it was at airmass , per night, using alternating -band and -band exposures. Due to the fast () readout of the WFC this gave a cadence of . A total of exposures were obtained in each passband, for a total time on target of . Our observations are sufficient to give an RMS per data point of or better down to and .
Light curves were extracted for a total of objects using our differential photometry software (Irwin et al., 2007). The -band light curves in particular are somewhat affected by the presence of nebulosity in the ONC region, and show significantly more scatter than the -band data. We therefore used the latter for detection of eclipsing binary systems, and the -band observations for confirmation.
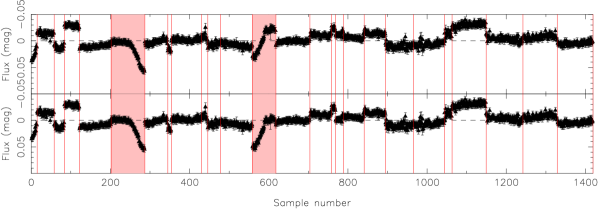
Due to the extensive intrinsic stellar variability seen in ONC stars (e.g. Stassun et al. 1999, Herbst et al. 2002), the search for eclipsing systems was by necessity performed manually. The first candidate detected in this way is the subject of the present paper. The -band light curve (see the upper panel of Fig. 1) shows eclipse events, with peak-to-peak out of eclipse variations.
The object appears in the catalogue of Jones & Walker (1988) as star , with membership probability derived from proper motion measurements by these authors. It was also detected by the Chandra Orion Ultradeep Project (COUP; Getman et al. 2005, star 468), and in the Two Micron All-Sky Survey (2MASS), as source 2MASS J05351214-0531388.
The photometric properties of the object are summarised in Table 1. and magnitudes were derived from the Monitor photometry using colour equations from the INT wide field survey web pages111http://www.ast.cam.ac.uk/~wfcsur/technical/photom/colours/, and the near-IR , and magnitudes from the 2MASS photometry using colour equations in the 2MASS explanatory supplement222http://www.ipac.caltech.edu/2mass/releases/allsky/doc/sec6_4b.html. Spitzer/IRAC measurements are from Table 1 of Rebull et al. (2006).
| Passband | Magnitude | Source |
|---|---|---|
| INT/WFC | ||
| INT/WFC | ||
| 2MASS | ||
| 2MASS | ||
| 2MASS | ||
| Spitzer/IRAC | ||
| Spitzer/IRAC | ||
| Spitzer/IRAC | ||
| Spitzer/IRAC |
| Passbands | Colour | Source |
|---|---|---|
| INT/WFC | ||
| 2MASS | ||
| 2MASS | ||
| Spitzer/IRAC | ||
| Spitzer/IRAC |
The measured composite -band magnitude and the models of Baraffe et al. (1998) imply a total system mass of if the system was a single star, or assuming that the primary contributes half of the system light, (the latter is a more reasonable assumption for a near equal mass binary), and the optical colour implies a spectral type of M5 using the intrinsic colours of Leggett (1992).
Examination of the COUP light curve333Light curves are available in the source atlas on the COUP web site: http://www.astro.psu.edu/coup/ shows two flare events, but no obvious evidence for eclipses at the present time. This is under investigation, in collaboration with members of the COUP team.
Spitzer/IRAC measurements for JW 380 are available in Table 1 of Rebull et al. (2006), and are reproduced here in Table 1. Comparing the observed and colours to those derived in NGC 2362 by Dahm & Hillenbrand (2007) indicates that these measurements may provide evidence for a weak disc excess, but this conclusion is somewhat ambiguous due to the obvious composite nature of the system, which will affect the observed colours.
From the full INT/WFC data-set, a preliminary period of was determined using a standard box-fitting least squares transit search program (Aigrain & Irwin, 2004).
2.2 Follow-up photometry
Initial follow-up observations were obtained during 2006 February by J. Holtzman using the New Mexico State University robotic telescope, in -band, at the predicted times of eclipse from the INT data.
JW 380 was also monitored using the , and telescopes444Now operated by the SMARTS consortium. at the Cerro Tololo Inter-American Observatory (CTIO). Observations were obtained from 2005 December to 2007 January, in and bands, although the majority of the data are in -band. Differential light curves were determined from PSF photometry using an algorithm for inhomogeneous ensemble photometry (Honeycutt, 1992) as implemented in Stassun et al. (1999), Stassun et al. (2002) for observations of high-nebulosity regions such as the ONC.
All the available data were combined to produce two composite light curves, one in -band and the other in -band, applying a normalisation to account for zero point offsets between the various photometric systems in use, based on the median out-of-eclipse level. Note that the and passbands are not strictly identical: the (SDSS) passband is slightly bluer than the conventional (Cousins) passband, by per cent in the colour. However, with the present data it is difficult to correct for this effect, and we expect that the errors introduced by not doing so will be negligible given the photometric errors.
An updated period of was determined by applying a new double trapezoid fitting program (Aigrain et al., in prep).
2.3 Out of eclipse variations
The out of eclipse variations were found to not phase-fold at the same period as the eclipsing binary, and moreover with the full combined data-set it was not possible to find a consistent period for them, presumably due to changes in the spot coverage of the stellar surfaces causing phase and amplitude changes in the out of eclipse modulations, over shorter time-scales than the observing window.
The INT/WFC data considered alone are concentrated into observing runs, so we attempted fitting of the out-of-eclipse parts of this light curve. If these are due to spots on the surface of one of the component stars, this allows the rotation period of the star to be determined, and if a sufficiently good model for the spot behaviour can be found, the modulations can be removed, to improve the accuracy of the eclipsing binary model fit.
The period finding algorithm from Irwin et al. (2006) (based on least squares fitting of sinusoidal modulations) was modified to fit different phases, amplitudes and zero-point levels for each of the four observing runs, fitting for a common period, presumed to be the rotation period of the star. The results of this procedure are shown in Figure 2.
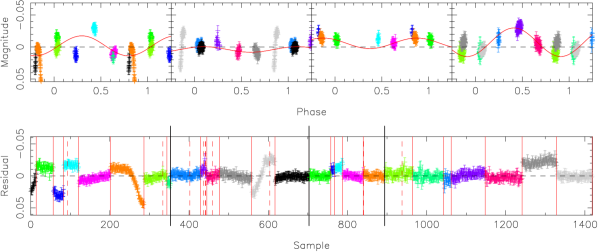
Figure 2 indicates that the fit provides a good description of the majority of the out-of-eclipse variations, except in the first five nights and the penultimate night. This indicates that a model assuming a constant stellar rotation period, here (which is not equal to the binary period or a multiple thereof), and with moderate evolution of spot coverage over one month timescales, provides a good description of the majority of the out-of-eclipse variability. We note also that Herbst et al. (2002) list a rotation period of for this star, which tends to confirm our result.
However, Figure 2 shows that the model we have presented does not completely describe the variation in the nights containing eclipses, and this technique is not applicable to the follow-up data due to the sparse time coverage (providing insufficient data to fit the rotational modulations in each individual light curve segment, before the spot configuration changes).
Therefore, we elected to simply reduce the effect of the out of eclipse variability on the measured eclipse depths by subtracting the median out of eclipse light curve level from each night containing an eclipse (see the lower panel of Figure 1), since this technique treats the entire composite light curve consistently. We caution that this is not equivalent to modelling the spots physically, which will be necessary for a more accurate light curve fit to improve the derived physical parameter estimates. Fortunately, in most cases the effect of the spots on the inferred physical parameters is minor. For example, in the analysis of the young eclipsing binary V1174 Ori, Stassun et al. (2004) found that modelling the out of eclipse variability with spots did not alter the derived stellar parameters significantly, with changes of per cent in the derived masses and radii, and per cent in the ratio of effective temperatures.
3 Spectroscopy
In order to confirm the eclipsing binary nature of the system, and to derive the orbital parameters, multiple radial velocity measurements are required. These were obtained using two instruments: the FLAMES multi-object fibre-fed échelle spectrograph on VLT UT2 in the optical, and the NOAO Phoenix spectrograph on Gemini South.
3.1 VLT/FLAMES
VLT/FLAMES observations were obtained during 2006 November (programme 078.C-0841). GIRAFFE fibres were allocated to all of our eclipsing binary candidates in addition to other suspected ONC members. A total of five spectra were obtained in each of two standard settings: HR15n covering with resolving power and HR21 covering at . Data were reduced using the GIRAFFE Base-Line Data Reduction Software (Blecha et al., 2000), with additional custom-written software for sky subtraction using fibres allocated to blank sky. The HR15n setting was strongly contaminated by spatially-variable emission lines from the Orion Nebula, so we preferred the HR21 setting for determination of radial velocities, and this has been used henceforth.
Radial velocities were determined by cross-correlation using fxcor in IRAF555IRAF is distributed by the National Optical Astronomy Observatories, which are operated by the Association of Universities for Research in Astronomy, Inc., under cooperative agreement with the National Science Foundation. (Tody, 1993). Since it is impractical to observe radial velocity standard stars with FLAMES, we used model atmosphere spectra from the MARCS library (Gustafsson et al., 2003) to provide the cross-correlation templates. Cross-correlations for the present object were derived using a template with , solar metallicity, and , in accordance with the predicted surface gravity from the stellar models of Baraffe et al. (1998). Radial velocity errors were estimated using the method of Tonry & Davis (1979) as implemented in fxcor.
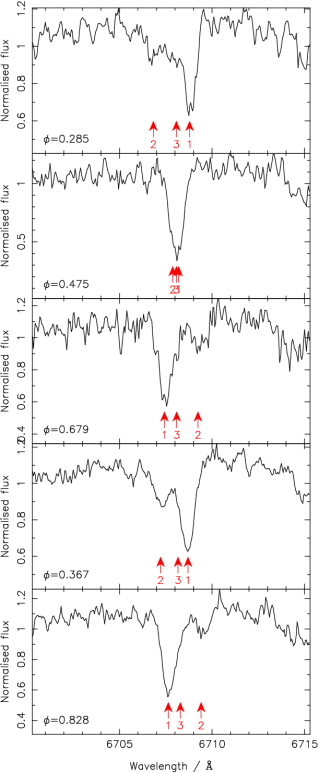
The observed cross-correlation functions show clear triple-lined profiles (see Figure 3) in a total of epochs (including all the radial velocity data, see also §3.2) around maximum radial velocity separation, with the two outer components (the primary and secondary stars in the eclipsing binary) exhibiting radial velocity variations. The central component (hereafter the tertiary – although note that this star is not necessarily physically associated with the binary) does not appear to show radial velocity variations.


We note that strong Lii absorption is clearly visible in the HR15n setting, which indicates youth, and hence membership of the ONC. The Lithium line profiles from our HR15n spectra are shown in Figure 4. Equivalent widths were estimated by fitting three-component Gaussian models to the two best-resolved epochs (the first and third in Fig. 4), at the expected wavelengths from the radial velocities for each component. The values obtained were for the primary, for the secondary, and for the tertiary (errors estimated using bootstrapping). Note that in order to compare to the values for single stars, these measured equivalent widths must be corrected for the relative luminosities of the stars.
Unfortunately, we are unable to correct the Lii equivalent widths for spectral veiling at present, since we do not see suitable features in our spectra (e.g. Nii , Fei or Vi as used by Palla et al. 2007) with which to compute the veiling, despite the majority of our spectra having very good signal to noise ratios ( or ). The values we have computed must therefore be considered to give lower limits on the measured Lithium abundance. Nevertheless, assuming the primary to contribute of the light in the system, the implied equivalent width is , which is a typical value for ONC stars of this mass (e.g. see Sicilia-Aguilar et al. 2005).
3.2 Gemini/Phoenix
Additional radial velocity measurements were obtained using the near-infrared spectrograph Phoenix (Hinkle et al., 2002) on Gemini South, on three nights: 2006 December 1, 2 and 4 (programme GS-2006B-C-7). Following Mazeh et al. (2002), we used the H6420 order sorting filter and the widest () slit, with a central wavelength of to give a wavelength range of at resolving power . Exposures were taken in AB pairs, nodding along the slit, to aid subtraction of the sky background and residual dark current features in the detector. A total of eight epochs were obtained for this object, with average signal to noise ratios of or . Data were reduced using standard IRAF long-slit reduction procedures, and cross-correlations with the radial velocity standard star GJ 173 (M1.5 spectral type) in fxcor were used to derive radial velocities, since this template gave the largest cross-correlation signal. This suggests that the primary spectral type is close to M1.5. Using the effective temperature scale of Cohen & Kuhi (1979), this corresponds to .
Despite the high resolution and signal to noise ratio of our data, it is difficult to see the individual line profiles in the Phoenix spectra. This may be partly due to the very strong dependence on spectral type in this wavelength region (e.g. see Bender et al. 2005), where the atomic lines become weak moving to the later spectral type secondary and tertiary components. This also partly explains the reduction in cross-correlation signal for these objects (see Figure 3), since we used an earlier-type template with strong atomic lines.
We note that the unavoidable use of different templates for the two instruments may introduce systematic offsets between the two sets of radial velocities. We have tried to minimise this source of error by using templates with similar effective temperatures.
3.3 Spectroscopic orbit solution
The photometry and initial VLT/FLAMES radial velocities were found to be consistent with the photometrically-derived period, but the Gemini/Phoenix velocities were not. A consistent solution was found at twice the initial period, or . Re-examination of the light curve indicated that three secondary eclipses had in fact been observed, and that these had depths of in -band. This is simply a result of the improved phase coverage obtained by including the Gemini/Phoenix radial velocity data.
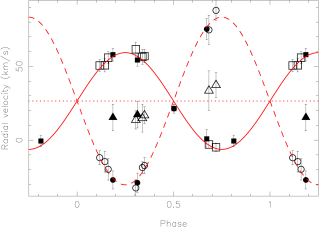
Figure 5 shows the resulting phase-folded radial velocity curve, with period and phase zero-point fixed at the photometrically-determined values. Neither the light curve nor radial velocity curve appear to show significant deviation from the predictions for a circular orbit, with a formal fit giving eccentricity , so we have assumed zero eccentricity henceforth.
Table 2 gives the orbital parameters derived from the radial velocity fit.
| Systemic velocity | ||
|---|---|---|
| Primary semi-amplitude | ||
| Secondary semi-amplitude | ||
| Mass ratio () | ||
| Semimajor axis | ||
| Total mass | ||
| Primary mass | ||
| Secondary mass | ||
| Reduced | 0.60 |
The measured systemic velocity () is . This is very close to the systemic velocity of the ONC, of (Stassun et al. 1999; Sicilia-Aguilar et al. 2005), which provides a further kinematic confirmation of cluster membership.
Since the tertiary lies approximately at the ONC systemic velocity in the cross-correlations, it seems likely that this star is also a member of the ONC. If this is the case, the measured stellar density in the ONC (e.g. Hillenbrand 1997 found members with over a region) indicates a probability of of a chance superposition of another ONC member with the binary, within (the best seeing experienced in our observing runs). It thus seems likely that the system is a physical triple.
4 Light curve analysis
The -band light curve was analysed using jktebop (Southworth, Maxted & Smalley 2004a; Southworth et al. 2004b), a modified version of ebop (Eclipsing Binary Orbit Program; Popper & Etzel 1981; Etzel 1981). These codes use a model in which the discs of the stars are approximated using biaxial ellipsoids (Nelson & Davis, 1972). This approximation is only applicable in well-detached systems where the stars are close to spherical, as in the present case. Note that star spot modelling and handling of multi-band light curves are not implemented in these codes, and must be done externally, as we have in the present work. The jktebop code contains several enhancements, including fitting of the sum and ratio of the stellar radii, the use of the Levenberg-Marquardt minimization algorithm for least-squares fitting (Press et al., 1992), and of particular interest for the present discussion, Monte Carlo simulation to determine robust error estimates for the stellar parameters, which has been shown to give reliable results (Southworth et al., 2005). Note that we have not used the -band light curve in the present analysis, since there are no secondary eclipses observed, and the photometric precision reached is somewhat poorer. The observed primary eclipses have very similar depth to the -band eclipses.
The light curve analysis for the present system is complicated by the known presence of third light. From Figure 3, it appears that the cross-correlation peaks for the secondary and tertiary are of very similar height and shape, which suggests that the third light star has a similar flux and spectral type to the secondary. We therefore expect it to contribute of the light in the system, assuming a ratio of -band luminosity.
Due to the need to fit the third light contribution, we fixed as many parameters as possible, to improve stability. In -band, limb darkening is of much lower importance than for bluer passbands, so we fixed these parameters. We used a linear limb darkening law:
| (1) |
where is the cosine of the angle between the line-of-sight and the normal to the stellar surface, is the observed surface intensity at wavelength as a function of , and is the linear limb darkening coefficient. Values of of for the primary star (, , ) and (, , ) for the secondary star were adopted from Claret (2004), for the SDSS passband, which is the closest match to the SDSS-like filters used in this work. The gravity darkening exponents were also fixed, at , a value appropriate for stars with convective envelopes (Lucy, 1967), and the option in jktebop to calculate the reflection effect was used, rather than fitting for it. This is generally a reasonable approach for well-detached systems.
The remaining parameters were allowed to vary. These are the sum of the radii, (where , the radius divided by semimajor axis, a parameter which can be determined from the light curve analysis alone), the radius ratio , orbital inclination , surface brightness ratio (again defined as secondary divided by primary such that ) and fractional luminosity of the third light . We also allowed the period and phase zero-point (defined as the heliocentric Julian day of the secondary eclipses) to vary, to refine the existing values. Note that the quantity and the luminosities quoted here are for -band.
Note that the ebop codes model only single-band light curves, and do not use model atmospheres, so it is not necessary to assume an effective temperature or surface gravity in the fit itself: these parameters enter only through the (assumed) limb darkening coefficients, and we expect this dependence to be weak in -band.
Figure 6 show the -band phase-folded light curve, with the fit overlaid. The system parameters derived from the light curve fitting are given in Table 3. Errors were estimated using the Monte Carlo analysis, with iterations, the results of which are also shown in Figure 7.
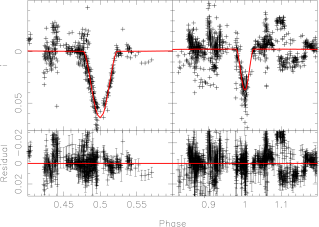
| Radius sum | ||
|---|---|---|
| Radius ratio | ||
| Orbital inclination | ||
| Surface brightness ratio | ||
| Third light ratio | ||
| Orbital Period | ||
| Phase zeropoint (HJD) | ||
| Primary radius | ||
| Secondary radius | ||
| Luminosity ratio | ||
| Temperature ratio |
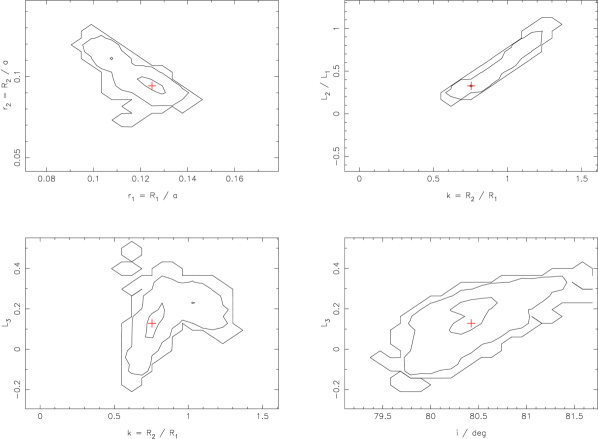
The Monte Carlo algorithm uses the best fit to generate a synthetic light curve, injecting Gaussian noise with amplitude determined by the observational errors to produce a simulated light curve, which is then fit to determine a new set of parameters. The errors can be estimated using the distribution of the parameters from a large number of realisations of this process. See also Southworth et al. (2004a) and Southworth et al. (2004b) for more details.
Since the luminosity ratio was not constrained in the analysis, the solution with the radii of the two stars swapped ( or ) is also formally permitted by the fit, which leads to highly asymmetric errors for , and the two fractional radii.
Table 4 summarises the final system parameters, combining the radial velocity and light curve information. Note the extremely large stellar radii and low surface gravities, as expected for a very young system.
| Primary mass | ||
|---|---|---|
| Secondary mass | ||
| Primary radius | ||
| Secondary radius | ||
| Semimajor axis | ||
| Primary gravity | ||
| Secondary gravity |
We caution that the effects of the out-of-eclipse modulations are non-negligible in this system, and these have not been modelled at present due to the lack of suitable light curve data. Therefore, the parameters derived from the light curve fitting may be affected by systematic errors due to not properly accounting for the spot-induced photometric variations. Improved light curves will be required to resolve this problem.
5 Comparison with stellar models
We are unable to determine accurate effective temperatures at the present time, so the only comparison which can be made to stellar models with the present data-set is in the mass-radius plane. Figure 8 shows a comparison of the observations for the present system with the Lyon group stellar models. The primary and secondary are consistent within the error bars with the model of Baraffe et al. (1998), but away from the model. The primary is also consistent within with the model. The value of is fully consistent with the upper end of the canonical age for the ONC (Hillenbrand, 1997).
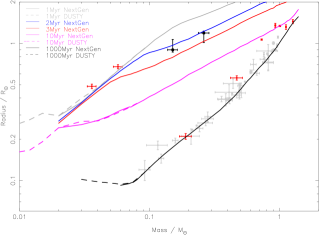
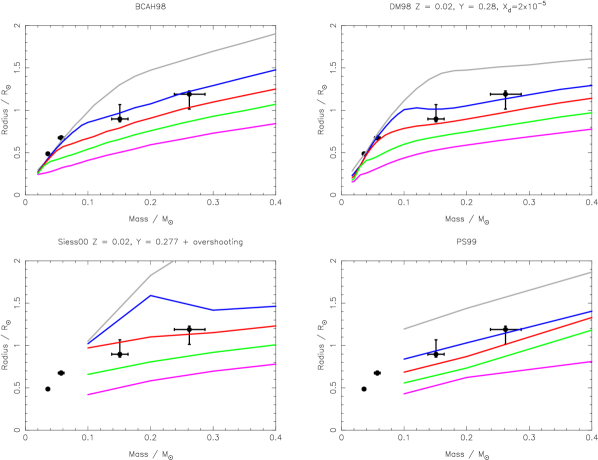
Figure 9 shows the position of the eclipsing binary relative to models from Baraffe et al. (1998), D’Antona & Mazzitelli (1998), Siess et al. (2000) and Palla & Stahler (1999). The results for the Baraffe et al. (1998), D’Antona & Mazzitelli (1998) and Palla & Stahler (1999) are consistent with the inferred age from above; although there are clearly visible differences between the results of these sets of tracks (especially when comparing D’Antona & Mazzitelli 1998 to the others), the measurement errors are too large to distinguish them at present. Comparing the data with the models of Siess et al. (2000) would indicate a slightly older age of . However, there is a visible discontinuity in the latter tracks at , and they are not well-sampled over this mass range.
Given the present observational errors, it is not yet meaningful to perform a more detailed comparison with stellar models. We plan to obtain improved photometry and radial velocity measurements to resolve this, in addition to spectroscopy covering suitable lines for determining effective temperatures and flux ratios.
6 Conclusions
We have reported the detection of a new pre-main-sequence eclipsing binary, JW 380, which appears to be a member of the Orion Nebula Cluster (membership probability , systemic velocity within of the cluster systemic velocity). The system consists of a , eclipsing binary with period , blended with a significant ( per cent of the total luminosity) third light component, which appears to show no significant radial velocity variations over the (limited) observing window.
Modelling the combined light and radial velocity curves for the system yielded stellar radii of and for the primary and secondary of the binary system. These large radii are consistent with the age stellar models of Baraffe et al. (1998), D’Antona & Mazzitelli (1998) and Palla & Stahler (1999), and the age models of Siess et al. (2000) given the masses of the system components. The systemic radial velocity is consistent with that of the ONC, and the detection of a clear Lii absorption feature is also suggestive of youth, and hence ONC membership.
Acknowledgments
The Isaac Newton Telescope is operated on the island of La Palma by the Isaac Newton Group in the Spanish Observatorio del Roque de los Muchachos of the Instituto de Astrofisica de Canarias. Based in part on observations collected at the European Southern Observatory, Chile, as part of ESO programme 078.C-0841. Also based on observations obtained with the Phoenix infrared spectrograph, developed and operated by the National Optical Astronomy Observatory, at the Gemini Observatory, which is operated by the Association of Universities for Research in Astronomy, Inc., under a cooperative agreement with the NSF on behalf of the Gemini partnership: the National Science Foundation (United States), the Particle Physics and Astronomy Research Council (United Kingdom), the National Research Council (Canada), CONICYT (Chile), the Australian Research Council (Australia), CNPq (Brazil) and CONICET (Argentina). Based on observations obtained at Cerro Tololo Inter-American Observatory, a division of the National Optical Astronomy Observatories, which is operated by the Association of Universities for Research in Astronomy, Inc. under cooperative agreement with the National Science Foundation. This publication makes use of data products from the Two Micron All Sky Survey, which is a joint project of the University of Massachusetts and the Infrared Processing and Analysis Center/California Institute of Technology, funded by the National Aeronautics and Space Administration and the National Science Foundation. This research has also made use of the SIMBAD database, operated at CDS, Strasbourg, France.
JI gratefully acknowledges the support of a PPARC studentship, and SA the support of a PPARC postdoctoral fellowship. This work was supported by NSF Career grant AST-0349075, and by a Cottrell Scholar award from the Research Corporation, to K.G.S. We would like to thank Francesco Palla for supplying model tracks used in §5, John Southworth for the jktebop code, Gwendolyn Meeus for VLT/ISAAC spectroscopy, Thierry Morel, Hans van Winckel and Conny Aerts for data from the Mercator telescope, and the anonymous referee for feedback which has helped to improve the paper.
References
- Aigrain & Irwin (2004) Aigrain S., Irwin M., 2004, MNRAS, 350, 331
- Aigrain et al. (2007) Aigrain S., Hodgkin S., Irwin J., Hebb L., Irwin M., Favata F., Moraux E., Pont F., 2007, MNRAS, 375, 29
- Baraffe et al. (1998) Baraffe I., Chabrier G., Allard F., Hauschildt P.H., 1998, A&A, 337, 403
- Baraffe et al. (2002) Baraffe I., Chabrier G., Allard F., Hauschildt P.H., 2002, A&A, 382, 563
- Bender et al. (2005) Bender C., Simon M., Prato L., Mazeh T., Zucker S., 2005, AJ, 129, 402
- Blecha et al. (2000) Blecha A., Cayatte V., North P., Royer F., Simond G., 2000, in Proc. SPIE vol 408, p. 467-474, Optical and IR Telescope Instrumentation and Detectors, Eds. M. Iye, A.F. Moorwood
- Bouchy et al. (2005) Bouchy F., Pont F., Melo C., Santos N.C., Mayor M., Queloz D., Udry S., 2005, A&A, 431, 1105
- Burrows et al. (1997) Burrows A. et al., 1997, ApJ, 491, 856
- Chabrier & Baraffe (1997) Chabrier G., Baraffe I., 1997, A&A, 327, 1039
- Chabrier et al. (2000) Chabrier G., Baraffe I., Allard F., Hauschildt P., 2000, ApJ, 542, 464
- Claret (2004) Claret A., 2004, A&A, 428, 1001
- Cohen & Kuhi (1979) Cohen M., Kuhi L.V., 1979, ApJS, 41, 743
- Covino et al. (2001) Covino E., Melo C., Alcalá J.M., Torres G., Fernández M., Frasca A., Paladino R., 2001, A&A, 375, 130
- Covino et al. (2004) Covino E., Frasca A., Alcalá J.M., Paladino R., Sterzik M.F., 2004, A&A, 427, 637
- Dahm & Hillenbrand (2007) Dahm S.E., Hillenbrand L., 2007, AJ, 133, 2072
- D’Antona & Mazzitelli (1997) D’Antona F., Mazzitelli I., 1997, Mem. Soc. Astron. Ital., 68, 807
- D’Antona & Mazzitelli (1998) D’Antona F., Mazzitelli I., 1998, ASP Conf. Series 134, p. 442, Brown dwarfs and extrasolar planets, eds. R. Rebolo, E.L. Martin, M.R. Zapatero Osorio
- Delfosse et al. (2000) Delfosse X., Forveille T., Ségransan D., Beuzit J.-L., Udry S., Perrier C., Mayor M., 2000, A&A, 364, 217
- Etzel (1981) Etzel P.B., 1981, in Carling E. B., Kopal Z., eds, Photometric and Spectroscopic Binary Systems, NATO ASI Ser. C., 69. Kluwer, Dordrecht, p. 111
- Getman et al. (2005) Getman K.V., et al., 2005, ApJS, 160, 319
- Girardi et al. (2000) Girardi L., Bressan A., Bertelli G., Chiosi C., 2000, A&AS, 141, 371
- Gustafsson et al. (2003) Gustafsson B., Edvardsson B., Eriksson K., Mizuno-Wiedner M., Jørgensen U.G., Plez B., 2003, in ASP Conf. Series vol 288, p. 331, Stellar Atmosphere Modeling, Eds. I. Hubeny, D. Mihalas, K. Werner
- Hebb et al. (2006) Hebb L., Wyse R.F.G., Gilmore G., Holtzman J., 2006, AJ, 131, 555
- Herbst et al. (2002) Herbst W., Bailer-Jones C.A.L., Mundt R., Meisenheimer K., Wackermann R., 2002, A&A, 396, 513
- Hillenbrand (1997) Hillenbrand L., 1997, AJ, 113, 1733
- Hinkle et al. (2002) Hinkle K.H., et al., 2002, Proc. SPIE 3354, 810
- Hodgkin et al. (2006) Hodgkin S.T., Irwin J.M., Aigrain S., Hebb L., Moraux E., Irwin M.J., 2006, AN, 327, 9
- Honeycutt (1992) Honeycutt R.K., 1992, PASP, 104, 435
- Irwin et al. (2006) Irwin J., Aigrain S., Hodgkin S., Irwin M., Bouvier J., Clarke C., Hebb L., Moraux E., 2006, MNRAS, 370, 954
- Irwin et al. (2007) Irwin J., Irwin M., Aigrain S., Hodgkin S., Hebb L., Moraux E., 2007, MNRAS, 375, 1449
- Jones & Walker (1988) Jones B.F., Walker M.F., 1988, AJ, 95, 1755
- Lane et al. (2001) Lane B.F., Boden A.F., Kulkarni S.R., 2001, ApJ, 551, 81
- Leggett (1992) Leggett S.K., 1992, ApJS, 82, 351
- Lopez-Morales (2004) Lopez-Morales M., 2004, Ph.D Thesis, University of North Carolina
- Lopez-Morales et al. (2006) Lopez-Morales M., Orosz J.A., Shaw J.S., Havelka L., Arevalo M.J., McIntyre T., Lazaro, C. , 2006, ApJ, submitted (astro-ph/0610225)
- Lucy (1967) Lucy L.B., 1967, Zeitschrift für Astrophysik, 65, 89
- Mazeh et al. (2002) Mazeh T., Prato L., Simon M., Goldberg E., Norman D., Zucker S., 2002, ApJ, 564, 1007
- Mullan & MacDonald (2001) Mullan D.J., MacDonald J., 2001, ApJ, 559, 353
- Nelson & Davis (1972) Nelson B., Davis W.D., 1972, ApJ, 174, 617
- Palla & Stahler (1999) Palla F., Stahler S.W., 1999, ApJ, 525, 772
- Palla et al. (2007) Palla F., Randich S., Pavlenko V., Flaccomio E., Pallavicini R., 2007, ApJ, 659, 41
- Pont et al. (2005) Pont F., Bouchy F., Melo C., Santos N.C., Mayor M., Queloz D., Udry S., 2005, A&A, 438, 1123
- Popper & Etzel (1981) Popper D.M., Etzel P.B., 1981, AJ, 86, 102
- Press et al. (1992) Press W. H., Teukolsky S. A., Vetterling, W. T., Flannery B. P., 1992, Numerical Recipes in Fortran 77: The Art of Scientific Computing. Cambridge Univ. Press, Cambridge, p. 402
- Rebull et al. (2006) Rebull L.M., Stauffer J.R., Megeath S.T., Hora J.L., Hartmann L., 2006, ApJ, 646, 297
- Ségransan et al. (2003) Ségransan D., Kervella P., Forveille T., Queloz D., 2003, A&A, 397, 5
- Sicilia-Aguilar et al. (2005) Sicilia-Aguilar A., et al., 2005, AJ, 129, 363
- Siess et al. (1997) Siess L., Forestini M., Dougados C., 1997, A&A, 324, 556
- Siess et al. (2000) Siess L., Dufour E., Forestini M., 2000, A&A, 358, 593
- Simon & Sturm (1994) Simon K.P., Sturm E., 1994, A&A, 281, 286
- Southworth et al. (2004a) Southworth J., Maxted P.F.L., Smalley B., 2004, MNRAS, 351, 1277
- Southworth et al. (2004b) Southworth J., Zucker S., Maxted P.F.L., Smalley B., 2004, MNRAS, 355, 986
- Southworth et al. (2005) Southworth J., Smalley B., Maxted P.F.L., Claret A., Etzel P.B., 2005, MNRAS, 363, 529
- Stassun et al. (1999) Stassun K.G., Mathieu R.D., Mazeh T., Vrba F.J., 1999, AJ, 117, 2941
- Stassun et al. (2002) Stassun K.G., van den Berg M., Mathieu R.D., Verbunt F., 2002, A&A, 382, 899S
- Stassun et al. (2004) Stassun K.G., Mathieu R.D., Vaz L.P.R., Stroud N., Vrba F.J., 2004, ApJS, 151, 357
- Stassun et al. (2006) Stassun K.G., Mathieu R.D., Valenti J.A., 2006, Nature, 440, 311
- Stassun et al. (2007) Stassun K.G., Mathieu R.D., Valenti J.A., 2007, ApJ, accepted (astro-ph/0704.3106)
- Tonry & Davis (1979) Tonry J., Davis M., 1979, AJ, 84, 1511
- Tody (1993) Tody D., 1993, in ASP Conf. Series, Vol 52, p. 173, Astronomical Data Analysis Software and Systems II, eds. R.J. Hanisch, R.J.V. Brissenden, J. Barnes
- Yi et al. (2001) Yi S., Demarque P., Kim Y.-C., Lee Y.-W., Ree C.H., Lejeune T., Barnes S., 2001, ApJS, 136, 417