11email: B. Stelzer, stelzer@astropa.unipa.it
X-ray detection of the substellar twin 2MASS J11011926-7732383 AB
Abstract
Context. 2MASS J11011926-7732383 AB (hereafter 2M 1101 AB), located in the Cha I star forming region, is a rare wide-separation brown dwarf binary. Being spatially resolvable in many wavebands, it is a unique target for studying the properties of substellar twins.
Aims. Here, we exploit the coeval pair 2M 1101 AB to examine the influence of physical parameters (mass, bolometric luminosity and effective temperature) on X-ray emission from substellar objects.
Methods. We determine the X-ray properties of 2M 1101 A and B using XMM-Newton and Chandra observations.
Results. The spatial resolution of XMM-Newton is not sufficient to separate contributions from the two components in the binary. The X-ray source detected with XMM-Newton has a column density compatible with the infrared extinction of component A. On the other hand, the binary is resolved with Chandra, and the bulk of the X-ray emission is clearly associated with the photospherically cooler component B. These apparently contradictory results point at strong variability of 2 M1101’s X-ray emission. Combined with previous sensitive X-ray observations from low-mass members of Cha I, we find a decline of X-ray luminosity with decreasing (sub)stellar mass that is typical for star forming regions.
Conclusions. 2M 1101 B is the coolest (spectral type M8.25) and least massive brown dwarf of Cha I detected in X-rays so far. It is also among the youngest ( Myr) substellar Cha I members, and therefore relatively luminous. Most bona fide brown dwarfs of Cha I have remained below the sensitivity limits of available X-ray observations, because of their low luminosity associated with higher age.
Key Words.:
X-rays: stars – stars: coronae, activity, brown dwarfs, pre-main sequence, individual: 2MASS J 11011926-7732383 AB1 Introduction
The binary brown dwarf 2MASS J11011926-7732383 AB (hereafter 2M 1101) was discovered by Luhman (2004b) during a search for substellar objects in the Cha I star forming region. Upon its discovery it was the first known wide brown dwarf binary, and as such it constitutes an important discriminant for the formation mechanisms of brown dwarfs: the wide binary separation of (corresponding to AU at the distance of pc; Whittet et al., 1997; Wichmann et al., 1998) practically excludes the ejection scenario that predicts a maximum separation of AU for substellar binaries expelled from a multiple system without being disrupted (Bate et al., 2002).
According to Luhman (2004b), the two components in the 2M1101 system have spectral types M7.25 and M8.25, and bolometric luminosities of and , respectively. Fig. 1 shows the position of 2M 1101 in the HR diagram, together with other low-mass Cha I members from the catalogs of Luhman (2004a) and Comerón et al. (2004). The 2M1101 binary (large filled circles in Fig. 1) is coeval with an age of Myr on the evolutionary tracks by Chabrier et al. (2000). The probability for the two being a chance projection has been estimated by Luhman (2004b) to be extremely low (). The individual masses of the two components according to the Chabrier et al. models are and for 2M 1101 A and B, respectively, well below the transition to the substellar regime. The physical parameters of 2M 1101 are summarized in Table 1.

| Component | SpT | ||||
|---|---|---|---|---|---|
| [K] | [] | [mag] | [mag] | ||
| A | M7.25 | ||||
| B | M8.25 | ( | () | ||
| (1) from using the extinction law of Rieke & Lebofsky (1985). | |||||
Evidently, 2M 1101 is a unique target for studying the properties of substellar twins, i.e. coeval brown dwarfs of slightly different effective temperature, luminosity, and mass. Its wide separation allows to resolve the two components with present-day instrumentation in many wavelength regimes, including the soft X-ray band.
X-ray emission from late-type stars is a well-known signature of magnetic activity (Rosner et al., 1985). Young pre-main sequence (pre-MS) stars show much higher levels of X-ray luminosity than evolved stars in open clusters and in the field (e.g. Feigelson & Montmerle, 1999). The empirical saturation level for the X-ray luminosity of active stars is , but for given the spread reaches about dex below this threshold. According to recent observations the relation seems to hold even in the substellar mass regime (Preibisch et al., 2005b; Grosso et al., 2007).
The universality of the relation can not be taken for granted, especially in view of the fact that pre-MS stars as well as brown dwarfs are fully convective and the standard solar-like -dynamo, which requires a transition between a radiative and a convective layer, is not expected to work. Alternative field generating mechanisms involving turbulence have been invoked to explain X-ray emission from the fully convective lowest mass stars at the bottom of the MS and from brown dwarfs (Durney et al., 1993). The effects of a change in the dynamo mechanism are both difficult to predict and observationally poorly constrained. While there is consensus that the X-ray luminosity declines towards the substellar boundary, it is unclear which role different physical parameters besides (e.g. rotation, effective temperature, mass, age, binarity) play in the efficiency of X-ray production. Especially, the effective temperature might be crucial as it determines the ionization state of the atmosphere. Mohanty et al. (2002) have argued that the electrical resistivity in the nearly neutral atmospheres of very low-mass (VLM) dwarfs may be enhanced to the point that no efficient coupling of matter and magnetic field is possible, preventing magnetic activity. A possible direct dependence between X-ray luminosity and has recently been pointed out by Stelzer et al. (2006).
Whatever is the origin of the relation, it ensues that the chance for an X-ray detection is higher for young brown dwarfs than for less luminous evolved ones. Indeed, in recent years deep X-ray observations with Chandra and XMM-Newton in star forming regions have turned up an increasing number of X-ray detections among young brown dwarfs (e.g. Preibisch et al., 2005b; Grosso et al., 2007).
Cha I is relatively nearby, and therefore it was among the first star forming regions with a well-defined brown dwarf population. For the median age of Cha I members ( Myr), the substellar limit corresponds to spectral type M6 to M6.5 (Baraffe et al., 1998). The sample of brown dwarfs and candidate brown dwarfs in Cha I identified in an H emission line survey (Comerón et al., 2000), yielded the first X-ray detection of a substellar object with ROSAT (Neuhäuser & Comerón, 1998). In a more recent XMM-Newton observation of the southern part of Cha I, that includes all H emitting brown dwarfs and brown dwarf candidates from the survey of Comerón et al. (2000), the X-ray detection fraction for the faint “ChaH” objects was increased from to thanks to the higher sensitivity and higher spatial resolution of XMM-Newton with respect to ROSAT (Stelzer et al., 2004). Further X-ray studies with Chandra and XMM-Newton concentrating on the northern part of the Cha I cloud have been presented by Feigelson & Lawson (2004) and Robrade & Schmitt (2007).
The X-ray detected and non-detected objects from these surveys are distinguished by different plotting symbols in Fig. 1 (see figure caption). They have been placed in the HR diagram using the effective temperatures and luminosities given by Luhman (2004b). With respect to previous estimates for the physical parameters, some of the objects that used to be considered brown dwarfs have now moved across the substellar boundary into the stellar domain; see Sect. 4 for more details. It is evident from Fig. 1 that the X-ray detection rate beyond the substellar boundary is rather low. According to Luhman’s compilation of physical parameters and the Chabrier et al. (2000) models, only three bona-fide brown dwarfs and two objects at the border line were detected in X-rays: ChaH 1, ChaH 7, CHSM-17173, ISO-217, and ESOH566. On the other hand, all Cha I members with that were in the field-of-view of one of the above-mentioned X-ray observations were detected.
All three X-ray detected bona-fide brown dwarfs in Cha I seem to be very young, located above the Myr isochrone. The two components of the binary 2M1101 AB have similarly young age and bracket ChaH 1, ChaH 7, and CHSM-17173 in terms of mass and effective temperature. Here we discuss recent Chandra and XMM-Newton observations of 2M 1101. The observations and data analysis are described in Sect. 2, and Table 2 provides the observing log. While XMM-Newton provides higher collecting area, only Chandra has the potential to separate the binary and to compare the X-ray properties of the two components of this benchmark substellar twin. The X-ray properties of 2M 1101 A and B are discussed in Sect. 3. In Sect. 4 the results are combined with the published X-ray data for other low-mass Cha I members. This allows us to investigate the dependence of on physical parameters such as bolometric luminosity, effective temperature and mass for the brown dwarf population in Cha I, and to compare it to similar studies in the Orion and Taurus star forming regions.
| Mission/Instrum. | XMM/EPIC-pn | Chandra/ACIS-S |
|---|---|---|
| Target | Cha I Field G | 2M 1101-7732 |
| PI | M.Güdel | B.Stelzer |
| Obs-ID | 0152460301 | 6396 |
| Date [UT] | 2002-04-09@09:39:20 | 2006-05-15@04:36:46 |
| Exposure [ksec] | 34 | 40 |
2 Observations and Data Analysis
2.1 Chandra
2M 1101 was observed for ksec with
Chandra’s Advanced CCD Imaging Spectrometer for Spectroscopy
(ACIS-S); see Weisskopf et al. (2002) for details on the satellite and its instruments.
The data analysis was carried out using the CIAO software
package111CIAO is made available by the CXC and can be downloaded
from
http://cxc.harvard.edu/ciao/download-ciao-reg.html version 3.3.0.1.
We started our analysis with the level 1 events file provided by the
Chandra X-ray Center (CXC).
In the process of converting the level 1 events file to a level 2 events file
we performed the following steps.
A correction for the charge transfer inefficiency has been applied.
We removed the pixel randomization which is automatically applied by the CXC pipeline
in order to optimize the spatial resolution.
We filtered the events file for event grades
(retaining the standard ASCA grades , , , , and ),
and applied the standard good time interval (GTI) file.
Events flagged as cosmic rays
were retained after inspection of the images revealed that a substantial
number of source photons erroneously carry this flag.
Since the positional accuracy is particularly
important to our observation we also checked the astrometry for any known
systematic aspect offset using the CIAO aspect
calculator222see http://asc.harvard.edu/ciao/threads/arcsec_correction .
This tool confirms that no offset larger than is present.
Source detection was performed with the wavdetect algorithm (Freeman et al., 2002) on an image with pixel size centered on the position of the primary 2M 1101 A and excluding photons with energy outside the keV band. wavdetect correlates the data with a mexican hat function to search for deviations from the background. This method is well suited for separating closely spaced point sources. We used wavelet scales between and in steps of .
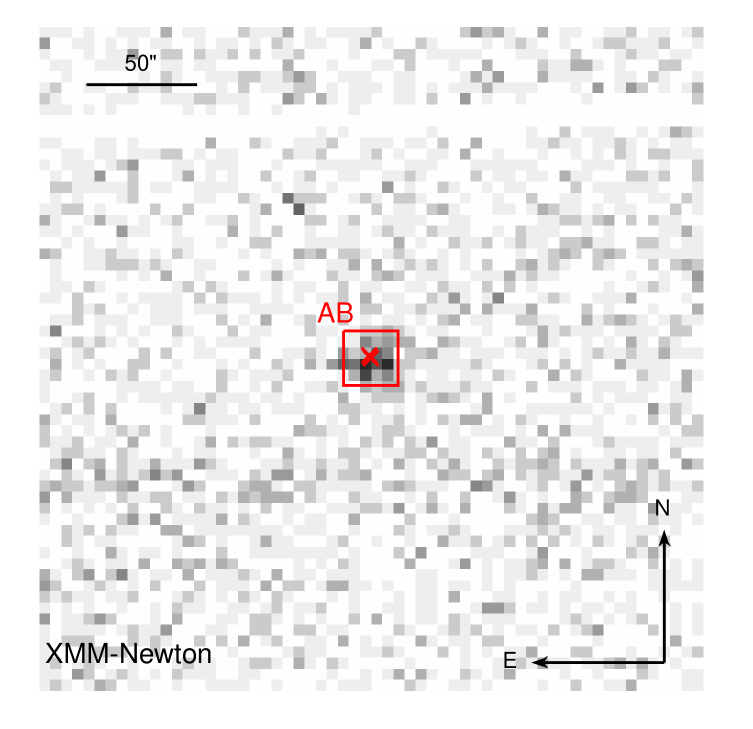
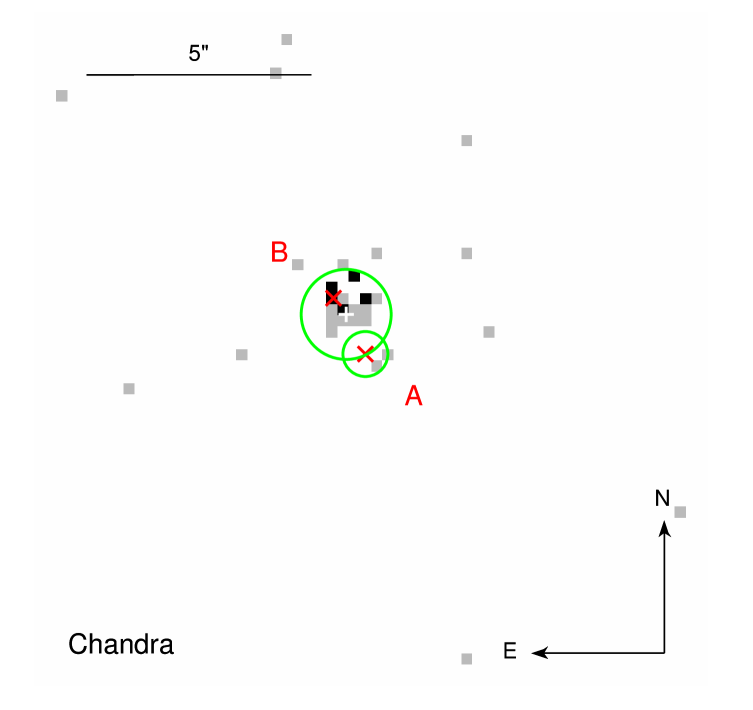
We detect one X-ray source at the position of the binary. Despite an obvious offset with respect to the near-IR position (Fig. 2), we are confident that this source can be identified with component B. This assertion is supported by a check of the astrometry using the only other nearby X-ray star in the field; for details see Sect. 3. There is no detected source associated with 2M 1101 A, but a possible enhancement of the count rate may evidence weak X-ray emission from this component.
For further analysis we extracted photons assigned to 2M 1101 B from a circular region of radius centered on the X-ray position. That area includes % of the PSF. Photons assigned to 2M 1101 A are extracted from a circular region of radius centered on its near-IR position. This latter region includes % of the PSF. We note, that the extraction areas of components A and B overlap, but there are no photons in the overlapping region; cf. Fig. 2. The background is very low (cf. Sect. 3) and can be neglected.
2.2 XMM-Newton
2M 1101 is in the field-of-view of a 30 ksec XMM-Newton333The satellite and its instruments are described in a Special Issue of A&A (2001, vol.365). observation. We extracted the data taken with the European Photon Imaging Camera pn CCD (EPIC/pn) from the XMM-Newton archive. The observations were performed in full-frame mode employing the medium filter.
Starting from the pipeline products, we filtered the events file for pixel patterns (retaining only singles and doubles), edge effects at the boundary of individual CCD chips, events outside the field-of-view, and near bad pixels. We also eliminated the lowest pulse height channels to further reduce the noise. We searched for times of high background by selecting the uncontaminated time intervals with a filter that maximizes the signal-to-noise as a function of the count rate across the whole detector array and the exposure time. The data turned out to be widely unaffected by background flaring, with the exception of a brief time interval near the middle of the observation that was removed from the GTIs. This way the effective observing time is reduced to ksec. In the subsequent analysis only photons that arrived within the GTIs were considered.
2M 1101 AB is clearly detected, but as the spatial resolution of EPIC is well above the binary separation, the two components can not be resolved (see Fig. 2). We extracted source photons from a circle with radius around the position of 2M 1101 A. According to the XMM-Newton User’s Handbook444see http://xmm.vilspa.esa.es/external/xmmusersupport/documen- tation/uhb/XMMUHB.html this radius comprises % encircled energy. Background photons were extracted from two circles positioned on the same CCD chip, at the same distance from the read-out node as the source extraction area and avoiding the read-out strip of a nearby bright X-ray source. For the spectral analysis we generated a response matrix and ancilliary response file using standard XMM-Newton Science Analysis System tools. The spectrum was binned to a minimum of counts per bin and analysed in the XSPEC v.11.3.0 environment.
3 Results
| Component | Net Counts(2,3) | Net Rate(2,3) | (d.o.f.) | ||||||
| [′′] | [cts/s] | [] | [keV] | [] | [erg/s] | ||||
| XMM-Newton EPIC/pn | |||||||||
| A+B | 29.0 | ||||||||
| (f) | 29.3 | ||||||||
| (q) | 28.8 | ||||||||
| Chandra ACIS-S(5) | |||||||||
| A | |||||||||
| B | |||||||||
| (1) Error of the offset derived from the uncertainty of the X-ray position is for ACIS; | |||||||||
| (2) in [0.5,8.0] keV; | |||||||||
| (3) errors are computed using the Gehrels description (). | |||||||||
| (4) fluxes and luminosities are corrected for encircled PSF fraction and for absorption; the upper limit is based on the % confidence value | |||||||||
| derived as described in the text. | |||||||||
| (5) Numbers preceeded by ‘=’ are assumed values, see text. | |||||||||
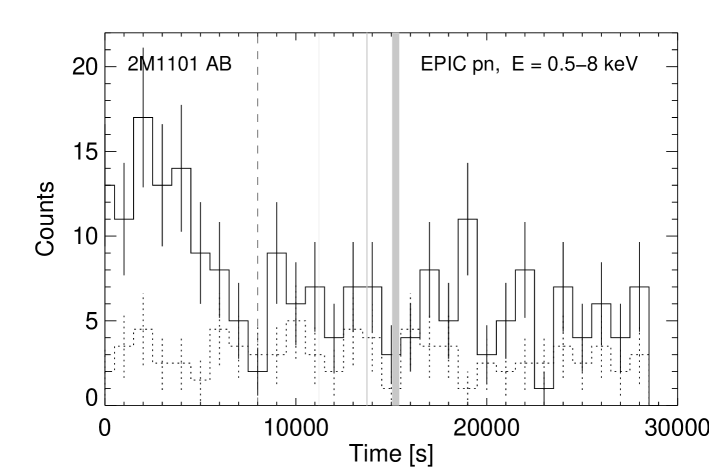
We begin the discussion of the results with the XMM-Newton data, where the statistics are higher. The EPIC/pn lightcurve extracted from the position of 2M 1101 AB is shown in Fig. 3 together with the area-scaled background lightcurve. A phase of enhanced source signal at the beginning of the observation is distinguished. The background is constant throughout the observation, and can not be responsible for this flare-like feature. A Kolmogorov-Smirnov (KS) test for the source+background lightcurve yielded a probability for variability %, while no significant variability is detected with the KS test in the background-only lightcurve. The mean net source count rate of the combined emission from 2M 1101 AB measured with EPIC/pn is given in Table 3. We further split the observation in a flaring and a quiescent part; the dividing line is indicated in Fig. 3. Net source count rates for the two activity states are also listed in Table 3.
The time-averaged EPIC/pn spectrum is displayed in Fig. 4. Albeit stellar coronae are known to be composed of a multi-temperature plasma, in the case of poor statistics the X-ray spectra are often approximated fairly well by a one-temperature thermal model describing a plasma in collisional ionization equilibrium with a photoabsorption term (e.g. Getman et al., 2005). We adopt the apec code (Smith et al., 2001) with the wabs absorption as implemented in XSPEC (v.11.3). For the elemental abundances of the X-ray emitting plasma we use the values presented by Maggio et al. (2007). This set of abundances was determined from fitting the X-ray spectra of a sample of X-ray bright pre-MS stars in Orion. The major deviation with respect to photospheric abundances (e.g. Anders & Grevesse, 1989; Asplund et al., 2005) is the low iron abundance and the high Ne/Fe ratio, a pattern that has repeatedly been found in stellar coronae (see e.g. review by Güdel, 2004). The bestfit of such a model to the observed time-averaged EPIC/pn spectrum of 2M 1101 AB has with degrees of freedom. The bestfit parameters for average, flaring and quiescent spectrum are listed in Table 3. During the phase of high activity at the beginning of the observation the temperature is higher than during the following quiescent phase (although not statistically significant), as is typical for stellar flares.
The spectral fit of the time-averaged EPIC/pn spectrum yields an absorbing column (cf. Table 3) that corresponds to a near-IR extinction mag using the gas-to-dust conversion law derived by Vuong et al. (2003) for pre-MS stars in Oph. This range of includes both the observational % error of and the uncertainty in the relation. The near-IR extinction estimated this way is consistent with the observed of 2M 1101 A but higher than the value of 2M 1101 B (cf. Table 1). This result suggests that the emission is dominated by component A.

Obviously, there is no way to separate the contributions of 2M 1101 A and B to the X-ray spectrum and lightcurve observed with XMM-Newton, and we resort to the Chandra data where the two components can be resolved. Contrary to the preliminary conclusion from the XMM-Newton spectrum, the secondary, 2M 1101 B, is much closer to the X-ray source detected with wavdetect than the primary, 2M 1101 A. Fig. 2 suggests a shift of the X-ray image with respect to the near-IR positions in the south-west direction. Other than centering the X-ray source onto the position of 2M 1101 B, such a shift would clearly identify 2M 1101 A with the nearby ‘cluster’ of two photons. The image can not be checked for a systematic boresight error because there is not a sufficient number of X-ray bright sources with optical/IR counterparts. However, another X-ray emitting Cha I member (CS Cha) is nearby ( off-axis). We compared the position of the corresponding X-ray source to the optical position of CS Cha, and found an offset of only . Therefore, we are confident that no significant shifts are present in the X-ray image.
With a total of net counts in the extraction area the Chandra source associated with 2M 1101 B is too weak for spectral analysis. However, some information can be gained from Fig. 5, where we plot the energy versus the arrival time of the individual photons in the extraction circle of 2M 1101 B.

The source has a remarkably hard spectrum, with more than half of the photons having energies in excess of keV. The median photon energy of 2M 1101 B in the keV band is keV, where the uncertainty was estimated with the Maritz-Jarrett method as described by Hong et al. (2004). From nearby source free regions we estimate that the expected number of background photons in the extraction area of 2 M1101 B is only in the keV interval. Therefore, the background can be neglected in the evaluation of the flux in this energy band.
Clearly, the detection of photons with energies between keV from 2M 1101 A is significantly higher than the number of contaminating photons from the X-ray source associated with component B. The source extraction area of 2M 1101 A comprises % of all photons in the PSF of 2M 1101 B, i.e. photons. There are background counts expected for the same energy band in the extraction area of 2M 1101 A. Considering further the fact that the two photons are coincident with the position of 2M 1101 A, they probably both originate from this brown dwarf. Nevertheless, local fluctuations of the background can not be excluded, and we prefer to assign an upper limit to the count rate of this component. The “observed” number of photons from 2M 1101 A extrapolated across the full PSF is counts. Using the prescription by Kraft et al. (1991) for Poisson-distributed counting data we derive a % confidence upper limit of counts for 2M 1101 A.
The source fluxes of 2M 1101 A and B given in Table 3 were evaluated with PIMMS555The Portable Interactive Multi-Mission Simulator (PIMMS) is accessible at http://asc.harvard.edu/toolkit/pimms.jsp on basis of their individual near-IR extinctions and the temperature of keV from the EPIC/pn spectrum. The sum of the fluxes of both components estimated this way from the Chandra observation is almost a factor below the time-averaged XMM-Newton flux, and a factor of below the quiescent XMM-Newton flux. If instead the value measured from the EPIC/pn spectrum is adopted for the spectral model in PIMMS, the combined ACIS-S flux of 2M 1101 A and B increases by a factor of . Source variability may be in part responsible for the remaining discrepancy with respect to the XMM-Newton flux.
Indeed, in Fig. 5 there is a striking absence of photons between ksec from the start of the observation. To quantify the suspicion of source variability we applied a test proposed by Preibisch & Zinnecker (2002): First, we determine the time interval in which photons are expected to be detected under the assumption of a constant signal corresponding to the time averaged count rate. Then, the maximum number of counts in any such interval across the observation is computed. The Poisson probability that is a statistical fluctuation is given by . We find . Therefore, 2M 1101 B was probably variable during the Chandra observation.
4 Discussion
4.1 Comparison of XMM-Newton and Chandra results
At first sight, the Chandra detection of the secondary component and the non-detection (or extreme weakness) of the primary in the 2M 1101 system seems to contradict the relation. However, one must take account of the fact that the X-ray photons are subject to absorption. Luhman (2004b) measured negligible extinction for 2M 1101 B but mag for 2M 1101 A. If we assume that both objects have the same X-ray flux and spectrum with temperature of keV, we can estimate the effect of the absorbing column onto the observed spectrum. With PIMMS we found that the count rate of the unabsorbed () X-ray source 2M 1101 B corresponds to a flux of . If the column density was (equivalent to the observed of 2M1101 A), a total of counts would be expected in the extraction area of 2M 1101 A, in contrast to the counts observed. In order to shrink the count rate to the observed level, both a lower temperature ( keV) and a higher extinction () must be hypothesized for 2M 1101 A. This is, however, unconsistent with the XMM-Newton spectrum. We conclude, that during the Chandra observation the X-ray flux of 2M 1101 A was significantly lower than that of the photospherically cooler secondary 2M 1101 B.
Furthermore, the XMM-Newton spectrum suggests that the dominant X-ray emitter during the XMM-Newton observation was 2M 1101 A, while during the Chandra observation clearly the dominant X-ray emitter was 2M 1101 B, and consequently both objects must be strongly variable in X-rays. Using the results given in Table 3 this leads to the conclusion that the combined X-ray luminosity of 2M 1101 AB can vary by at least a factor of . An alternative interpretation is that the dominant X-ray emitter was 2M 1101 B during both observations but its is higher than the near-IR value. In this latter case, the Chandra flux can be estimated using the obtained from the XMM-Newton spectrum. This flux is , a factor of two higher than for negligible extinction. However, it is still a factor of seven lower than the XMM-Newton flux. Therefore, in this scenario the X-ray emission of 2M 1101 B, again, must be variable. Furthermore, the value from the XMM-Newton spectrum corresponds to a near-IR extinction of mag, and this would shift 2M 1101 B upward in the HR diagram. As a consequence, it would no longer be coeval with 2M 1101 A, an unlikely scenario.
We caution that the above considerations rely on the gas-to-dust extinction law presented by Vuong et al. (2003). Deviations from the standard extinction law have been seen in other samples of young stars (cf. Feigelson et al., 2005). Such discrepancies can arise from errors in the X-ray spectral model or in the photometry, or they may represent untypical environmental conditions.
4.2 X-ray emission from brown dwarfs in Cha I
To put 2M 1101 A and B into the context of the X-ray properties of low-mass stars, we revisit published X-ray data for the Cha I star forming region. Studies of the X-ray population of Cha I with XMM-Newton and Chandra have been presented by Stelzer et al. (2004), Feigelson & Lawson (2004), and Robrade & Schmitt (2007). We resume here the results on the VLM stars and brown dwarfs based on the membership catalog of Luhman (2004a) with additional members discovered by Comerón et al. (2004). Previous estimates for the physical parameters had placed some of the objects which now appear to be stars into the brown dwarf regime. This was due to a combination of (i) slightly different spectral types assigned, (ii) a different SpT / conversion and (iii) the use of other evolutionary models. Luhman (2004a) has shown that for the Cha I population the models by Baraffe et al. (1998) and Chabrier et al. (2000) provide the best agreement with observational constraints, including higher-mass T Tauri stars up to . We use these models and the physical parameters from Luhman (2004a) and Comerón et al. (2004), to estimate individual masses for all X-ray detected Cha I members from the above-mentioned publications.
Then we re-inspected these X-ray source lists for consistency with the updated membership list. Upper limits for non-detections were not discussed in the X-ray surveys, and we will not consider them here. The assessment of upper limits is difficult because of their dependence on the spectral shape and, more importantly, the (unknown) extinction. We verified that, for the observations discussed here, these upper limits range roughly between and . All X-ray detected Cha I members are included in the X-ray catalogs. For the faint objects from Robrade & Schmitt (2007), we computed from the listed count rates and conversion factor, assuming a distance of pc. The examined fields include detected and undetected Cha I members. All non-detections have masses below , i.e. the X-ray census in Cha I is complete down to this limit, at least in the area surveyed so far which comprises the central star forming sites.
For the Orion Nebula Cluster (ONC) it was shown that, next to intrinsically low X-ray flux, high extinction is one of the causes why even deep exposures may fail to register X-rays from (sub)stellar objects (Preibisch et al., 2005a). The cumulative number distribution of the band extinction, , is shown in Fig. 6 for all X-ray observed Cha I members. The distribution of X-ray detections and non-detections is undistinguishable, as we verified in -sample tests implemented in ASURV666The Astrophysical SURVival analysis package is available at the astrostatistics site at Penn State University; see also Lavalley et al. (1992).. In the sub-sample of probable brown dwarfs (spectral type M6) there is also no significant distinction between X-ray detected and undetected ones in terms of , such that the non-detection of brown dwarfs is probably due to their intrinsically weak emission.

As mentioned in Sect. 1, prior to the study presented here, only three bona-fide brown dwarfs of Cha I had been detected in X-rays: ChaH 1 and 7 (Stelzer et al., 2004) and CHSM-17173 (Robrade & Schmitt, 2007). We add here the X-ray detection of 2M 1101 B and possibly also 2M 1101 A. With its spectral type of M8.25, 2M 1101 B is the coolest and least massive brown dwarf of Cha I detected in X-rays. Its X-ray luminosity is at the low end of all X-ray detected VLM objects in Cha I, and the upper limit for 2M 1101 A is lower than any of the detections.
Fig. 7 shows the dependence of X-ray emission of the young members in Cha I on mass. The most important features in this diagram are completely consistent with findings in other star forming regions, in particular the ONC and Taurus, and can be summarized like this: (i) The well-known decline of with decreasing mass is seen across the low-mass range (cf. Preibisch et al., 2005a; Telleschi et al., 2007, for the ONC and for Taurus, respectively), and this trend seems to continue into the brown dwarf regime (cf. Preibisch et al., 2005b; Grosso et al., 2007); (ii) there is no dependence of on mass; (iii) for given mass a considerable ( dex) spread in X-ray luminosity and is observed. We recall, that the values shown in Fig. 7 are a collection of data obtained with different instruments and different analysis techniques. Nevertheless, there seem not to be very significant systematic shifts of the X-ray luminosities measured in the three different studies. In particular, the fields analysed by Feigelson & Lawson (2004) and Robrade & Schmitt (2007) partially overlap. Most stars common to both fields show typical differences of a factor of two, which can be explained by the different energy bands in which the X-ray luminosity was measured: For a keV spectrum with , the keV band used by Feigelson & Lawson (2004) includes roughly half the flux of the keV band used by Robrade & Schmitt (2007). The X-ray fainter objects remain undetected in the XMM-Newton pointing, because at a similar effective exposure time of ksec Chandra is more sensitive due to its low background. An extensive investigation of the X-ray census in Cha I is beyond the scope of this paper. Such a study is underway (Telleschi et al., in prep.), and we do not elaborate on this issue here.


In Fig. 8 the fractional X-ray luminosities of the VLM stars and brown dwarfs in Cha I are complemented with equivalent objects in Taurus and the ONC. Similar plots have been presented individually for the ONC (Preibisch et al., 2005a) and for Taurus (Grosso et al., 2007). The samples in these three star forming regions show that young substellar objects can emit as much X-rays as higher-mass T Tauri stars with respect to their bolometric luminosity, with the most active objects emitting near the saturation limit of . In other words, the efficiency of the dynamo and the manifestation of activity phenomena show no break down to spectral type M8 for objects of a few Myrs age. This is in agreement with recent mean field dynamo models by Chabrier & Küker (2006) that predict large-scale fields in fully convective objects, no matter whether they are stars or brown dwarfs, despite the absence of differential rotation in these objects. The X-ray observations of young brown dwarfs suggest, that the supposed decline of X-ray emission with decreasing atmospheric temperature due to the decoupling of plasma and field sets in at spectral types later than M8 for young ages, i.e. for K, consistent with the temperature range where the electrical resistivity is predicted to decline rapidly Mohanty et al. (2002). Previous evidence for a connection between the X-ray emission level from brown dwarfs and regarded more evolved ultracool dwarfs that have effective temperatures below K (Stelzer et al., 2006), and they present no contradiction to the picture drawn above for young substellar objects.
Despite the obvious ability to maintain high fractional X-ray luminosities, the X-ray detections of young brown dwarfs reported so far represent only the tip of the iceberg. The bona-fide brown dwarfs in Cha I from published Chandra and/or XMM-Newton observations are summarized in Table 4. All Cha I brown dwarfs detected in X-rays so far are located on or above the Myr isochrone, and a similar tendency is obvious in Taurus and the ONC, where mostly the very young, and consequently very luminous VLM stars and brown dwarfs have been detected in X-rays (Preibisch et al., 2005b; Grosso et al., 2007). With the exception of 2M 1101 A, the undetected brown dwarfs have older ages on the Chabrier et al. (2000) tracks, i.e. lower bolometric luminosity. Since their upper limits to are on average somewhat below the X-ray luminosity of the detections, they are expected to have levels near the range of the X-ray detected brown dwarfs. Therefore, deep X-ray pointings of low-luminosity young brown dwarfs will likely populate the relation with a scatter similar to that observed for higher-mass pre-MS stars, while a shut off of X-ray emission may be expected for young brown dwarfs with temperatures below the ones observed so far.

| Designation | SpT | Mass | Ref∗ | ||
| [] | [yrs] | [erg/s] | |||
| 2M 1101 B | M8.25 | 0.025 | this work | ||
| ChaH1 | M7.75 | 0.035 | S04 | ||
| ChaH7 | M7.75 | 0.035 | S04 | ||
| CHSM 17173 | M8 | 0.041 | F04 | ||
| ESOH566 | M6.5 | 0.08 | R07 | ||
| ISO-217 | M6.25 | 0.081 | S04 | ||
| 2M 1101 A | M7.25 | 0.05 | this work | ||
| ChaH 11 | M7.25 | 0.054 | 7.1 | S04 | |
| ISO-138 | M6.5 | 0.068 | 7.0 | S04 | |
| ChaH 12 | M6.5 | 0.074 | 6.4 | S04 | |
| ChaH 10 | M6.25 | 0.074 | 6.9 | S04 | |
| ∗ References for X-ray luminosity: S04 - Stelzer et al. (2004), | |||||
| F04 - Feigelson & Lawson (2004), R07 - Robrade & Schmitt (2007). | |||||
Acknowledgements.
We acknowledge financial support from ASI/INAF contract I/023/05/0. BS wishes to thank E. Flaccomio for stimulating discussions.References
- Anders & Grevesse (1989) Anders, E. & Grevesse, N. 1989, Geochim. Cosmochim. Acta., 53, 197
- Asplund et al. (2005) Asplund, M., Grevesse, N., & Sauval, A. J. 2005, in ASP Conf. Ser. 336: Cosmic Abundances as Records of Stellar Evolution and Nucleosynthesis, ed. T. G. Barnes, III & F. N. Bash, 25–+
- Baraffe et al. (1998) Baraffe, I., Chabrier, G., Allard, F., & Hauschildt, P. H. 1998, A&A, 337, 403
- Bate et al. (2002) Bate, M. R., Bonnell, I. A., & Bromm, V. 2002, MNRAS, 332, L65
- Chabrier et al. (2000) Chabrier, G., Baraffe, I., Allard, F., & Hauschildt, P. 2000, ApJ, 542, 464
- Chabrier & Küker (2006) Chabrier, G. & Küker, M. 2006, A&A, 446, 1027
- Comerón et al. (2000) Comerón, F., Neuhäuser, R., & Kaas, A. A. 2000, A&A, 359, 269
- Comerón et al. (2004) Comerón, F., Reipurth, B., Henry, A., & Fernández, M. 2004, A&A, 417, 583
- Durney et al. (1993) Durney, B. R., De Young, D. S., & Roxburgh, I. W. 1993, Sol. Phys., 145, 207
- Feigelson et al. (2005) Feigelson, E. D., Getman, K., Townsley, L., et al. 2005, ApJS, 160, 379
- Feigelson & Lawson (2004) Feigelson, E. D. & Lawson, W. A. 2004, ApJ, 614, 267
- Feigelson & Montmerle (1999) Feigelson, E. D. & Montmerle, T. 1999, ARA&A, 37, 363
- Freeman et al. (2002) Freeman, P. E., Kashyap, V., Rosner, R., & Lamb, D. Q. 2002, ApJS, 138, 185
- Getman et al. (2005) Getman, K. V., Flaccomio, E., Broos, P. S., et al. 2005, ApJS, 160, 319
- Grosso et al. (2007) Grosso, N., Briggs, K., Güdel, M., et al. 2007, A&A, 468, 391
- Güdel (2004) Güdel, M. 2004, A&A Rev., 12, 71
- Hong et al. (2004) Hong, J., Schlegel, E. M., & Grindlay, J. E. 2004, ApJ, 614, 508
- Kraft et al. (1991) Kraft, R. P., Burrows, D. N., & Nousek, J. A. 1991, ApJ, 374, 344
- Lavalley et al. (1992) Lavalley, M., Isobe, T., & Feigelson, E. 1992, in ASP Conf. Ser. 25: Astronomical Data Analysis Software and Systems I, ed. D. M. Worrall, C. Biemesderfer, & J. Barnes, 245–+
- Luhman (2004a) Luhman, K. L. 2004a, ApJ, 602, 816
- Luhman (2004b) Luhman, K. L. 2004b, ApJ, 614, 398
- Luhman et al. (2004) Luhman, K. L., Peterson, D. E., & Megeath, S. T. 2004, ApJ, 617, 565
- Maggio et al. (2007) Maggio, A., Flaccomio, E., Favata, F., et al. 2007, ApJ, 660, 1462
- Mohanty et al. (2002) Mohanty, S., Basri, G., Shu, F., Allard, F., & Chabrier, G. 2002, ApJ, 571, 469
- Neuhäuser & Comerón (1998) Neuhäuser, R. & Comerón, F. 1998, Science, 282, 83
- Preibisch et al. (2005a) Preibisch, T., Kim, Y.-C., Favata, F., et al. 2005a, ApJS, 160, 401
- Preibisch et al. (2005b) Preibisch, T., McCaughrean, M. J., Grosso, N., et al. 2005b, ApJS, 160, 582
- Preibisch & Zinnecker (2002) Preibisch, T. & Zinnecker, H. 2002, AJ, 123, 1613
- Rieke & Lebofsky (1985) Rieke, G. H. & Lebofsky, M. J. 1985, ApJ, 288, 618
- Robrade & Schmitt (2007) Robrade, J. & Schmitt, J. H. M. M. 2007, A&A, 461, 669
- Rosner et al. (1985) Rosner, R., Golub, L., & Vaiana, G. S. 1985, ARA&A, 23, 413
- Smith et al. (2001) Smith, R. K., Brickhouse, N. S., Liedahl, D. A., & Raymond, J. C. 2001, ApJ, 556, L91
- Stelzer et al. (2006) Stelzer, B., Micela, G., Flaccomio, E., Neuhäuser, R., & Jayawardhana, R. 2006, A&A, 448, 293
- Stelzer et al. (2004) Stelzer, B., Micela, G., & Neuhäuser, R. 2004, A&A, 423, 1029
- Telleschi et al. (2007) Telleschi, A., Güdel, M., Briggs, K. R., Audard, M., & Palla, F. 2007, A&A, 468, 425
- Vuong et al. (2003) Vuong, M. H., Montmerle, T., Grosso, N., et al. 2003, A&A, 408, 581
- Weisskopf et al. (2002) Weisskopf, M. C., Brinkman, B., Canizares, C., et al. 2002, PASP, 114, 1
- Whittet et al. (1997) Whittet, D. C. B., Prusti, T., Franco, G. A. P., et al. 1997, A&A, 327, 1194
- Wichmann et al. (1998) Wichmann, R., Bastian, U., Krautter, J., Jankovics, I., & Rucinski, S. M. 1998, MNRAS, 301, L39+