MOST photometry and DDO spectroscopy of the
eclipsing (white dwarf + red dwarf) binary V471 Tau111Based
on data from the MOST satellite, a Canadian Space Agency mission
jointly operated by Dynacon Inc., the University of Toronto Institute for
Aerospace Studies and the University of British Columbia, with the
assistance of the University of Vienna, and on data obtained at the
David Dunlap Observatory, University of Toronto.
Abstract
The Hyades K2V+WD system 471 Tau is a prototype post-common envelope system and a likely cataclysmic binary progenitor. We present 10 days of nearly continuous optical photometry by the MOST (Microvariability & Oscillations of STars) satellite and partly simultaneous optical spectroscopy from DDO (David Dunlap Observatory) of the binary. The photometric data indicate that the spot coverage of the K dwarf component was less than observed in the past, suggesting that we monitored the star close to a minimum in its activity cycle. Despite the low spot activity, we still detected seven flare-like events whose estimated energies are among the highest ever observed in V471 Tau and whose times of occurrence do not correlate with the binary orbital phase. A detailed analysis of the times of eclipse over the last years reveals timing variations which could be explained in several ways, including perturbations by an as-yet-undetected third body in the system or by a small orbital eccentricity inducing slow apsidal motion. The DDO spectra result in improved determinations of the K dwarf projected rotation velocity, km s-1, and the orbital amplitude, km s-1. The spectra also allow us to measure changes in emission strength and radial velocity (RV) variations. We measure a larger velocity amplitude than found previously suggesting that the source of the emission in V471 Tau was less concentrated around the sub-white-dwarf point on the K star than had been observed in previous studies.
1 INTRODUCTION
V471 Tau is a close eclipsing binary star () consisting of a hot white dwarf and a red dwarf with an orbital period of 0.521 d. It is a member of the Hyades cluster (Werner & Rauch, 1997) and – very likely – a cataclysmic binary progenitor (Still & Hussain, 2003). V471 Tau has been the subject of numerous investigations over the past 35 years; cf. the main contributions by Skillman & Patterson (1988), Clemens et al. (1992), O’Brien et al. (2001), Ibanoglu et al. (2005) and Hussain et al. (2006).
The V471 Tau system may be the prototype of a post-common envelope binary with a white dwarf and a main sequence star. The mass and radius of both components can be measured with high accuracy, while the K dwarf which is spun up to high rotation rates by tidal forces may be an analogue for rapidly rotating pre-ZAMS stars like AB Dor. Simultaneous precise time-resolved photometry and spectroscopy which cover phases of eclipse in the V471 Tau system can sample the spot coverage of the K dwarf. Eclipse timing can measure apsidal motion in the binary and test whether the system is actually a triple one with a third undetected component. We therefore organized a coordinated campaign of spacebased photometry from the MOST satellite and groundbased spectroscopy from DDO.
2 OBSERVATIONS OF V471 TAU
2.1 MOST photometry
The MOST (Microvariability & Oscillations of STars) space mission (Walker et al., 2003; Matthews et al., 2004) was designed to perform high-precision optical photometry of bright stars with long time coverage and high duty cycle. MOST is equipped with a 15-cm telescope and a custom broadband filter (spectral transmission peak Å and FWHM Å). The polar Sun-synchronous orbit of the satellite allows it to monitor stars in the anti-solar direction for up to 60 days without interruption.
MOST observed V471 Tau for 10.0 days during 4 – 14 December 2005 (in Terrestial Time Julian Days: 2,453,708.5117 – 2,453,718.5122, see below in Section 3.2), covering just over 19 orbital periods of the binary system. The photometry was obtained in MOST’s Direct Imaging mode (Rowe et al., 2006), with a slightly defocused stellar image sampled in a CCD sub-raster. The exposure time was 6.52 s, sampled at 10-s intervals. Two reference stars in the same field (GSC 01252-00692, and GSC 01252-00046, ) were observed simultaneously in the same way to calibrate instrumental or satellite orbital artifacts.
The MOST instrument focal plane can be illuminated by scattered Earth light whose level is modulated by the MOST orbital period of min. The amplitude and complexity of the stray light background variations depend on the season of observing, the location of the target star relative to the bright limb of the Earth and the orientation (roll) of the spacecraft. In the case of the V471 Tau photometry, the periodic fluctuations in background translated into photometric uncertainties in the stellar signal ranging from point-to-point scatter with (about 3 mmag) at stray light minimum to a point-to-point scatter of about at stray light maximum.
The dark and flat field corrections were performed by monitoring individual pixel responses during test exposures on fields empty of stars bright enough to rise above the background. Photometry was extracted from the stellar images using a Moffat-profile point spread function model (Moffat, 1969). The correlation in the raw photometry between the instrumental magnitude light curve and the estimated sky background was removed as described in Rowe et al. (2006). About 29% of the total number of data points were rejected because of pixel saturation during phases of the highest stray light in the MOST orbit and high cosmic ray fluxes when MOST passed through the South Atlantic Anomaly, as indicated by the orbital model of the local magnetic field strength. Additionally, about 6% of data points were rejected because of the relative uncertainty exceeding of the mean light level.
The reduction and selection procedure left 56,383 measurements containing gaps of variable length spaced roughly by the MOST orbital period, resulting in a net duty cycle of about 65%. (We later conducted a period search after an even stricter selection of the data, with a duty cycle of 59%, as described in Section 3.3.) The time sampling and duty cycle provide excellent coverage in binary orbital phase and during the eclipses of V471 Tau. Note that the orbital period of the binary of close to 1/2 day always created a phase-coverage problem for ground based observations; the MOST data are entirely free of this limitation. The MOST photometry data (raw, and the reduced light curve used for analysis in this paper) are available in the MOST Public Data Archive on the Science page of the MOST web site: www.astro.ubc.ca/MOST.
2.2 V471 Tau light curve
The 19 orbital cycles of the binary monitored by MOST allowed us to investigate changes in the light curve from cycle to cycle, which is normally interpreted as migration and evolution of spots on the magnetically active K dwarf component (Ibanoglu, 1978). The MOST data were divided into 1-day long subsets and those subsets were phased with the known orbital period of V471 Tau. Three of these subsets, from the beginning, middle and end of the 10-day run, are overplotted in Figure 1. A subtle trend is visible in that the rising portion of the light curve (in the phase interval 0.05 – 0.25) moves systematically later in phase with time, by a total of about 0.04 over 10 days. There is some evidence of this shift during the falling portion of the curve in the phase interval 0.75 – 0.95, but it is less pronounced. No phase shift is seen in the phase range 0.3 – 0.7, within the photometric scatter.
The changes seen in the MOST photometry resemble the “photometric wave migration” first reported by Ibanoglu (1978) and discussed below in Section 3.1. The average shift of the wave of phase/day indicates that it would take days for the wave to make a full revolution (). This is somewhat longer than the wave migration period found in previous studies (from d by Ibanoglu (1989) to d by Skillman & Patterson (1988)), although our estimate of the drift rate, based on only 19 orbital cycles, is necessarily crude.
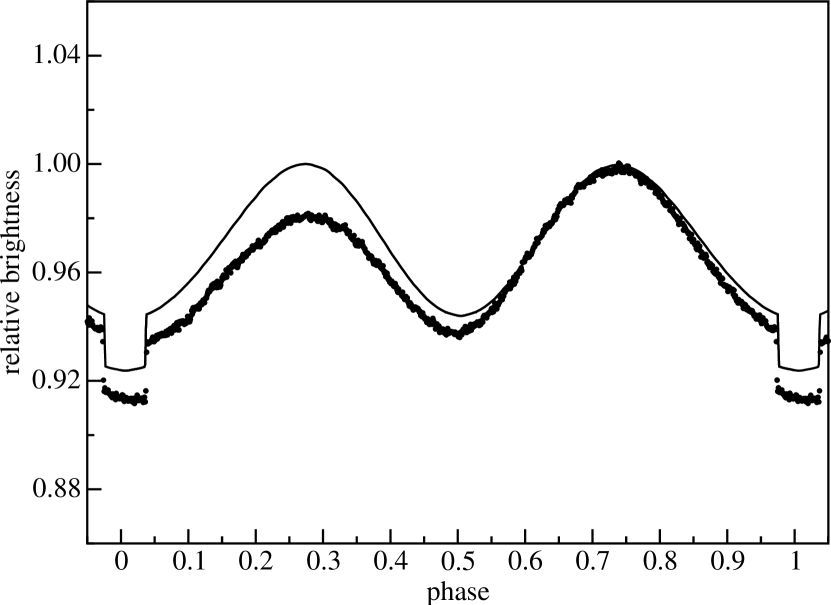
Seeing that the systematic changes in the light curve during the 10-day span of our observations were relatively small, with apparent shifts less than mag at a given orbital phase, we calculated a mean light curve from the entire time series. This is presented in Figure 2.
2.3 DDO spectroscopy
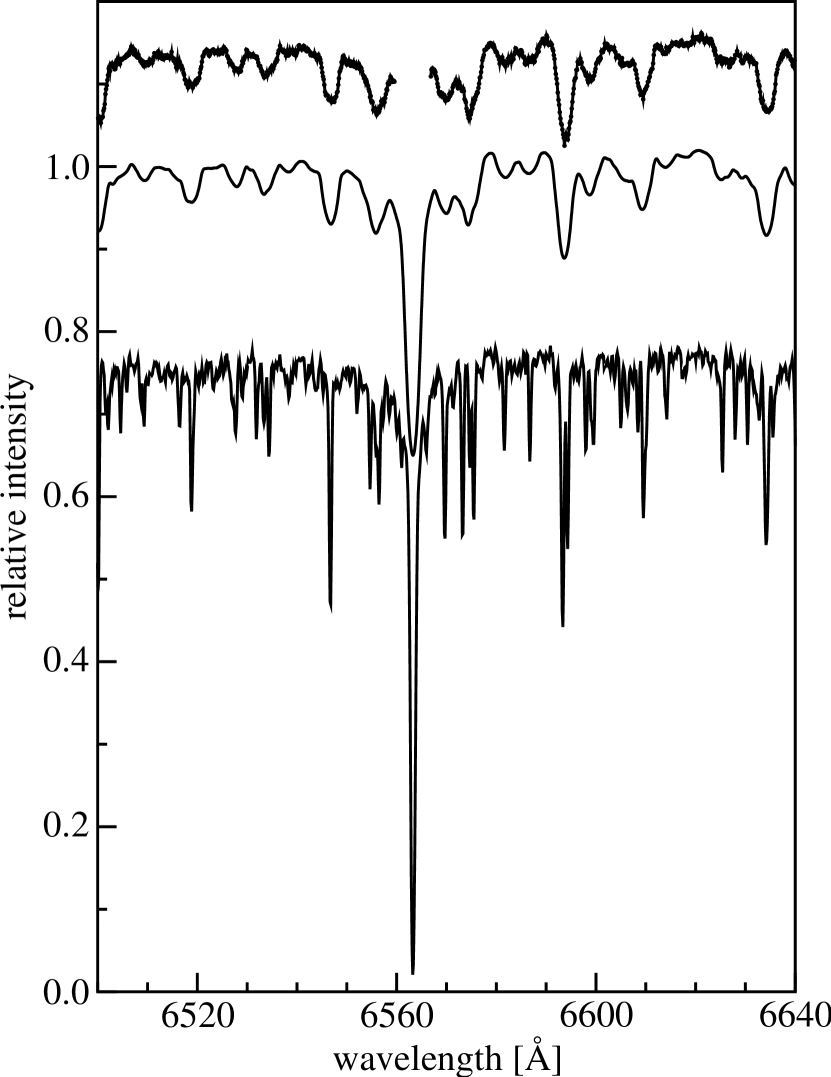
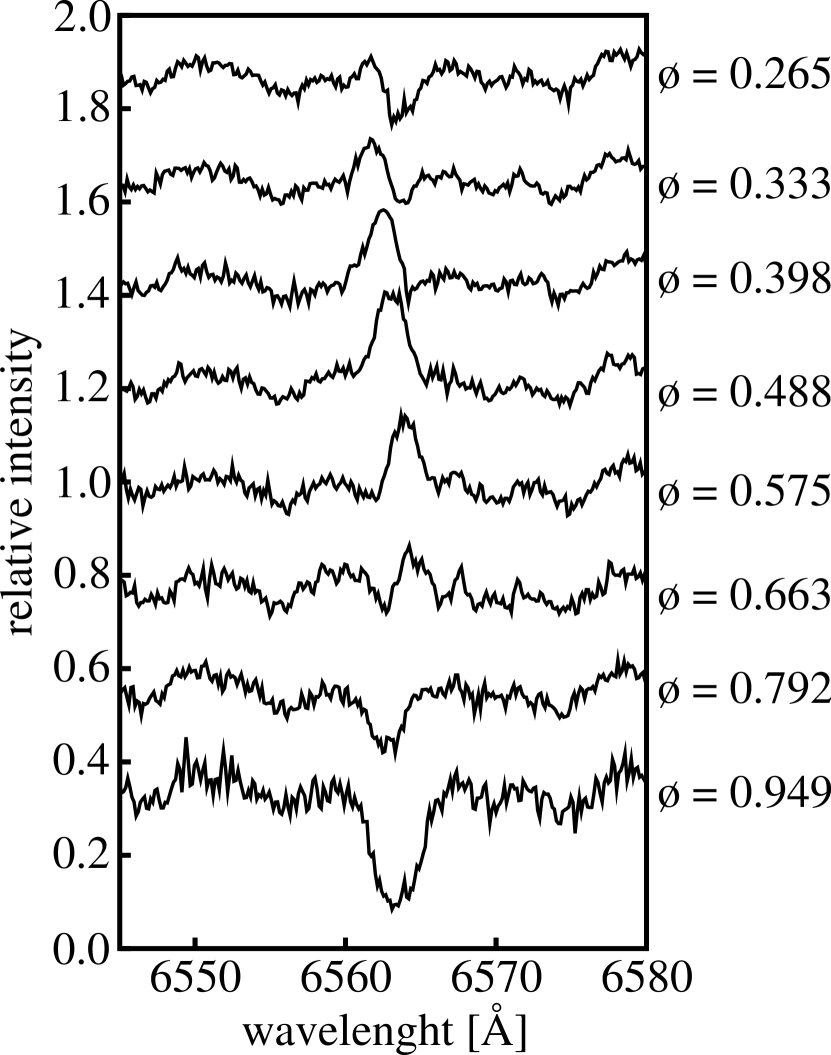
We obtained ground based spectroscopy of V471 Tau which partially overlapped with the MOST photometric run during 7 – 19 December 2005 (see Table 1). A total of 37 spectra at a dispersion of 0.14 Å/pixel were collected using the Cassegrain spectrograph of the 1.88-m telescope at the David Dunlap Observatory. Since we expected the K-type dwarf in the system to dominate the flux at optical wavelengths, the wavelength range of the spectra was centered at line, covering a red spectral window between 6425 and 6705 Å, (Figure 3). This region contains a multitude of telluric lines which were removed during standard reductions performed using IRAF222IRAF is distributed by the National Optical Astronomy Observatories, which are operated by the Association of Universities for Research in Astronomy, Inc., under cooperative agreement with the National Science Foundation. routines. The spectra were taken with the integration times and at intervals of about 30 minutes and could not cover all orbital phases of the binary because of the night/day breaks, commensurability of the binary period with one day and interruptions due to weather. The long integration times preclude any use of the spectroscopic data for improvement of the eclipse timing described in Section 3.2.
3 INTERPRETING THE LIGHT CURVE
The phase diagram of the mean light curve presented in Figure 2 was modeled using the PHOEBE software package (Prša & Zwitter, 2005), based on the Wilson-Devinney model. The orbital and physical parameters of both stars in the system were adopted from O’Brien et al. (2001): , , , , , ; the subscripts and signify the K and white dwarf components, respectively. The atmospheric parameters for the red dwarf component were set to typical values for a K dwarf; limb darkening = 0.52, gravity darkening = 0.32 and albedo = 0.5.
The resulting model reproduces the general nature and amplitudes of the double-wave variability, and the depth of the eclipse, seen in the MOST light curve, as shown in Figure 2. It consists of the dominant smooth, wave-like variability and a relatively shallow (0.022-mag deep) total eclipse lasting 46.9 minutes, with steep shoulders each approximately 50 sec long. The photometric double wave is caused by ellipsoidal distortion of the K dwarf, with a minor modification due to the reflection effect. The asymmetry in the ellipsoidal distortion variability is believed to be due to spots on the K dwarf.
3.1 Spot coverage
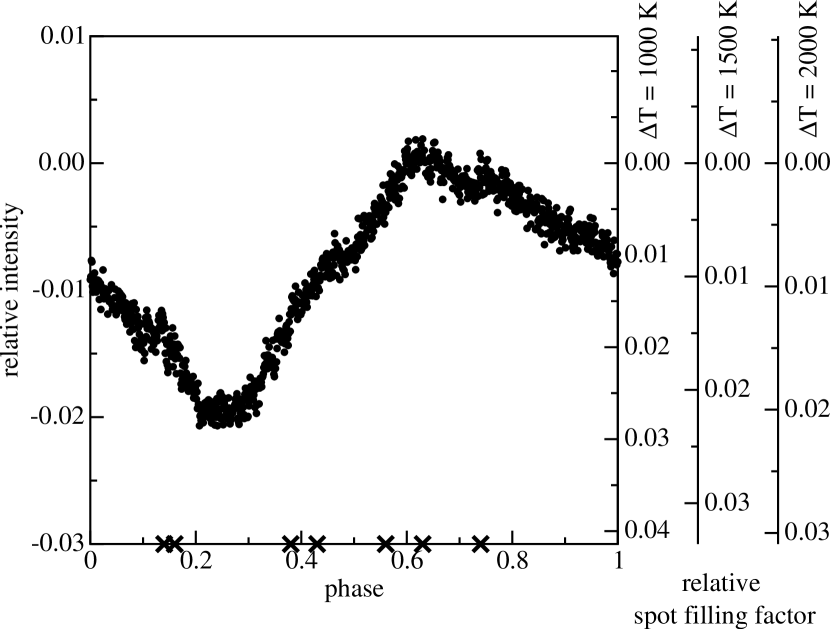
In order to study the locations and extent of spots on the surface of the K dwarf, we used the residuals between the observed light curve and the modeled light curve (Figure 4) to estimate the required changes of the spot filling factor with orbital phase. Because of the orbital inclination of , it is only possible to estimate changes in the mean spot coverage on the K dwarf disk within the latitude range of to . Recent Doppler imaging observations of Hussain et al. (2006) revealed that the K dwarf is rotating rigidly; this is confirmed by our determination of (Section 4.2). As our run duration was only 2.5 times longer than the time span of the observation used by Hussain et al. (2006), we expect any changes of filling factor at a given phase to reflect spot rearrangement caused by the star activity rather than the star differential rotation. Also, any spot interpretation can address only the part of the spot coverage which is longitudinally asymmetric.
Our results indicate that the smallest spot coverage occurred during the orbital phases , while the largest occurred during . We seem to have observed a totally different level of activity in the K dwarf than seen during the Doppler imaging observations by Ramseyer et al. (1995) and Hussain et al. (2006). Our estimate of the peak-to-peak amplitude of the spot filling factor, (depending on the assumed spot temperature differential values of , as shown in Figure 4), is many times smaller than the changes of observed by Hussain et al. (2006) in November 2002. Also, in our data, the maximum spot coverage is inferred close to orbital phase 0.25, while Hussain et al. (2006) found the maximum around phase 0.07. The evolution of the spot coverage during the 10-day MOST observing run was still smaller, typically at a level of , depending on the phase.
3.2 Eclipse timing
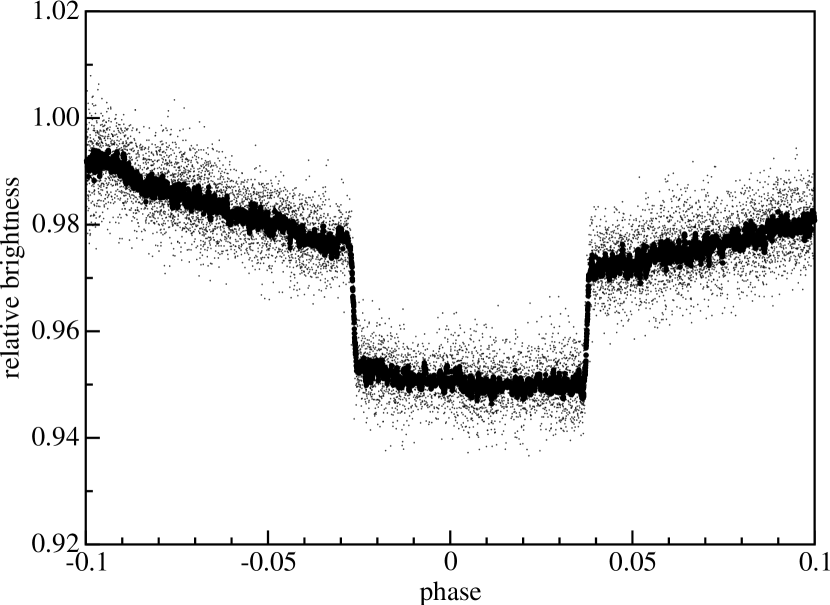
The relatively slow 10-sec photometric sampling rate (compared with the eclipse branch duration of 50 sec) and the temporal gaps left after the data selection made it impossible to measure times of individual eclipses accurate to a few seconds. Instead, we calculated the average eclipse time on the basis of a phased light curve of the entire time series to compare with earlier eclipse times in the literature. The phases were computed with the linear ephemeris given by Guinan & Ribas (2001). Because previous eclipses have been observed over a long time span ( yr) and the orbital period of the binary is short, we adopted a uniform time system of Heliocentric Julian Date based on the Terrestrial Time (HJED), as advocated by Bastian (2000).
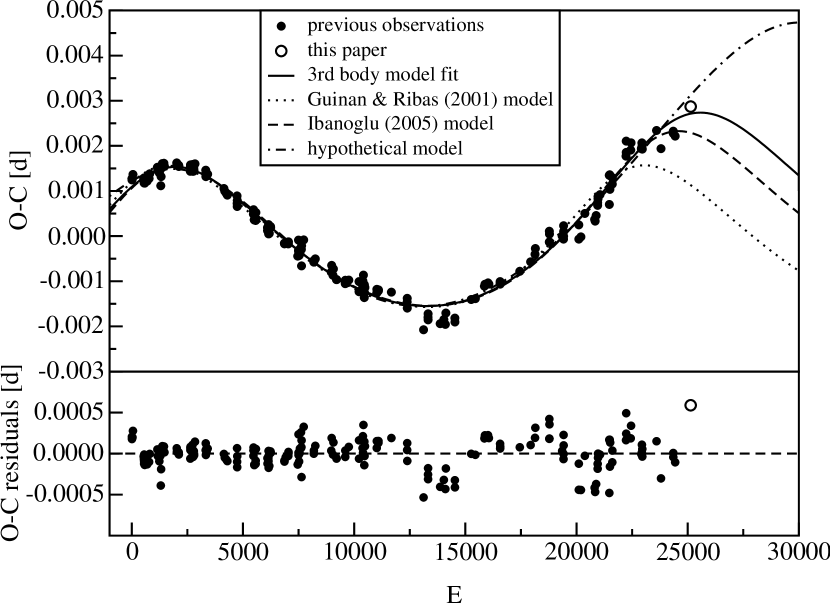
The eclipse time was determined after correction of the light curve for the local slope created by the photometric wave. Since all contacts of the eclipse are not well defined (see Figure 5) we determined the intersections of the averaged eclipse branches with horizontal line at the mid-depth level. The mid-point of both intersections corresponds to the mid-point of the eclipse. With the ephemeris of Guinan & Ribas (2001), our mean epoch corresponds to . The shift in the observed time of the mid-point of eclipse is large compared to the predicted zero phase by Guinan & Ribas (2001): seconds, or over 4 minutes (see Figure 5). The MOST eclipse time determination is shown compared to all available published data (as discussed by Ibanoglu et al. (2005)) in Figure 6. The curve continues an upward trend seen for about the last 10,000 orbital cycles. The implications of the MOST timing point are explored below.
3.2.1 Third body
The V471 Tau period changes visible in the eclipse diagram have been interpreted previously by several others as a light-travel-time effect caused by a perturbing third star in a long-period orbit in the system (Ibanoglu et al., 1994; Guinan & Ribas, 2001; Ibanoglu et al., 2005). This explanation is attractive because it could be reconciled with the main features of the diagram. It is also exciting because the mass of the hypothetical third body would be sub-stellar for a large range of possible inclination angles.
Our new eclipse timing measurement shows that the long-anticipated downward bend in the diagram has not yet happened. Moreover, it deviates substantially from the most recent third-body model proposed (Ibanoglu et al., 2005) by 52 sec, which is 3.6 times larger than of the residuals for this model, as shown in the lower panel of Figure 6. Indeed, the MOST point is the largest deviation from this model so far observed.
Therefore, we decided to recalculate the third-body model utilizing the same formalism as in Ibanoglu et al. (2005). With the new data augmented by the MOST result, the semi-amplitude of the variations, the third-body orbital period and its mass function are all slightly larger and longer than those given by Ibanoglu et al. (2005); see Table 2 for the full set of fitted parameters. The third-body orbital fit, although formally appropriate, remains uncertain because we still do not see the bend in the curve. In fact, as is shown in Subsection 3.2.3 below, it is reasonable to assume that the period has been constant since , i.e., over the last years. However, if we continue to see a straight line in future extensions of the diagram, this will not necessarily exclude the third-body hypothesis. Figure 6 includes a fit to a third-body model whose orbit has an even longer period which can still match the observations. Note that the orbital inclination range necessary to preserve the sub-stellar mass of the third body will decrease to a very small range of angles if the current linear trend in the deviations continues.
The suggested parameters of the hypothetical third body in the V471 Tau system indicate that this object may be detectable with modern infrared telescopes or interferometers. With a larger mass function and a longer orbital period than in Guinan & Ribas (2001), the separation and brightness of the third body can be as large as 0.9 arc second and K 13.3 mag; see Table 6 for predictions of the third body parameters for its different orbital inclinations.
3.2.2 Apsidal motion
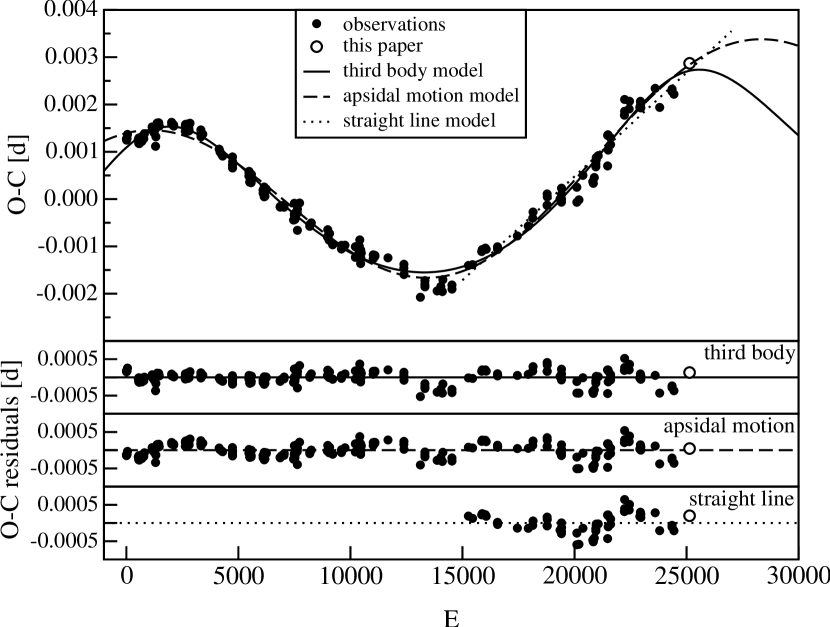
If the binary orbit is even slightly ellipsoidal, it may show a motion of the line of apses. This explanation was mentioned by Herczeg (1975) and Skillman & Patterson (1988), but then dismissed as an unlikely cause for the changes in eclipse times. We performed a least-squares fit of the curve with the first-order formula given by Todoran (1972) and found that a very narrow range of eccentricity, (with 98% confidence level), is required to explain the latest results we have presented. See Table 3 and Figure 7. Although the orbit is expected to circularize in a very close binary system like V471 Tau, our fit to a slightly non-zero eccentricity is surprisingly close to the one we find from our radial velocity orbital measurements (see Section 4.1 below).
3.2.3 Sudden period changes
Without assuming anything about the actual nature of the changes, it may be argued that the curve is composed of a few straight-line segments, each corresponding to a constant period, and of relatively short intervals where abrupt period changes take place. The portions of the diagram from epochs to and from onwards appear to be consistent with two different constant periods. Least-squares linear fits to both segments of the diagram yield periods of and days, respectively (the errors in parentheses are given in units of the last decimal place), corresponding to a relative period change of .
A sudden period change may be explained as a result of mass transfer or mass loss in a binary. For V471 Tau, we do not know if the possible donor, the K dwarf, is more massive than the mass recipient, the WD, but this is the most probable (O’Brien et al., 2001). In that case, the favorable scenario of a recent period increase is mass loss at the level of (Hilditch, 2001). Taking the masses of both components at the limits of the O’Brien et al. (2001) ranges we can also consider the case when the donor is the less massive star. Such a situation would require conservative mass transfer at a level of to explain the recent period increase. Both mass-loss rates appear to be large and unlikely for V471 Tau as they would result in other detectable phenomena. Moreover, both a period increase and a period decrease have been observed for the system so the complete picture would have to be even more complex.
The latest period change took place over some cycles so the inferred time scale, , was years. This is a relatively short time scale for any thermal equilibrium adjustment in the K dwarf, but of course may relate only to the outer layers of its envelope.
The standard deviation in the residuals of the second segment of = 22.7 s (Figure 7) is slightly larger than for any of the previous fits (14.9 s for the third-body model and 16.6 s for the apsidal motion model) but is still acceptable if superimposed upon possible short-timescale variations which are considered below.
3.2.4 Periodic residuals from eclipse timing models
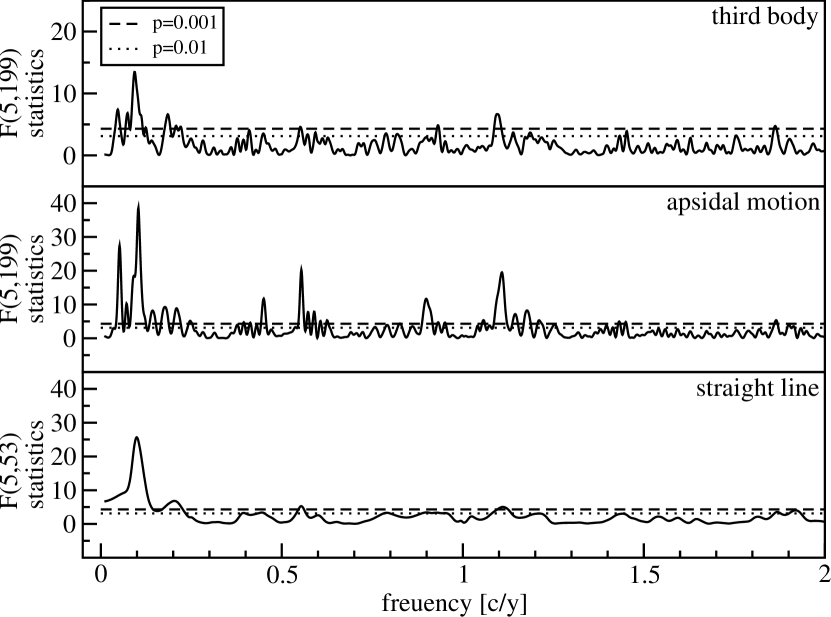
Every one of the models we calculated generates residuals with larger than the accuracy of the eclipse timings (typically a few seconds). We performed a search for periodicities in the residuals and found that regardless of the model used, there is evidence for a 10-year period in the timing residuals.
To investigate this further, we decided to employ a multi-harmonic analysis of variance (MAOV) with 2 harmonics, as described in Schwarzenberg-Czerny (1996). This method uses orthogonal polynomials to model the data and the analysis of variance statistics to evaluate the quality of the result. The MAOV periodogram obeys Fisher’s probability distribution with and degrees of freedom, where is the number of harmonics used and is the number of observations. The quantity shown in Figure 8 measures the ratio of powers of the periodic signal and residual, fully random noise.
The amplitude of the variations we find in the residuals is similar for all three models we adopted, at the level of 20–25 s and indeed indicates a typical underlying variation with a time scale of about 10 years. The 5.5-yr period found by Ibanoglu et al. (2005) – which was connected with the -yr period in the mean brightness variations of the system – is also present, but at a much lower significance level (see Figure 8).
3.3 Short-period oscillations
Fluctuations with a period of 555 s were discovered in soft X-ray flux from the V471 Tau system by the EXOSAT satellite (Jensen et al., 1986). In 1991, 131 hours of continuous U-band photometry of V471 Tau by the Whole Earth Telescope (WET) (Clemens et al., 1992) resulted in the detection of three periods: 554.63, 561.59 and 277.319 s. The dominant 555-s variability (with its 277s harmonic) was attributed directly to the accreting magnetic polar caps on the white dwarf component of the system, and the 562s signal to the same radiation reprocessed by the K dwarf atmosphere.
To search for short-period variations in the MOST photometry, we first removed variations caused by the binary revolution and rotation of the spotted component. The data were “rectified” by fitting the data with least-squares low-order polynomials and then dividing by the fitted function. The eclipses and flare events (see Section 3.4 below), accounting for about 7% of the total time series, were excluded from the fit, resulting in a net duty-cycle of 59%. The remaining 52,371 brightness measurements of the binary, as well as corresponding measurements of both reference stars, were used to calculate MAOV periodograms, as described above in Subsection 3.2.4.
Analysis of the resulting periodogram revealed that none of the three WET periods is present in the MOST data, but their absence is easy to understand. While the white dwarf contribution to the total brightness of the system in the band is about 39%, it is only 2.3% in the broad MOST photometric bandpass which includes considerable red flux. Therefore, the relative amplitude of the variations in MOST photometry is expected to be about times smaller than in WET photometry. The relative signal would be , which is slightly below our estimated, one-sigma detection limit of about in these data. This value was calculated by folding the data with a period incommensurate with any of the V471 Tau variations and MOST orbital harmonics. The noise estimation was also confirmed with the photometric data of both reference stars.
Thus, the non-detection of the white dwarf pulsations in the broad MOST passband is entirely predictable. We can conclude only that the pulse amplitude (and presumably the polar accretion rate) did not increase significantly since the WET campaign in 1991.
3.4 Flare activity
Several flare-like events have been reported in V471 Tau by Rucinski (1981), Tunca et al. (1993), Ibanoglu et al. (2005) and others. Young et al. (1983) found that flares are most likely to occur when the brightness of the system is near its minimum, when the K dwarf was thought to have its most spotted hemisphere facing Earth.
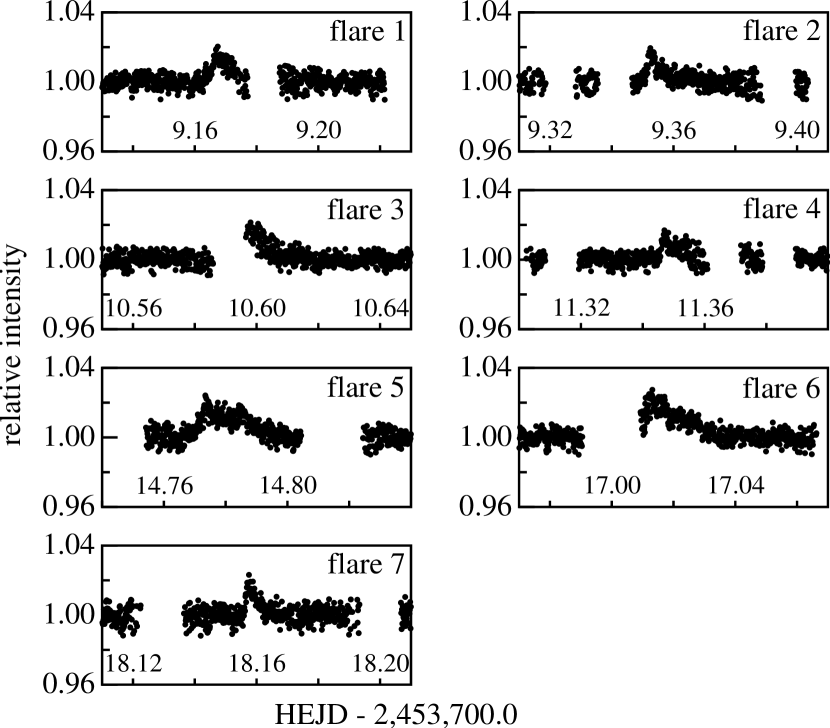
In the MOST light curve, we identified seven events we would consider flare-like, although two of them were only partially recorded due to gaps in the data. This is the first detection of white-light flares by the MOST satellite and probably the largest homogeneous set of V471 Tau flare-like events observed so far. The durations of these events varied from about 10 to over 35 minutes, but their shapes all share the same rapid rise and slower decay characteristic of flares seen in visible light. The candidate events are shown in Figure 9.
In contrast to Young et al. (1983), we did not find any correlation of the flare events with the photometric wave minimum. The flares occurred during phases of the lowest as well as the highest spottedness of the K dwarf, with no apparent concentration in phase. The symbols at the bottom of Figure 4 mark the phases when the flares occurred. Using luminosities of both components in the band given by O’Brien et al. (2001), we estimated a lower limit to the energy released during the whole duration of a typical flare observed during the MOST run at about erg (see Table 4). The energies of each of the seven flares we observed are comparable to the energy released by the flare reported by Ibanoglu et al. (2005) and are at the top of the range of energies released by all flare-like events reported for V471 Tau. Because the activity cycle of V471 Tau still remains to be characterized in terms of its period and intensity, we cannot relate the observed incidence of flares to the phase in this cycle. We note only that all the observed flares share the shape, duration and energy with those reported for typical RS CVn systems.
The number of detected flare-like events corresponds to a total number of about 10 such events during the 10-day span of the MOST observations. Considering the limitations of ground-based observations one would expect to be able to detect a maximum of 4 flare-like events during the same period of time.
4 INTERPRETING THE SPECTRA
The typical S/N of the DDO spectra of V471 Tau is about 30. The contribution of the white dwarf component to the total light in the observed wavelength range is less than 1%, so its contributions to the spectroscopic analyses described below are negligible. Our discussion of the spectroscopic results is limited to the K dwarf in the system.
4.1 Radial velocities
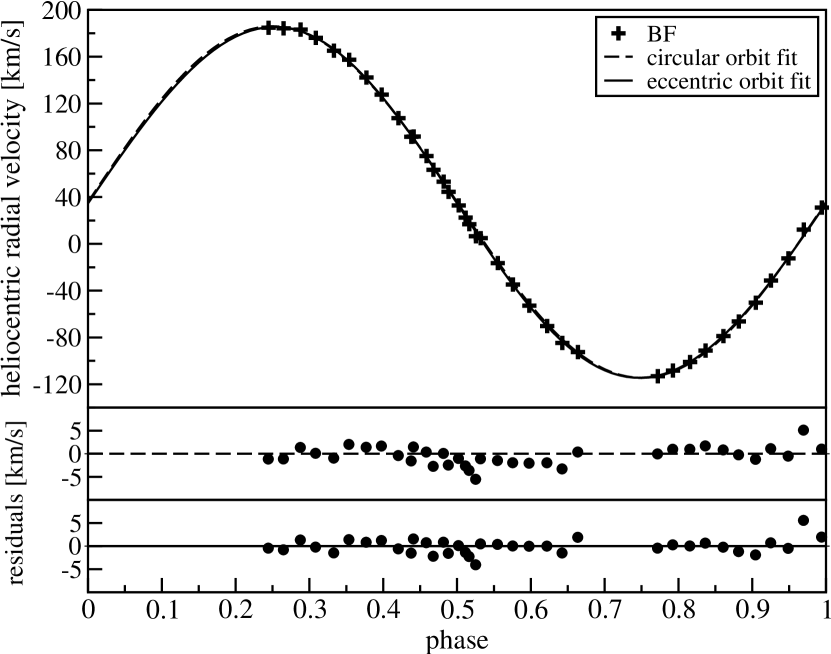
To derive the radial velocities (RV) of the K dwarf, we used the Broadening Function (BF) technique (Rucinski, 1999). Spectra of four different K-type standard stars (HD 62509, HD 65583, HD 3765, HD 103095) were adopted as templates. The resulting broadening functions were fitted by a rotational line-broadening profile, with a linear limb-darkening coefficient of 0.52 (assumed to be typical for a K-type dwarf in the observed wavelength range), following van Hamme (1993). The resulting RV measurements are listed in Table 1.
We performed two independent least-squares fits to the radial velocities, assuming first a circular and then an eccentric orbit, at a fixed orbital period as given by Guinan & Ribas (2001), but with the time of conjunction taken from the MOST light curve. The results of the fits and their residuals are plotted in Figure 10. The quality of both fits, evaluated by calculating the standard deviations of the residuals, is essentially identical for both types of orbits, with km s-1. The fact that is not reduced for a model with more free parameters suggests that the eccentric orbit solution is not necessary (Lucy & Sweeney, 1971), although obviously this is not a proof for perfect circularity of the V471 Tau orbit.
All our orbital model parameters (Table 5) agree very well with those obtained recently by Hussain et al. (2006), but they deviate slightly from those obtained previously with the same DDO 1.88-m telescope by Bois et al. (1988). The amplitude we find is larger by about km s-1, and the center-of-mass radial velocity is about 2 km s-1 smaller.
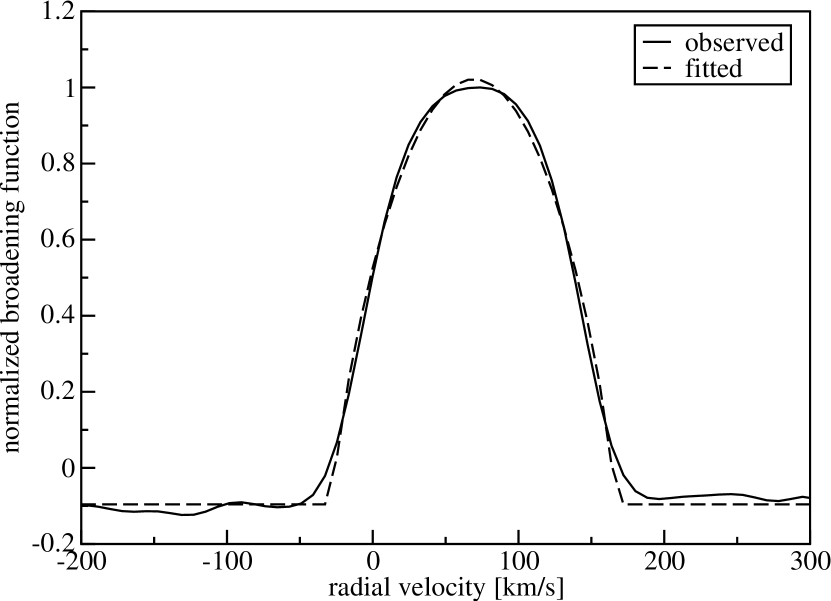
4.2 Projected rotation velocity
A bonus of the BF analysis is the availability of the projected rotation profile of the star onto radial velocity space (Figure 11). This shape can be interpreted through a solid-body rotation to estimate the projected equatorial velocity . In the BF determination, we used HD 3765 as a standard star because its spectral type, K2V, is identical to that of the V471 Tau K dwarf. An average of the projected rotational velocities for all spectra is km s-1. The value is corrected for the broadening introduced by the method, the magnitude of which can be estimated by applying the BF method to the template itself. The result is consistent with previous estimates made by Ramseyer et al. (1995) and Hussain et al. (2006) ( and km s-1, respectively) and all are consistent with synchronous rotation of the K dwarf in V471 Tau.
4.3 emission
The line was detected in emission in V471 Tau by Lanning & Etzel (1976). Subsequent detailed studies (Young et al., 1988; Bois et al., 1991; Rottler et al., 2002) revealed orbital phase-dependence of the emission as well as long-term changes of its equivalent width.
We extracted the emission from the absorption profiles of our spectra by again using the standard star HD 3765 as a template. HD 3765 has the same spectral type as the V471 Tau K dwarf and rotates very slowly at km s-1 (Soderblom, 1985). We convolved the standard spectrum with the rotational profile calculated for km s-1 (our value for V471 Tau) and fitted the resulting modified spectrum to each of our V471 Tau spectra in two wavelength ranges: Å and Å (see Figures 3 and 12). Subsequently, we used the net emission to derive the radial velocities and equivalent widths of the emission line (Table 1). The extracted profiles were symmetrical thus allowing us to use a Gaussian fit for measuring RV and numerical integration for equivalent widths. The radial velocity of the emission (Figure 13) follows the K dwarf orbital variations, but with a smaller amplitude of about 120 km s-1, as estimated from a sinusoidal fit. Such behavior was observed during 1975 – 1984 by Bois et al. (1991), but with a still much smaller amplitude of km s-1. We observe that the equivalent width changes symmetrically with respect to its maximum at orbital phase 0.5 (Figure 13), in a very similar way to what was reported by Bois et al. (1991). The amplitude of the equivalent width variability in our data is about 1.2 Å with the maximum emission of about Å at phase 0.5.
Long-term changes of emission were detected by Bois et al. (1991), who showed that the emission strength diminished between 1975 and 1983 and then grew rapidly in 1984. More recent observations by Rottler et al. (2002) have shown that since 1985, the emission was dropping again, until it finally vanished in 1992. This suggests that the long-term variation in emission strength may be periodic, with a period of roughly 9 years. Our measurements show that in December 2005, the emission strength was comparable to its average values in the past. This is consistent with a 9-year periodicity, since our DDO spectra were obtained about 2 years after the latest expected emission maximum in such a cycle.
5 SUMMARY
The nearly continuous MOST spacebased photometry of V471 Tau covering 10 days in December 2005, combined with partly simultaneous DDO groundbased spectroscopy, monitored a fairly quiescent stage in the activity of the K dwarf in this close binary system. This is apparent in the light curve which deviates relatively little from the model and almost does not change during the whole observing run. Even during such a stable time, seven candidate flare events were observed in 10 days, whose estimated energies would be among the highest ever seen in V471 Tau. There is no correlation between the times of the flares and orbital phase.
The main features of the orbital phase diagram of the MOST photometry are well reproduced by our eclipsing binary light curve synthesis model. The largest systematic deviation in the double-wave light curve is only about mag and is consistent with spots on the K dwarf which is expected to rotate synchronously with the orbit. The amount of spottedness on the star did not change much during the MOST observing run – by no more than about 1%. This supports the claim that the K dwarf was observed close to a minimum in its activity cycle. A half-orbital-period modulation of the radial velocity residuals was reported earlier by Hussain et al. (2006) and interpreted as an asymmetry in spot distribution on the K star’s surface. We see no such residuals in our radial velocity measurements. We note that the residuals seen by Hussain et al. (2006), the radial velocity curve we obtain, and the variations in eclipse times observed over the past 35 years, could all be interpreted as a small non-zero eccentricity of the orbit of V471 Tau.
Because of the broad bandpass of the MOST photometry with substantial flux in the red, and the red wavelength range of the DDO spectra, the white dwarf contributes only about 2% and 1% of the total intensity of the system, respectively. We were therefore unable to constrain the properties of the hot white dwarf in the system or confirm the oscillation frequencies detected by WET (Clemens et al., 1992), since the relative amplitudes in the custom-filter, broadband MOST photometry would be about 17 times smaller than in the WET -band photometry. The positive aspect of this is that our estimates of the K dwarf properties from MOST photometry and DDO spectroscopy are not contaminated by the white dwarf, but we can use the timing of the white dwarf eclipses to investigate aspects of the orbit of the V471 Tau system.
Changes in the values of the times of eclipse of the white dwarf can, however, be explained by at least three entirely different models: (1) There could have been at least two abrupt period changes in the orbit of the system in the last 35 years, although there is no obvious mechanism for this. (2) There could be apsidal motion due to a slightly eccentric orbit. (3) The V471 Tau system might be a trinary, with a third low-mass companion in a long-period orbit. The last two periodic phenomena both predict that the eclipse timing deviations must drop in the future (see Figure 7). The small eccentricity which could explain the diagram is also in agreement with the formal solution of the radial velocity curve of the K dwarf from our high-quality DDO spectra, but its value is currently below the direct spectroscopic detection threshold. Future accurate eclipse timing observations, such as performed by the MOST satellite, are desired as they may resolve the dilemma between those three models.
The residuals do show a convincing residual periodic variation with a period of about 10 years, regardless of the model used to explain the longer-term changes. This variation may be due to an activity cycle in the K dwarf, but this is a highly speculative explanation. We note that the emission appears to change in intensity in a characteristic time scale of about 9 years, perhaps coincident with the periodicity in eclipse time variations at the frequency resolution of the entire data sample at hand. The 10-year period in the residuals may also be related with the 5.5-year period in the system mean brightness variations found by Ibanoglu et al. (2005) as its multiple. Nevertheless we think that both periods are too uncertain to firmly connect them at this stage of the study of V471 Tau.
The DDO spectra yield a new radial velocity curve for the orbit of the K dwarf, and an improved determination of the projected rotation of the star, km s-1 based on high-quality BF (broadening function) profiles. The spectra also enabled us to measure the emission velocities and changes in its equivalent width. The emission of V471 Tau showed the same orbital phase dependence as observed before by Bois et al. (1991) and Rottler et al. (2002) with maximum emission at phase . The observed amplitude of equivalent width variations of about 1.2 Å was average for the system and consistent with the 9-year period noted by previous investigators. Unfortunately, the 13-year gap between the most recent published emission observations of V471 Tau and our new DDO observations does not allow us to reliably verify the periodic character of the mean emission strength variation.
A new feature of the emission revealed by our observations was its much larger amplitude of radial velocity variation (120 km s-1) compared to that reported by earlier observers (75 km s-1 by Bois et al. (1991)). This suggests that the source of the emission was less concentrated around the sub-white-dwarf point on the K star as had been seen in the previous data.
References
- Bastian (2000) Bastian, U. 2000, Inf. Bull. Var. Stars, 4822
- Bois et al. (1988) Bois, B., Lanning, H. H., Mochnacki, S. W. 1988, AJ, 96, 157
- Bois et al. (1991) Bois, B., Lanning, H. H., Mochnacki, S. W. 1991, AJ, 102, 6
- Chabrier et al. (2000) Chabrier, G., Baraffe, I., Allard, F., Hauschildt, P. 2000, ApJ, 542, 464
- Clemens et al. (1992) Clemens, J. C., Nather, R. E., Winget, D. E., Robinson, E. L., Wood, M. A., Claver, C. F., Provencal, J., Kleinman, S. J., Bradley, P. A., Frueh, M. L., Grauer, A. D., Hine, B. P., Fontaine, G., Achilleos, N., Wickramasinghe, D. T., Marar, T. M. K., Seetha, S., Ashoka, B. N., O’Donoghue, D., Warner, B., Kurtz, D. W., Martinez, P., Vauclair, G., Chevreton, M., Barstow, M. A., Kanaan, A., Kepler, S. O., Augusteijn, T., van Paradijs, J., Hansen, C. J. 1992, ApJ, 391, 773
- Guinan & Ribas (2001) Guinan, E. F., Ribas, I. 2001, ApJ, 546, L43
- Herczeg (1975) Herczeg, T. J. 1975, Inf. Bull. Var. Stars, No. 1076
- Hilditch (2001) Hilditch, R. W. 2001, “An Introduction to Close Binary Stars”, Cambridge University Press, Cambridge
- Hussain et al. (2006) Hussain, G. A. J., Allende Prieto, C., Saar, S. H., Still, M. 2006, MNRAS, 367, 1699
- Ibanoglu (1978) Ibanoglu, C. 1978, Ap&SS, 57, 219
- Ibanoglu (1989) Ibanoglu, C. 1989, Ap&SS, 161, 221
- Ibanoglu et al. (1994) Ibanoglu, C., Keskin, V., Akan, M. C., Evren, S., Tunca, Z. 1994, A&A, 281, 811
- Ibanoglu et al. (2005) Ibanoglu, C., Evren, S., Tas, G., Cakirli, O. 2005, MNRAS, 360, 1077
- Jensen et al. (1986) Jensen, K. A., Swank, J. H., Petre, R., Guinan, E. F., Sion, E. M., Shipman, H. L. 1986, ApJ, 309, L27
- Lanning & Etzel (1976) Lanning, H. H., Etzel, P. B. 1976, Inf. Bull. Var. Stars, No. 1147
- Lucy & Sweeney (1971) Lucy, L. B., Sweeney, M. A. 1971, AJ, 76, 544
- Matthews et al. (2004) Matthews, J. M., Kuschnig, R., Guenther, D. B., Walker, G. A. H., Moffat, A. F. J., Rucinski, S. M., Sasselov, D., Weiss, W. W. 2004, Nature, 430, 921
- Moffat (1969) Moffat, A. F. J., 1969, A&A, 3, 455
- O’Brien et al. (2001) O’Brien, M. S., Bond, H. E., Sion, E. M. 2001, ApJ, 563, 971
- Prša & Zwitter (2005) Prša, A., Zwitter, T. 2005, ApJ, 628, 426
- Ramseyer et al. (1995) Ramseyer, T. F., Hatzes, A. P., Jablonski, F. 1995, AJ, 110, 3
- Rowe et al. (2006) Rowe, J. F., Matthews, J. M., Seager, S., Kuschnig, R., Guenther, D. B., Moffat, A. F. J., Rucinski, S. M., Sasselov, D., Walker, G. A. H., Weiss, W. W. 2006, ApJ, 646, 1241
- Rottler et al. (2002) Rottler, L., Batalha, C., Young, A., Vogt, S. 2002, A&A, 392, 535
- Rucinski (1981) Rucinski, S. M. 1981, Acta Astron., 31, 37
- Rucinski (1999) Rucinski, S. M. 1999, in ASP Conf. Ser. 185, Precise Stellar Radial Velocities, ed. J. B. Hearnshaw & C. D. Scarfe (San Francisco: ASP), 82
- Schwarzenberg-Czerny (1996) Schwarzenberg-Czerny, A. 1996, ApJ, 406, 107
- Skillman & Patterson (1988) Skillman, D. R., Patterson, J. 1988, AJ, 96, 976
- Soderblom (1985) Soderblom, D. R. 1985, AJ, 90, 10
- Still & Hussain (2003) Still, M., Hussain, G. 2003, ApJ, 597, 1059
- Todoran (1972) Todoran, I. 1972, Ap&SS, 15, 229
- Tunca et al. (1993) Tunca, Z., Keskin, V., Evren, S., Ibanoglu, C., Akan, M. C. 1993, Ap&SS, 204, 297
- van Hamme (1993) van Hamme, W. 1993, AJ, 106, 2096
- Walker et al. (2003) Walker, G., Matthews, J., Kuschnig, R., Johnson, R., Rucinski, S., Pazder, J., Burley, G., Walker, A., Skaret, K., Zee, R., Grocott, S., Carroll, K., Sinclair, P., Sturgeon, D., Harron, J. 2003, PASP, 115, 1023
- Werner & Rauch (1997) Werner, K., Rauch, T. 1997, A&A, 324, L25
- Young et al. (1983) Young, A., Klimke, A., Africano, J. L., Quigley, R., Radick, R. R., Van Buren, D. 1983, ApJ, 267, 655
- Young et al. (1988) Young, A., Skumanich, A., Paylor, V. 1988, ApJ, 334, 397
| No. | photometric | S/N | EW | of | ||
|---|---|---|---|---|---|---|
| phase | (km s-1) | (Å) | net emission (km s-1) | |||
| 1 | 17.58275 | 0.5162 | 30 | 16.8 | -0.578 | 42 |
| 2 | 17.71561 | 0.7717 | 30 | -113.2 | 0.183 | -77 |
| 3 | 17.72632 | 0.7922 | 30 | -108.3 | 0.249 | -57 |
| 4 | 17.73841 | 0.8154 | 30 | -101.1 | 0.361 | -77 |
| 5 | 17.74935 | 0.8364 | 30 | -91.2 | 0.407 | -70 |
| 6 | 17.76196 | 0.8606 | 30 | -78.8 | 0.493 | -22 |
| 7 | 17.77283 | 0.8815 | 30 | -66.3 | 0.620 | -7 |
| 8 | 17.78482 | 0.9045 | 12 | -50.3 | 0.801 | -11 |
| 9 | 17.79554 | 0.9250 | 30 | -31.3 | 0.727 | -7 |
| 10 | 17.80788 | 0.9487 | 30 | -12.4 | 0.789 | 36 |
| 11 | 17.81871 | 0.9695 | 8 | 12.2 | 0.745 | 15 |
| 12 | 17.83145 | 0.9939 | 8 | 31.0 | 0.538 | 57 |
| 13 | 18.48312 | 0.2443 | 20 | 184.8 | 0.165 | 167 |
| 14 | 18.49374 | 0.2647 | 30 | 184.2 | 0.103 | 186 |
| 15 | 18.50572 | 0.2877 | 30 | 183.2 | 0.025 | 168 |
| 16 | 18.51648 | 0.3083 | 30 | 176.1 | -0.050 | 166 |
| 17 | 18.52928 | 0.3329 | 30 | 165.2 | -0.143 | 159 |
| 18 | 18.54004 | 0.3535 | 30 | 157.4 | -0.207 | 141 |
| 19 | 18.55221 | 0.3768 | 30 | 142.2 | -0.278 | 147 |
| 20 | 18.56299 | 0.3975 | 30 | 127.6 | -0.375 | 129 |
| 21 | 18.57489 | 0.4203 | 30 | 107.5 | -0.411 | 110 |
| 22 | 18.58558 | 0.4409 | 30 | 91.8 | -0.485 | 92 |
| 23 | 18.59955 | 0.4677 | 30 | 63.3 | -0.535 | 81 |
| 24 | 18.61024 | 0.4882 | 30 | 44.4 | -0.544 | 62 |
| 25 | 18.62229 | 0.5113 | 30 | 22.4 | -0.485 | 42 |
| 26 | 18.63295 | 0.5318 | 30 | 4.8 | -0.520 | 26 |
| 27 | 18.64494 | 0.5548 | 30 | -16.4 | -0.388 | 18 |
| 28 | 18.65570 | 0.5754 | 30 | -34.7 | -0.319 | 3 |
| 29 | 18.66658 | 0.5976 | 15 | -52.8 | -0.298 | -22 |
| 30 | 18.67986 | 0.6218 | 30 | -70.3 | -0.135 | -25 |
| 31 | 18.69057 | 0.6423 | 30 | -84.7 | -0.102 | -63 |
| 32 | 18.70082 | 0.6635 | 30 | -92.5 | -0.121 | -42 |
| 33 | 23.79578 | 0.4377 | 30 | 91.5 | -0.393 | 100 |
| 34 | 23.80649 | 0.4583 | 30 | 75.0 | -0.447 | 90 |
| 35 | 23.81862 | 0.4816 | 10 | 53.2 | -0.394 | 61 |
| 36 | 23.82925 | 0.5020 | 10 | 32.9 | -0.440 | 55 |
| 37 | 23.84138 | 0.5252 | 20 | 6.5 | -0.403 | 35 |
| parameter | value |
|---|---|
| (HJED) | |
| (d) | |
| (yr) | |
| (AU) | |
| semiamplitude (sec) | |
| (degr) | |
| () |
Note. — The errors were estimated using the bootstrap sampling method for the 98% confidence level; this is why they appear to be large when compared to other fits, for example by Ibanoglu et al. (2005).
| parameter | value |
|---|---|
| (day) | |
| semiamplitude (sec) | |
| (degr) | |
| (degr/day) |
| nr | start time (HJED) | phase | duration (min) | (erg) | |
|---|---|---|---|---|---|
| 1 | 2453709.164 | 0.379 | 19 | 0.014 | |
| 2 | 2453709.351 | 0.738 | 12 | 0.014 | |
| 3* | 2453710.59 | 0.12 | |||
| 4 | 2453711.345 | 0.564 | 13 | 0.011 | |
| 5 | 2453714.770 | 0.135 | 36 | 0.018 | |
| 6* | 2453717.01 | 0.43 | 0.018 | ||
| 7 | 2453718.156 | 0.632 | 10 | 0.017 |
Note. — designates the lower limit for total energy released in the band. The flares marked with a star were observed only partially.
| parameter | circular orbit | eccentric orbit |
|---|---|---|
| (km s-1) | ||
| () | ||
| – | ||
| (degr) | – | |
| (km s-1) | ||
| (km s-1) |
| (degr) | () | (K) | (mas) | (year) | |||
|---|---|---|---|---|---|---|---|
Note. — The physical parameters of the third body are based on nongray dusty models of Chabrier et al. (2000), assuming the age of the system of 625 Myr and the dystance of 46.8 pc. designates maximum apparent separation between the V471 Tau binary and the third component. is the time of the nearest maximum separation.