The polar ring galaxy AM1934-563 revisited 00footnotemark: 0††thanks: Based on observations obtained with the Southern African Large Telescope (SALT).
Abstract
We report long-slit spectroscopic observations of the dust-lane polar-ring galaxy AM1934-563 obtained with the Southern African Large Telescope (SALT) during its performance-verification phase. The observations target the spectral region of the H, [N ii] and [S ii] emission-lines, but show also deep Na I stellar absorption lines that we interpret as produced by stars in the galaxy. We derive rotation curves along the major axis of the galaxy that extend out to about 8 kpc from the center for both the gaseous and the stellar components, using the emission and absorption lines. We derive similar rotation curves along the major axis of the polar ring and point out differences between these and the ones of the main galaxy.
We identify a small diffuse object visible only in H emission and with a low velocity dispersion as a dwarf H ii galaxy and argue that it is probably metal-poor. Its velocity indicates that it is a fourth member of the galaxy group in which AM1934-563 belongs.
We discuss the observations in the context of the proposal that the object is the result of a major merger and point out some observational discrepancies from this explanation. We argue that an alternative scenario that could better fit the observations may be the slow accretion of cold intergalactic gas, focused by a dense filament of galaxies in which this object is embedded.
Given the pattern of rotation we found, with the asymptotic rotation of the gas in the ring being slower than that in the disk while both components have approximately the same extent, we point out that AM1934-563 may be a galaxy in which a dark matter halo is flattened along the galactic disk and the first object in which this predicted behaviour of polar ring galaxies in dark matter haloes is fulfilled.
keywords:
galaxies: ring galaxies — galaxies: evolution — galaxies: individual: AM1934-563 — galaxies: dark matter — galaxies: galaxy haloesIntroduction
Ring galaxies posed significant astronomical interest since Lynds & Toomre (1976) modelled the Cartwheel galaxy as the result of a small galaxy passing through a larger one. While such events probably happen and produce some of the ring galaxies, in other instances different mechanisms might be at work. A particularly interesting kind of ring galaxy is the polar ring galaxy (PRG) where a flattened disk galaxy exhibits an outer ring of stars and interstellar matter that rotate in a plane approximately perpendicular to the central disk. An extensive catalog of PRGs was produced by Whitmore et al. (1990).
The issue of PRGs was reviewed by Combes (2006). She reviewed a number of formation mechanisms for PRGs: minor or major mergers, tidal accretion events, or direct cold gas accretion from filaments of the cosmic web. Combes (2006) proposed that these objects can be used to probe the three-dimensional shape of dark matter (DM) haloes, provided the PRG is in equilibrium in the gravitational potential.
The well-known Spindle Galaxy (NGC 2685), an archetypal PRG, exhibits two sets of rings: an outer one visible only on HI maps and which might be in the plane of the galaxy, and an inner one that is helix-shaped, is perpendicular to the main axis of the galaxy, is optically bright, shows embedded present-day star formation, and is associated with prominent dust lanes. Shane (1980) explained the system as consisting of a lenticular galaxy that recently accreted an HI gas cloud that formed the inner ring, while the outer gas ring might be a remnant of the formation of the galaxy. Hagen-Thorn et al. (2005) found that the stellar population of the inner system of dust and gas, arranged in a spiral around the ”spindle” but really in a disk, is 1.4 years old.
In a different ring galaxy, NGC 660, Karataeva et al. (2004) detected red and blue supergiants belonging to the ring system. They showed that the age of the youngest stars there is only 7 Myr; thus star formation is currently taking place. N660 is special in that both the disk and the polar ring contain stars, gas and dust. Reshetnikov (2004), who analyzed three other ring galaxies, showed that their rings result from ongoing interactions or mergers where the main galaxy is a spiral and the rings are currently forming stars.
Other claims of interactions being at the origin of the rings and of the star formation taking place therein have been put forward by Mayya & Korchagin (2001, revised 2006). On the other hand, others claimed that rings are formed as a dynamical event in a larger disk galaxy (e.g., Mazzuca et al. 2001). It is clear that more studies of ring galaxies, and in particular such investigations that can time the ring and star formation events, can help understand the particular instances when a galaxy-galaxy interaction took place, when a ring is formed, and when the event does trigger the SF process. There is also the possibility that careful tracing of the polar ring and of the galaxy itself, and their kinematic properties, might reveal the DM halo shape and properties, as advocated by Combes (2006). This singles out PRGs as valuable targets for DM studies.
In this paper we analyze new observations of the polar-ring galaxy AM1934-563, a PRG with an optical redshift of 1164910 km sec-1 located at l=341.02, b=-28.73, also identified as PRC B-18 in Whitmore et al. (1990). The object was recently studied by Reshetnikov et al. (2006), who showed that this is a giant galaxy in a compact triplet, together with PGC 400092 (classified Sd/Irr:) and PGC 399718 (classified SBc:) at approximately the same redshift. The authors used the 1.6-meter telescope of the Pico dos Dias Observatory in Brazil for imaging in BVRI, the CTIO 1.5-meter telescope to collect spectral observations, and included data from IRAS and 21-cm line observations. However, most of their conclusions about the nature of the object rely on the morphological appearance of the galaxy.
Reshetnikov et al. (2006) modelled AM1934-563 using an N-body code that includes gas dynamics using sticky particles and star formation. They concluded that the best-fitting model is of a major merger, whereby a gas-rich galaxy transferred a sizable amount of matter to AM1934-563 during a parabolic encounter. The matter subsequently relaxed and now forms a complete ring of stars, gas, and dust around AM1934-563 whereas the donor galaxy is one of the two other galaxies in the same group.
The reason to revisit this object was the availability of high-quality spectra obtained with the effectively 8-meter diameter Southern African Large Telescope (SALT) telescope. We derive, for the first time, rotation curves for the ionized gas and for the stellar components of both the main galaxy and the polar ring. Since PRGs might make good test cases for the properties of dark matter haloes in and around galaxies, as argued by Combes (2006), the more observational data collected on these objects and with higher quality, the better.
Very few PRG observations obtained with large telescopes have been published. A noticeable one is by Swaters & Rubin (2003), with the Baade 6.5-meter telescope on Las Campanas, tracing the dynamics of the stellar component of the prototype PRG NGC 4650A where they showed that the polar ring is actually a polar disk, an extended feature rather than a narrow gas disk. They favour a scenario by which the ring/disk was formed by the polar merger to two similar disks, as previously suggested by Iodice et al. (2002). Iodice et al. (2006) observed the gaseous component in the ring of N4650A with ESO’s FORS2 on UT4 and concluded that a scenario by which it could be formed was through slow gas accretion from the cosmic web filaments. We propose that the same situation could be taking place for AM1934-563.
This paper is organized as follows: § 1 gives a description of all the observations and data reduction. In § 2 we present our results, analyze them in § 3, and present our interpretation in § 4. The conclusions drawn from this study are summarized in § 5.
| Date | Exp.time | Spec. Range | Slit | PA | Disp. |
|---|---|---|---|---|---|
| (sec) | (Å) | (″) | (∘) | (Å/pix) | |
| 16.07.2006 | 2600 | 3650–6740 | 1.5 | 140 | 0.98 |
| 16.07.2006 | 1600 | 3650–6740 | 1.5 | 35 | 0.98 |
| 20.09.2006 | 2900 | 6050–7315 | 1.5 | 140 | 0.40 |
| 20.09.2006 | 1750 | 6050–7315 | 1.5 | 27 | 0.40 |
| 21.09.2006 | 3900 | 6050–7315 | 1.5 | 27 | 0.40 |


1 Observations and data reduction
SALT was described by Buckley et al. (2006) and by O’Donoghue et al. (2006), its Robert Stobie Spectrograph (RSS) was described by Burgh et al. (2003) and Kobulnicky et al. (2003), and the first scientific papers based on its observations were published by Woudt et al. (2006) and by O’Donoghue et al. (2006). We used the SALT and RSS to observe AM1934-563. The observations of AM1934-563 were obtained during the Performance Verification (PV) phase of the SALT telescope with the RSS spectrograph and are described in Table 1.
The July 2006 spectra (see Table 1) were obtained during unstable weather conditions (high humidity, seeing worse than 5″), without fully stacking the SALT mirrors. They cover the range 3650–6740 Å with a spectral resolution of 1.0 Å pixel-1 or a FWHM of 6–7 Å. These spectra do not show strong and extended emission lines but were used to measure equivalent widths (EWs) of absorption lines in that spectral range following observations.
The spectra obtained on the nights of September 2006 were taken during stable weather conditions with seeing 15. They cover the range from 6050Å to 7300Å with a spectral resolution of 0.4 Å pixel-1 or 2.4 Å FWHM. All data were taken with a 15 wide slit and a final scale along the slit of 0258 pixel-1 (after binning the CCDs by a factor of two). Each exposure was broken up into 2–3 sub-exposures to allow the removal of cosmic rays. Spectra of a Cu–Ar comparison lamp were obtained after the science exposures to calibrate the wavelength scale.
The September 2006 data include two spectra obtained at position angle 140∘ centered on AM1934-563 extending about four arcmin along the galaxy’s major axis and at a shallow angle to the dust lane, where the northern part passes also through the “northwest companion” PGC 400092 (Reshetnikov et al., 2006), and three spectra centered on the same position but obtained at position angle 27∘, along the major axis of the ”polar ring” described by Reshetnikov et al. (2006). We emphasize that the sampling of the major axis spectra was at PA=140∘, not at 130∘ as done by Reshetnikov et al. (2006), since 140∘ is closer to the position angle of the disk as given by Reshetnikov et al. (148∘) and allows for a moderate degree of disk warping.
Although the observations discussed here are mostly spectroscopic, one image of the galaxy was obtained with a two-sec exposure in the V filter with the SALTICAM camera (O’Donoghue et al. 2006) prior to the spectrometer observations in order to adjust the slit orientation, and is shown here as Figure 1. The 15 seeing during the observations, and the problematic image quality SALT exhibited at that time, which can be evaluated from the stellar images on Figure 13 (see below), caused the images far from the good-quality 3 arcmin region to assume complicated shapes. The full SALTICAM image is 10 arcmin across with 0.28 arcsec/pixel (after binning on-chip by a factor of two).
The data for each RSS chip were bias and overscan subtracted, gain corrected, trimmed and cross-talk corrected, sky-subtracted and mosaiced. All the primary reduction was done using the IRAF111IRAF: the Image Reduction and Analysis Facility is distributed by the National Optical Astronomy Observatory, which is operated by the Association of Universities for Research in Astronomy, In. (AURA) under cooperative agreement with the National Science Foundation (NSF). package salt222See http://www.salt.ac.za/partners-login/partners/data-analysis-software for more information. developed for the primary reduction of SALT data. Cosmic ray removal was done with the FILTER/COSMIC task in MIDAS.333MIDAS is an acronym for the European Southern Observatory package – Munich Image Data Analysis System. We used the IRAF software tasks in the twodspec package to perform the wavelength calibration and to correct each frame for distortion and tilt. One-dimensional (1D) spectra were then extracted using the IRAF APALL task.
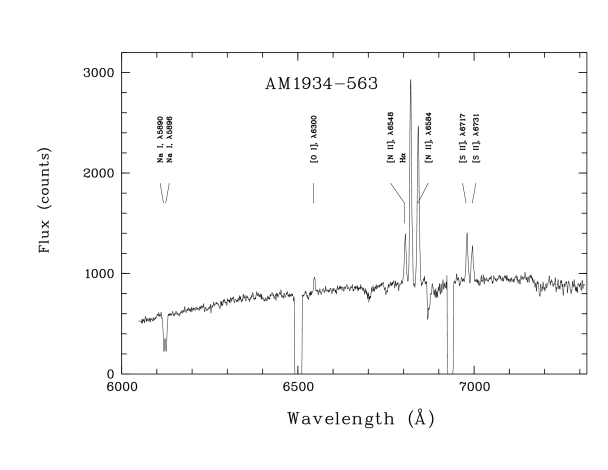
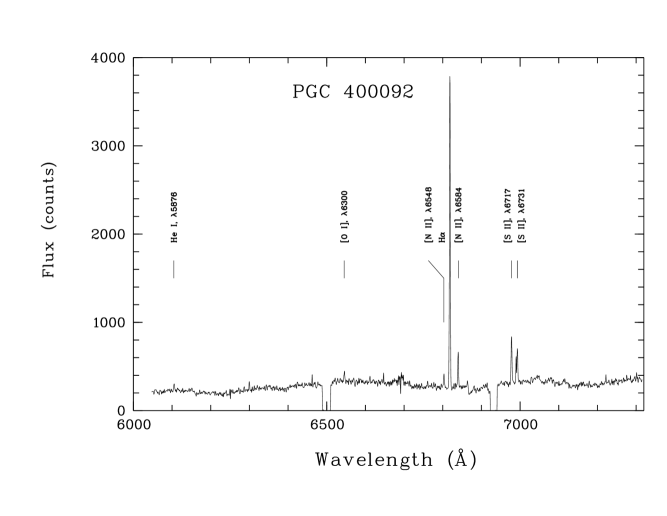
Figures 3 and 4 show parts of fully reduced and combined spectral images for PA=140∘ and PA=27∘, respectively. Figure 5 shows the spectrum of the central part of AM1934-563. The 40Å missing sections at 6500 and 6930Å are produced by small gaps between the three CCDs of the RSS. The noisy region of the RSS images shown in Figs. 3 and 4 near 6685Å is a subtraction artifact of laser light scattered into the RSS from SALT’s interferometric auto-collimating system. Figure 5 shows the 1D spectra of the central part of AM1934-563 extracted from the 2D spectra. Figure 6 shows the 1D spectrum of the galaxy PGC 400092 extracted from the 2D spectrum observed at PA=140°.
The derived internal errors for the 2D wavelength calibrations were small and did not exceed 0.04 Å for a resolution of 0.4 Å pixel-1, or 2 km s-1 at the wavelength of redshifted H line. To exclude systematic shifts originating from known RSS flexure, we calculated line-of-sight velocity distributions along the slit for both emission and absorbtion lines using a suite of MIDAS programs described in detail in Zasov et al. (2000). These programs allow the use of additional correction factors derived from tracing nearby night-sky lines whose accurate wavelengths are very well known to correct the observed wavelengths of the Na I D, H [N ii] 6583 and [S ii] 6716 emission lines. After implementing the night-sky line corrections, the line-of-sight velocity distributions are accurate to 1.5 km s-1. Most of the calculated velocity distributions are shown in Figures 8–12. All velocities derived with this procedure are heliocentric.
All emission lines were measured with the MIDAS programs described in detail in Kniazev et al. (2004, 2005). These programs determine the location of the continuum, perform a robust noise estimation, and fit separate lines with single Gaussian components superposed on the continuum-subtracted spectrum. Nearby lines, such as the H and [N ii] 6548, 6583 lines on the one hand, the [S ii] 6716, 6731 lines on the other, and Na I D 5890, 5896 absorption doublet were fitted simultaneously as blends of two or more Gaussian features.

2 Results
2.1 Spectra of AM1934-563 and PGC 400092
A cursory inspection of the spectra obtained at PA=140∘ (see Figure 3) shows rotation detectable in the same amount and behaviour exhibited by the H, [N ii] 6548,6583 and [S ii] 6716,6731 emission lines, and rotation as almost a solid body exhibited by the Na I 5890,5896 doublet lines. The NE extension of the spectrum, away from AM1934-563 and crossing the companion galaxy PGC 400092, shows that the same emission lines seen in AM1934-563 are produced by the NE companion; the rotation there is much slower and the Na I doublet is not visible, even though the continuum there is visible. In addition, the spectrum of PGC 400092 shows also weak [O i] 6300 and HeI 5876 in emission, while the spectrum of AM1934-563 shows [O i] 6300 emission only in the central part.
| Absorption Line | Equivalent Width |
|---|---|
| (Å) | (Å) |
| CaII H | 8.91.5 |
| CaII K | 10.31.8 |
| H | 6.52.1 |
| H | 5.82.4 |
| H | 6.42.5 |
| Mg I b | 3.50.8 |
| Na I D | 5.80.7 |
The short-wavelength spectra obtained in June 2006 (top panel of Fig. 5) show the blend of the Na I doublet as a single line (due to the lower resolution of this setup), and the H, H and H lines in absorption. The CaII H and K doublet is seen in absorption at the blue end of the spectrum. The spectra also show very weak [O iii] 4959, 5007 emission lines. In this figure and in the following plots we describe as ”intensity” the raw counts extracted from the spectra. Since our data have not been spectrophotometrically calibrated, this is in reality ”relative intensity”. The equivalent widths of the main absorption lines were measured for the central part of the galaxy and are shown in Table 2. Measurements of lines detected in more than one spectrum were averaged.


The rotation curve of AM1934-563 along the major axis, derived from the two-spectra combination shown in Figure 3, is shown in Figures 8 and 9. Figure 8 show the velocity-position plot and Figure 9 shows the galacto-centric velocity-distance plot. In general, the emission-line rotation curve derived here corresponds with that shown in Figure 5 of Reshetnikov et al. (2006), except that ours is better sampled, has a higher signal-to-noise, and the rotation curves derived from the different emission lines practically coincide, as can be estimated from the formal 1 error bars plotted in the figures and from the scatter of the individual points. Figure 9 shows also a comparison of our measurements with those of Reshetnikov et al. (2006).
Deriving the rotation curves shown in Figures 8 and 9 we found that the systemic radial velocity of AM1934-563 is 116633 km sec-1, formally higher by some 14 km sec-1 than the value given by Reshetnikov et al. (2006) in their Table 3 but consistent with their value within the quoted uncertainties. This offset might be the result of a slightly different definition of the systemic velocity; we chose the value for which the NW branch of the rotation curve matched best that for the SE branch and by this procedure also found the rotation center of the galaxy. Independently, we found that this location on the velocity curve is also the central point for the linear fitting of all the measurements for the Na I D lines seen in absorption, as shown in Figure 8. We obtained a best-fit line following the relation:
| (1) |
where is the distance in arcsec from the point where the radial velocity of AM1934-563, defined using the emission lines, equals 11663 km sec-1 and we adopt this location as the kinematic centre of the galaxy. The different symbols indicate the H velocity (black squares), the [N ii] 6583 line velocity (red squares), and the [S ii] 6716 line velocity (blue triangles). The stellar rotation along the same slit position on the major axis, as derived from an average of the two Na I absorption lines, is depicted as filled black circles.
We detected a discrepant systemic velocity 1168010 km sec-1 for the NW companion PGC 400092 as well, where our value is significantly lower than the 117356 km sec-1 given in Reshetnikov et al. (2006). Since the velocity discrepancies for AM1934-563 and for PGC 400092 are in opposite directions, we can probably rule out a systematic shift between our velocity scale and the one of Reshetnikov et al. (2006). This is confirmed also by the plot in Figure 9 where their derived velocity curve points are plotted over our results. The shift between our data for PGC 400092 and that from Reshetnikov et al. (2006) could be the result of the slit position for used here that did not cross exactly the physical center of that galaxy.
We could also derive the velocity dispersion of the H line along the slit for ; this is shown in the bottom panel of Figure 9. The dispersion is shown as the FWHM of the line after correcting for the intrinsic spectrometer line width. The corrected H line FWHM=5–7 Å found for the central part (3 arcsec) of AM1934-563 indicates internal motions of 200–300 km s-1. The corrected FWHM=1 Å measured for the H line of PGC 400092 indicates internal motions slower than 45 km s-1.
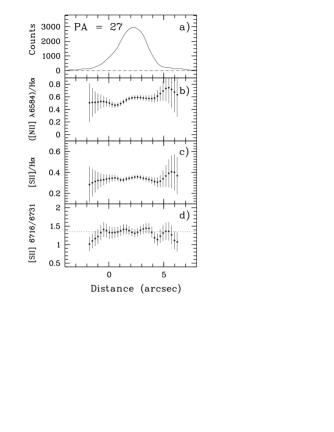
The rotation curve along the polar ring axis, at , is shown in Figure 12 as a velocity-position plot. This, as already mentioned, relies mostly on the emission lines since the Na I absorptions are visible only in the central part of the spectrum, and is therefore more limited in extent. The spectra for show a linearly increasing rotation for 7″ SW of the galaxy centre outwards, where the center position is that derived for the major axis. Since the NE and SW branches of the ring’s major axis show very different behaviour from that observed along the galaxy’s major axis, the method used previously to find the rotation center by matching the two branches could not be used in this case, thus we do not show a folded and combined velocity curve for the major axis of the ring.
The NE branch shows an approximately flat rotation from 2″ away from the centre, as derived from the emission lines, with some oscillations from the center to the periphery at 10 arcsec from the center. These oscillations are evident in both H and [N ii] 6583; they may be caused by the overlap of the emission lines from the ring with those from the main body of the galaxy. The plot in the top panel of Fig. 12 shows that the strongest H emission is encountered close to the location of the most intense continuum contribution (compare the solid and the dashed lines).
Our spectra along show a completely different kinematic behaviour than the one described by Reshetnikov et al. (2006). Their Fig. 7 shows a 50 km sec-1 difference between the velocity of the [N ii] 6583 and H at the galaxy centre that increases to 100 km sec-1 at the SW end of the ring. We, on the other hand, see no difference between the velocities of these two lines. Moreover, the [S ii] lines in our observed spectrum also show the same behavior as the [N ii] 6583 and H lines. We also note that the extent to which the rotation is defined and measurable for this position angle and using the emission lines is practically the same as for the major axis of AM1934-563 , some 8 kpc from the center (at 167 Mpc).
Similar to the case of the major axis, , we see here also a straight-line behaviour with galacto-centric distance of the Na I absorption lines. We find a formal linear fit of the form
| (2) |
The Na I rotation curve is linear from 15 SW of the centre to 5” NE of the kinematic centre. Note that the value found for the slope at this position angle is virtually identical with that for the major axis in equation (1).
A comparison of the two panels of Fig. 12, the lower one which is a velocity-position plot for and the upper one which is a plot of the line intensity vs. position along the slit, shows that the region where most of the line emission is produced is about 4″ to the NE of the kinematic center of AM1934-563 and that the emission is practically only along the NE part of the ring.
As for , we derive the velocity dispersion for this position angle as the FWHM of the H line vs. galacto-centric distance. This is shown in the bottom panel of Fig. 10 after correction for the intrinsic width of the lines using the night sky spectrum. The corrected FWHM=7 Å for the redshifted H indicates internal motions of 300 km s-1.
Although not spectrophotometrically calibrated, our spectra allow the derivation of a few physical parameters of the gas using line ratios. The good signal-to-noise of the spectra allows the derivation of these ratios along the slit, as shown in Figs. 7 and 11. The ratios plotted in Fig. 7 allow a derivation along the galaxy major axis and for its NW companion. Since these ratios are based on the very closely located emission lines, they practically do not depend on whether the spectral data were corrected for sensitivity or not. For the red spectral range, using the sensitivity curve cannot change these ratios by more that a few percent; this is less than the displayed errors.
Creating these ratios we took into account the possible stellar absorption in the H line. Checking Table 2, and considering the Balmer spectra of González-Delgado et al. (1999) we suggest that EWabs(H)=6 Å with a constant value along the slit. Since EW(H)15Å for the emission line at the center of AM1934-563 , decreasing to the galaxy’s edges, this correction is very important and without it the ratios of [N ii]/H and [S ii]/H would increase from the AM1934-563 centre to the edges. That could be interpreted as an increase in of metallicity with galacto-centric distance, which is not correct. With a measured line ratio for the central part of AM1934-563 (2 arcsec) =0.540.02, the metallicity in the center of AM1934-563 is 12+log(O/H)=8.920.06 dex (Denicoló et al., 2002) and drops down to 8.810.07 in the outer parts of the galaxy. The figure indicates that along the major axis of the AM1934-563 galaxy n50 cm-3. The measurements for detected part of PGC 400092 give 12+log(O/H) = 8.450.12 dex and n 500 cm-3.
In a similar way, we derive the gas properties along the major axis of the ring (see Fig. 11). With the line ratios measured in the central part of AM1934-563 (2 central arcsec) =0.510.04, the metallicity in the center of AM1934-563 is 12+log(O/H)=8.910.06 (Denicoló et al., 2002), essentially the same value found from the major axis measurement. From the measured [S ii] lines ratio we obtain the same value found previously: n 50 cm-3.
2.2 Newly detected H emission knot
An isolated H emission knot was detected at = 19h38m42s.7; = 56∘:26’:18”, some 78″ away from the main body of the galaxy to the NE and on the extension of the ring’s major axis. This knot is real and was detected on all spectra observed at taken on 2006 September 20 and 21. The velocity distribution with distance is shown in the top panel of Figure 10. It is evident that the line emitting knot is fairly isolated and is very distant from the galaxy, yet its radial velocity is close to that of the AM1934-563 systemic velocity. The measured velocity for the knot is 116455 km sec-1; this is more than three standard deviations away from the systemic velocity of AM1934-563 and very many standard deviations away from the recession velocity measured for H at the NW tip of the galaxy. It is also very different from the velocity of PGC 400092, the NW companion of AM1934-563 , or from that of PGC 399718, the other companion in the triplet.
Our observations do not show a significant velocity dispersion of the H line observed from the knot, as shown in the bottom panel of Fig. 10; a formal measurement indicates that this H line has the same FWHM (2.4 Å) as the reference night-sky line. The corrected FWHM1 Å for the redshifted H from the knot indicates internal motions slower than 40 km s-1. The size of the line-emitting region is only 5 arcsec; small, but well-resolved by our observations. The very weak continuum is detected; this allows a measurement of EW(H) = 12015 Å. No additional emission lines are visible in the spectrum.
3 Analysis
The image of the field displayed in Figure 1 shows not only AM1934-563 but also its two companion galaxies. Fig. 1 is a V-band image of the field obtained with SALTICAM in the same night as the spectroscopic observations on September 21. The image of the three galaxies allows one to note that (a) the region around the target contains many diffuse, low surface brightness (LSB) images that might be parts of galaxies or LSB dwarfs at the same redshift, or distant objects in the background, and (b) the appearance of the companion galaxy PGC 400092 to the NW is that of a Sd galaxy with a similar overall size to that of AM1934-563 . The LSB objects are also visible on Digitized Sky Survey images of the region.
We performed unsharp masking of Figure 1 to emphasize the dust lane; this is shown in Figure 13 and, contrary to the claim of Reshetnikov et al. (2006) that the dust lane is split and embraces the galaxy nucleus from SE and NW, indicates that the lane is fairly straight, passes south and west of the brightest part of the galaxy, and is probably not split at all. The stars in Fig. 13 have the shapes of crescent moons. This arises from telescope optical problems which are being ironed out during the Performance Verification process, and have been emphasized by the unsharp masking.
The measured ratio of emission lines to corrected H, and the possibly very weak [O iii] 5007 emission detected in our July 2006 short-wavelength spectra, puts this object at the border between starburst nuclei (SBN) and LINERs. Norris et al. (1990) found no compact radio core in this galaxy and for this reason it should be classified as SBN; this is in agreement with the previous conclusions of Allen et al. (1991).
The curves shown in Fig. 9 indicate that the gas rotation along the major axis has its maximum at 240 km sec-1 and not at 195 km sec-1 as given by Reshetnikov et al. (2006), and that this maximum is reached asymptotically for the NE part of the galaxy. Figire 8 shows that our measurements are compatible with those of Reshetnikov et al. (2006) for the regions of overlap. The last points of the rotation curve branch of the SE part of the galaxy, from galacto-centric distance of 6″ to 10″ , drop from 2007 km sec-1 to 1507 km sec-1 in both H and [N ii] 6583 lines. This drop is gradual from 6″ to 8″ but shows a step-like drop at this location, followed by a recovery with a similar distance-velocity gradient as for the central part of the galaxy.
A comparison of the major axis rotation curves shown in Fig. 9 shows clearly the difference between the kinematic behaviour of the two Na I D absorption lines and the H, [N ii] 6583 and [S ii] 6716 emission lines. At this point it is worth discussing the origin of the Na I absorption lines. These could be produced by stellar photospheres, or by diffuse gas in the interstellar medium of AM1934-563 . For the case of dwarf starburst galaxies, Schwartz & Martin (2004) used giant and supergiant stars to show that the EW of the Mg I triplet near 5180Å should be twice that of the Na I lines. If this would be the case for AM1934-563 then our blue spectrum where the Mg I triplet is barely visible would rule out a major Na I absorption contribution from stars.

However, in giant galaxies such as AM1934-563 the stellar populations are better represented by main sequence stars. These have stronger photospheric Na I than Mg I (e.g., a M0V star from the same library as used by Schwartz & Martin (2004) has EW(Mg I)=20Å and EW(Na I)=12Å . While it is not possible to separate the stellar Na I from the interstellar absorption, we can accept that at the least a fraction, and perhaps all of the observed absorption represents the stars in the galaxy. For example, in M82 Saito et al. (1984) detected Na I absorption that they attributed to stars and interpreted as solid-body rotation.
Assuming that most of the Na I absorption is photospheric, this would indicate that, while the gaseous component follows a “normal” galactic rotation law, the stellar component rotates almost like a solid body for 10″ away from the centre. The maximal rotation velocity exhibited by the stellar component is only 150 km sec-1 at 10″ from the centre for both ends of the major axis.
The extent over which the emission is observed for the “polar ring” is almost the same as for the major axis, some 18″ overall as shown in Fig. 12, but the derived rotation curve is completely different. The rotation curve indicates solid-body like rotation for 15 to the NE (one resolution element away from the centre, given the seeing) and for about 5″ to the SW. The velocity difference between the outermost points on the slit where the absorption lines are measured is only 90 km sec-1. The velocity gradients shown by the stellar components along the major axis of the galaxy and along the axis of the PR, in regions where a linear rotation curve can be defined, are very similar as equations (1) and (2) show. In both cases the gradients are 19 km sec-1 kpc-1, where we converted the observational gradients from equations (1) and (2) to physical units.
4 Interpretation
At a distance to the object of 167 Mpc (H0=70 km sec-1 Mpc-1) the radius of the galaxy to the outermost point where emission lines are visible is 8 kpc. We found the stellar component of a 16 kpc wide galaxy rotating as a solid body, while its gaseous component measured at the same slit position shows a smoothly increasing rotation curve which then flattens out. A ring or disk feature with an extent similar to that of the galaxy is observed at an inclination of 60∘ to the major axis of the galaxy. The stellar component observed with the spectrometer slit oriented along the major axis of the ring is also rotating as a solid body and with a similar velocity-distance gradient to that observed for the main body of the galaxy.
Reshetnikov et al. (2006) concluded from their photometry and spectroscopy, coupled with results of N-body modelling, that AM1934-563 is a PRG. Their models indicate that the system might be the result of a major interaction between a ”donor” galaxy with a 17 kpc stellar disk and a 42 kpc gaseous disk, with a total mass of 3.6 M⊙, which encountered a 2 M⊙ and 14 kpc wide ”receptor” galaxy some 1.6 Gyrs ago with an impact parameter of 130 kpc and a relative velocity of 145 km sec-1. This encounter transferred a large quantity of matter (stars, gas, and dust) from the donor to the receptor galaxy resulting in the formation of the polar ring which is inclined with respect to the galaxy disk and is warped. Reshetnikov et al. (2006) suggested that the donor galaxy survived and is PGC 399718, the southern companion in the triplet, and argued that their suggestion is supported by the reddish (B-V) colour of the galaxy and by its somewhat disturbed appearance.
In selecting this scenario in preference to those of minor mergers calculated by them, or of other possible models for the formation of ring galaxies, Reshetnikov et al. (2006) relied primarily on the morphological appearance of the galaxy. In particular, the minor merger models rejected by Reshetnikov et al. (2006) produced only partially-open rings that were not closed, whereas the preferred major merger model produced a “closed and regular ring” a few 108 years following the interaction.
Since the acceptance of the Reshetnikov et al. (2006) scenario as the explanation for the appearance of this system relies on their interpretation that the ring is closed and regular, it is worth examining whether the observations presented here support this assertion.

The specific items resulting from our observations that require understanding are:
-
1.
Solid-body rotation is observed for stars vs. a ”regular” rotation for the gas at the same (projected) locations. No differential rotation, as expected from a stellar disk, is observed. This is true for the main body of the galaxy as well as for the ring, though with the gas showing a different distance-velocity gradient than the stars.
-
2.
The ring is very faint and there is no evidence that it contains a considerable number of stars, as would be expected from the major merger claimed by Reshetnikov et al. (2006). Our observations of the intensity distribution along the slit at PA=27∘ show that the stars producing the continuum are located mostly where the HII is, namely some 2-5″ NE of the centre.
-
3.
The ring dynamics are different at its SW end, where the line and continuum emissions are very weak and the ring is more extended (Reshetnikov et al., 2006), in comparison with the other end of the ring.
-
4.
The gas dynamics for the ring are very different from those of the gas in the galaxy. Specifically, at similar extents from the dynamical centre the gas in the ring spins much slower than the gas in the galaxy. This, while the stellar components have similar kinematic behaviours as evaluated from the velocity-distance gradients.
Apparent solid-body rotation of a galaxy could be produced, for example, by dust extinction. Baes et al. (2003) modelled the light propagation through a dusty galactic disk and showed that, unless the disk is perfectly edge-on, no effects in the kinematics would be observable. The more the disk is edge on, and the stronger the extinction caused by the dust in the disk is, the more would the rotation curve resemble that of a solid body. Perusal of the DSS images of the object, of the image shown in Fig. 1 of Reshetnikov et al. (2006), and of our Figs. 1 and 13, shows that AM1934-563 is not a purely edge-on galaxy and that, since the disk deviation from edge-on is definitely more than “a few degrees” but rather 25∘, as explained below, we should not expect to see a solid-body rotation just because of dust obscuration and light scattering. We can, therefore, reject the possibility that the solid-body rotation is an effect of dust obscuration.
4.1 Stars vs. gas in the disk
The key observation reported here is the difference in rotation curves between the emission lines produced by the gas and the stars as represented by the absorption lines. Such cases of different kinematic behaviour of the gas and the stars are known in the literature, e.g., Bettoni et al. (1990), where NGC 2217 was shown to exhibit “counter-rotation” in that the gas motions in the inner parts of the galaxy indicated motions opposite those of the stars. This was interpreted there as a consequence of a warp in the disk coupled with the presence of a bar; this situation may exist for AM1934-563 as well.
Macciò et al. (2006) tried to explain the origin of PRGs by accretion of cold intergalactic gas. They provide in their Fig. 4 plots of simulated velocity-position diagrams for gas and stars; the upper one, where the slit is aligned with the major axis of the galaxy, can be compared with our Figs. 8 and 9. It seems that the presence of a stellar bar in AM1934-563 could be producing the linearly-rising stellar rotation curve, whereas the rotation curve for the gas fits the simulation quite well.
Since none of our observations are of photometric-quality, we rely on parameters derived by Reshetnikov et al. (2006) to characterize the galaxy. In particular, we adopt their photometric disk parameters: a disk exponential scale length h(B)=5”.10”.3=3.8 kpc and their scaling to other bandpasses: h(B)/h(V)=1.180.11 and h(B)/h(R)=1.250.12. The R-band disk scale length is, therefore, 4.80.5 kpc. This is useful when comparing with properties of other galaxies or of model galaxies.
To compare with the rotational properties of other galaxies, we use the observations of edge-on galaxy disks from Kregel et al. (2004) for the stellar kinematics and from Kregel & van der Kruit (2004) for the gas kinematics. Fig. 6 in Kregel et al. shows that the stellar rotation curve can be almost linear with galacto-centric distance for about 1.5 disk scale lengths and this for galaxies earlier than Sbc. Note that this galaxy sample does not include barred galaxies, though Kregel et al. mention that some do show boxy or peanut-shaped bulges. The gas in none of their galaxies (Kregel & van der Kruit 2004) rotates with as small a gradient with distance from the center as observed in AM1934-563.
It is also possible to compare both the imaged galaxy and its stellar kinematics with the diagnostic plots calculated by Bureau & Athanassoula (2005). Inspection of their Figs. 1 and 4 indicates that a good fit with AM1934-563 could be obtained for an intermediate or strong bar viewed at least at 45∘ to the bar or even edge-on, and at a disk inclination of at least 80∘ to the line of sight. The conclusion is that AM1934-563 does probably have a fairly strong bar that is almost side-on to our line of sight, and its disk is seen almost edge-on.
Another comparison for our rotation curve is with the collection of template rotation curves of Catinella et al. (2006) who, however, studied normal galaxies, not PRGs. They normalize the rotation curves between 2 and 3 disk radii; applying this to AM1934-563, with the peak rotation derived from the curve, indicates that the galaxy should have an absolute I-band magnitude brighter than –23 mag. Indeed, using the photometry from Reshetnikov et al. (2006), with a measured M–21 mag and a color index (B-I)=2.06, the absolute I magnitude of AM1934-563 is –23.06 mag. This confirms the assumption that, in analyzing the gaseous rotation curve along the major axis, it is a valid assumption to adopt the rotation pattern of a regular galaxy, not that of a PRG, since the presence of the polar ring does not affect significantly the kinematics of the galaxy.
4.2 HI vs. other kinematic indicators
The HI in a number of PRGs, including AM1934-563, was studied by van Driel et al. (2002) with the Parkes radio telescope. This observation produced a puzzling and troublesome result for AM1934-563 ; van Driel et al. reported the HI line at a heliocentric velocity of 1128224 km sec-1 with a full-width at half-maximum of the two-horned profile of 193 km sec-1. Note that their data were taken with the Parkes multibeam system, which implies a beam width of 144 FWHM. The 12500 km sec-1 bandwidth was centered at 10000 km sec-1 and the channel separation was 6.6 km sec-1.
If the HI would have been associated with AM1934-563 , we would expect to find the neutral hydrogen line at a similar systemic velocity to that measured here, that in Reshetnikov et al. (2001), or that measured by Reshetnikov et al. (2006). We would also expect a much wider HI profile than quoted by van Driel et al. (2002), since the H kinematics indicate a width of 450 km sec-1 along the major axis, as befitting a major galaxy given its bright absolute magnitude of MB=–21.1 measured by Reshetnikov et al. (2006). The very wide Parkes beam implies that all three objects were included in the measurement, and probably many outlying HI clouds that may exist in this neighbourhood as well, but does not explain the velocity discrepancy since all three galaxies should have appeared on the red shoulder of the HI profile shown by van Driel et al.
Another indication that something is wrong with the HI measurement comes from applying the Tully-Fisher relation to AM1934-563 . Combes (2006) gives a Tully-Fisher diagram for PRGs in Fig. 2 of her paper; these galaxies seem to follow the T-F relation for spirals and S0 galaxies and it is worthwhile to check where AM1934-563 fits in this diagram. Adopting the HI width given in van Driel et al. (2002) indicates that AM1934-563 should have an M–18 mag, completely different from the magnitude measured by Reshetnikov et al. (2006). Adopting a velocity width as measured by us albeit from the emission lines and not from the HI profile, namely 450 km sec-1, yields the proper value of M–21 mag.
Irrespective of the explanation regarding the HI redshift discrepancy, it is possible that extended HI is present in the system. The possibility that such HI clouds or other gas-rich galaxies might be present is supported by our discovery of the H knot (see below), and by the presence of a few low surface brightness (LSB) extended objects in the immediate vicinity. These resemble LSBs the nearby Universe that are often found to be very gas-rich. In addition, there are a few very blue star-like objects that stand out in comparisons of the Second Digitized Sky Survey images in different bands.
We do not have redshifts for these LSB objects but the fact that they are of similar sizes to the main galaxies in the AM1934-563 group hints that they might be group members; such companions are seen in other groups as well (e.g., Grossi et al. 2007) and could have interacted with AM1934-563 in the past. We predict that once HI synthesis observations will be obtained for AM1934-563 and its neighbours, for example with the ATNF, at least some of these candidates and in particular the H knot discovered by us will prove to be actually gas-rich members of this group.
4.3 The H knot
The H knot reported above, which is 78 arcsec away to the NE from the galaxy center but almost at the same velocity, is in reality 630 kpc away in projected distance. Its detectable H emission, combined with a lack of [N ii], [S ii] and only weak continuum emissions, argue that this is probably a metal-poor dwarf galaxy that belongs to the same group as AM1934-563 . Such objects are known as ”HII galaxies” (Sargent & Searle 1970) since they show an HII region spectrum with negligible continuum and have considerable redshifts.
Our fitting procedure to the emission lines, used for the galaxies and for the ring, allows the derivation of an upper limit for the [N ii] 6583 flux that can be used to obtain an upper limit to the metal abundance. With a measured upper limit line ratio of the metallicity upper limit is 12+log(O/H) 8.05 (Denicoló et al., 2002). The knot appears to be somewhat metal-poor, though we cannot set a definite upper limit on its metal abundance, and we have shown that it also shows a very low internal velocity dispersion as befits a dwarf galaxy.
Brosch et al. (2006) identified a considerable number of H-emitting knots in the neighbourhoods of a few star-forming galaxies qualified as “dwarfs” (M–18) and located in some very under-dense regions of the nearby Universe. The study revealed these prospective neighbour galaxies through the presence of H emission at or near the central galaxy redshift. It is possible that the knot found here is a similar type of object.
4.4 Differences between the two slit positions
Spectroscopy of the ring in NGC 4650A has been reported by Swaters & Rubin (2003). They found a ring rotation curve that seems to flatten out from the center to the North, but which is steadily increasing from the center to 20 arcsec on the South side and then flattens out. This is more pronounced for the stellar component of the ring than for its gaseous component. The galaxy itself, an S0 as most PRGs are, shows solid-body-like stellar rotation from the center to 15 arcsec out while the emission lines show a different pattern of constant velocity. This they interpret as due to the galaxy being devoid of gas while the line emission is produced only in the ring. Comparisons of the rotational properties of polar rings and of galaxy disks are valuable in understanding PRGs.
We return now to the appearance of the stellar rotation curves observed at and at . These curves, derived from the Na I absorption lines, are very similar. They appear linear for a considerable distance and their velocity-distance gradients are 19 km sec-1 kpc-1.
We point the reader back to Fig. 4 where the extent of the continuum that allows the detection and measurement of the Na I D lines is considerably narrower than that for . The discrepancy could be resolved by assuming that the absorption lines, and therefore most of the continuum, would not be produced by stars in the ring, as implicitly assumed in the previous sections, but by stars in the main galaxy, perhaps in a stellar disk or in a strong bar. The AM1934-563 inclination can be derived from the axial ratio of the galaxy given in Reshetnikov et al. (2006): i.
In this case, the angle difference between the two slit positions, , would explain the difference in the extent of the linear rotation curves at the two position angles as a combination of foreshortening and obscuration by the dust lane. The dust lane produces about one magnitude of extinction, as the intensity profiles along the slit in Fig. 4c of Reshetnikov et al. (2006) show. The sudden disappearance of the absorption lines only 15 SW of the dynamical center could be explained by the crossing of the dark lane by the slit at this position angle. The weak intensity of the underlying continuum of the H line, plotted with a short-dashed line in the top panel of Fig. 12, supports this interpretation.
The ring would, in this case, be composed mostly of gas, would be located between us and the disk with its dark lane, and would necessarily be much less massive than assumed by Reshetnikov et al. (2006). The emission lines measured within 5″ of the kinematic centre (see e.g., Fig 12) would then be produced primarily in the disk, while those for but measured at a galacto-centric distance of more than 65 would originate in the ring.
The arguments presented above indicate that the model proposed by Reshetnikov et al. (2006) to explain AM1934-563 as a major merger, with the donor galaxy being PGC 399718, might not fit the observations. We therefore propose another alternative, that the unsettled disk or ring around the galaxy was formed by accretion of cold gas from a cosmic filament, one of the possibilities accounting for ring galaxy formation put forward by Combes (2006). The presence of anomalous HI redshifts in the region, our discovery of an apparent dwarf HII galaxy in the group, and the circumstantial detection of large but low surface brightness galaxies in the immediate vicinity of AM1934-563 , albeit lacking redshifts at present, argue in favour of this interpretation.
Perusing the large-scale structures identified in this region by Radburn-Smith et al. (2006), specifically those in Panel 6 of their Figure 4, indicates that the location of AM1934-563, at , , corresponds to the tip of a galaxy filament extending out of the Zone of Avoidance. This might be a distant structure related to the Centaurus wall and the Norma and Pavo II clusters of galaxies at lower redshifts, through which intergalactic matter is accreted by the galaxy and forms the ring.
Models of cold gas accretion from cosmic filaments by Macciò et al. (2006) show how a ring galaxy, such as NGC 4650A or for that matter AM1934-563 could be formed by such a process. Their simulations show that the accreted gas is not completely cold but rather at 15,000K due to its collapse within the gravitational potential of the filamentary structure. Moreover, they mention that some of the gas might also be shock-heated by the halo potential.
A similar process could take place in AM1934-563 . There is no clear-cut evidence that the ring is closed or relaxed, or that it has a substantial stellar component. Its disturbed appearance at its SW end is more similar to that of an assemblage of diffuse gas clouds, not of a coherent and relaxed structure. The NE part is smaller and sharper; it is possible that accreted gas collides there with itself, becomes compressed and shocked, and reaches higher temperatures that produce the enhanced line emission. At this location the accreted gas could perhaps enter a circular or quasi-circular orbit.
An alternative could be that in the AM1934-563 case we are indeed witnessing a merger with a gas-rich galaxy, which takes place in a polar configuration. This is, in a way, similar to the major merger scenario of Reshetnikov et al. (2006) with the exception that the ”donor” galaxy would now be the ring itself. The argument reducing the likelihood of this explanation is the lack of a significant stellar continuum from the ring, indicating its low mass.
4.5 The shape of the dark matter halo of AM1934-563
Considering the two gas rotation curves, the one along the galaxy’s major axis and the other along the ring’s major axis, one observation is in order. The two rotation curves derived from the emission lines extend a similar distance from the galaxy’s kinematic centre, are presumably in the same dark matter potential well if AM1934-563 is indeed a PRG, yet show a completely different full amplitude. While the galaxy major axis rotation curve has a full end-to-end amplitude of 450 km sec-1, that for the ring has a full amplitude of only 240 km sec-1. The asymptotic rotation of the ring is slower than the asymptotic rotation of the galaxy.
The formation of PRGs has been studied by Bournaud & Combes (2003) via N-body simulations. They discussed, in particular, cases when both the galaxy disk and the ring contain gas. Their argument was that in such cases the polar ring must, by necessity, be wider than the galaxy. If this is not the case, the gas in the ring would interact with the gas in the disk and one of the components would join the other. Two orthogonal, or almost orthogonal gas rings, can coexist in the same galaxy only if they have different radii and do not cross each other. Such crossing presumably occurs in NGC 660, where both the disk and the ring contain gas; the N660 system is unstable and according to Bournaud & Combes did not have sufficient time to dissolve the ring since its formation.
The specific question of the DM halo shape in PRGs was studied by Iodice et al. (2003). They explained that the ring material would move slower than the gas in the disk if the gravitational potential would be oblate, like the flattened disk galaxy. In this case the ring would be elliptical and would show a lower observed velocity than the disk at its outermost locations (see their Fig. 3). In the case of AM1934-563 , since the ring and the galaxy appear to have the same size but the ring must be wider in order to avoid crossing the disk, a possible conclusion would be that the ring is elliptical with its major axis close to our line of sight to the object and its minor axis seen almost perpendicular to the disk. This way, the ring could indeed be larger than the galaxy, the gas in the ring and that in the galaxy would not cross, and the velocities at the apo-galactic ring locations would be slower than in the galaxy disk. In this case the outermost visible ring segments would correspond to locations near the ends of the minor axis and ring material should show there its highest orbital speed, larger than that of the galactic disk. As this is not observed, we conclude that the disk and the ring in AM1934-563 are of similar sizes, their contents do cross, and the system is unstable.
With the additional kinematic information now available, AM1934-563 could be considered a test case for DM gravitational potential tracing. The discussion of PRGs by Combes (2006) was based on the hope that PRGs would prove to be useful probes of the DM potential in which a galaxy and its polar ring find themselves. Combes (2006) found that the rings in observed PRGs show faster rotation than the maximal velocity observed in the host galaxy. The theoretical prediction is in the opposite direction to the observations, namely rings in PRGs devoid of DM halos or with spherical halos should be rotating slower than their galaxies. According to Combes (2006), this effect should be accentuated for flattened or oblate DM halos.
We find that AM1934-563 fulfills the theoretical predictions for non-spherical oblate haloes in that the polar ring does rotate slower than its host galaxy. Any DM halo of AM1934-563 , if it exists at all, would have to be flattened along the barred disk, but this configuration could not be stable on the long run because the ring would cross the disk. Resolving this possibility and deriving more constraints on the existence and shape of a possible DM halo for AM1934-563 would require detailed modelling and further observations that are not within the scope of this paper.
5 Conclusions
We presented observations obtained with SALT and RSS during their performance verification phase that emphasize the long-slit capabilities of the RSS for galaxy observations. We traced the stellar and gaseous rotation curves for the major axis of the galaxy and for the major axis of a polar ring-like feature almost perpendicular to the disk of the galaxy. We showed that, while the gas rotates regularly when sampled along the galaxy major axis, the stellar component shows rotation like a solid body, supporting an interpretation that this is an object with a strong bar viewed almost side-on.
The ionized gas rotation along the major axis of the ring was found to be much less regular than along the major axis of the galaxy and shows a somewhat shallower gradient with galacto-centric distance. The Na I stellar rotation from the 6.5 kpc ring segment where the lines are measurable shows a similar distance dependence to that seen along the galaxy’s major axis. The systemic velocity derived by us for AM1934-563 differs from previously published values. We propose that the discrepancy of rotation curves along the two position angles can be resolved by recognizing that the absorption lines are probably produced only by the main galaxy or its bar, and not by the ring where only emission lines are produced.
We discovered a small H knot at a projected distance of about 700 kpc from AM1934-563 but at a similar velocity, which we interpret as a fourth member of this compact group of galaxies, presumably a metal-poor dwarf galaxy. The lack of continuum emission for this object while only the H line is detected indicates that it might be forming stars for the first time. The low velocity dispersion measured from the knot indicates its low mass.
We argue that a more plausible explanation to the major merger scenario proposed by Reshetnikov et al. (2006) to explain AM1934-563 could be the slow accretion of cold cosmic gas along a galaxy filament directed to the AM1934-563 region. In the cold gas accretion case the flow is probably towards the galaxy from the South-West and becomes more compressed at the NE end of the polar ring feature. We point out that the kinematic properties we measured follow the theoretical predictions for PRGs in a dark matter halo that is not spherical, but is flattened along the plane of the galaxy.
Acknowledgments
This paper was written while NB was a sabbatical visitor at the South African Astronomical Observatory in Cape Town; NB is grateful for this opportunity offered by the SAAO management. We are grateful for the generous allocation of SALT observing time during the PV phase to complete this project. We acknowledge a private communication from Vladimir P. Reshetnikov concerning this galaxy. We acknowledge the use of products of the second Digitized Sky Survey produced at the Space Telescope Science Institute under U.S. Government grant NAG W-2166. The images are based on photographic data obtained using the UK Schmidt Telescope. The UK Schmidt Telescope was operated by the Royal Observatory Edinburgh, with funding from the UK Science and Engineering Research Council (later the UK Particle Physics and Astronomy Research Council), until 1988 June, and thereafter by the Anglo-Australian Observatory. The blue plates of the southern Sky Atlas and its Equatorial Extension (together known as the SERC-J), as well as the Equatorial Red (ER), and the Second Epoch [red] Survey (SES) were all taken with the UK Schmidt. An anonymous referee provided some insightful comments that improved the clarity of the presentation.
References
- Allen et al. (1991) Allen at al. 1991, MNRAS, 248, 528
- Baes et al. (2003) Baes M., et al., 2003, MNRAS, 343, 1081
- Bekki (1998) Bekki K., 1998, ApJ, 499, 635
- Bettoni, Fasano, & Galletta (1990) Bettoni D., Fasano G., Galletta G., 1990, AJ, 99, 1789
- Bournaud & Combes (2003) Bournaud F., Combes F., 2003, A&A, 401, 817
- Brosch et al. (2006) Brosch, N., Bar-Or, C., and Malka, D. 2006, MNRAS, 368, 864
- Brosch (1985) Brosch, N. 1985, A&A, 153, 199
- Brosch (1987) Brosch, N. 1987, Mercury, 16, 174
- Buckley, Swart, & Meiring (2006) Buckley D. A. H., Swart G. P., Meiring J. G., 2006, SPIE, 6267,
- Bureau & Athanassoula (2005) Bureau M., Athanassoula E., 2005, ApJ, 626, 159
- Burgh et al. (2003) Burgh E. B., Nordsieck K. H., Kobulnicky H. A., Williams T. B., O’Donoghue D., Smith M. P., Percival J. W., 2003, SPIE, 4841, 1463
- Combes (2006) Combes, F. 2006, EAS, 20, 97
- Catinella, Giovanelli, & Haynes (2006) Catinella B., Giovanelli R., Haynes M. P., 2006, ApJ, 640, 751
- Denicoló et al. (2002) Denicoló, G., Terlevich, R., & Terlevich, E. 2002, MNRAS, 330, 69
- González-Delgado et al. (1999) González-Delgado, R.M., Leitherer, C., & Heckman, T.M. 1999, ApJS, 125, 489
- Grossi et al. (2007) Grossi M., Disney M. J., Pritzl B. J., Knezek P. M., Gallagher J. S., Minchin R. F., Freeman K. C., 2007, MNRAS, 374, 107
- Kregel & van der Kruit (2004) Kregel M., van der Kruit P. C., 2004, MNRAS, 352, 787
- Kregel, van der Kruit, & Freeman (2004) Kregel M., van der Kruit P. C., Freeman K. C., 2004, MNRAS, 351, 1247
- Hagen-Thorn et al. (2005) Hagen-Thorn, V.A., Shalyapina, L.V., Karataeva, G.M., Yakovleva, V.A., Moiseev, A.V., and Burenkov, A.N. 2005, Astron. Reports, 49, 958
- Iodice et al. (2003) Iodice E., Arnaboldi M., Bournaud F., Combes F., Sparke L. S., van Driel W., Capaccioli M., 2003, ApJ, 585, 730
- Karataeva et al. (2004) Karataeva, G.M., Tikhonov, N.A., Galazutdinova, O.A., Hagen-Thorn, V.A., and Yakovleva, V.A. 2004, A&A, 421, 833
- Kobulnicky et al. (2003) Kobulnicky H. A., Nordsieck K. H., Burgh E. B., Smith M. P., Percival J. W., Williams T. B., O’Donoghue D., 2003, SPIE, 4841, 1634
- Kniazev et al. (2004) Kniazev, A.Y., Pustilnik, S.A., Grebel, E.K., Lee, H., & Pramskij, A.G. 2004, ApJS, 153, 429
- Kniazev et al. (2005) Kniazev, A.Y., Grebel, E.K., Pustilnik, S.A., Pramskij, A.G., & Zucker, D. 2005, AJ, 130, 1558
- Iodice et al. (2002) Iodice E., Arnaboldi M., De Lucia G., Gallagher J. S., III, Sparke L. S., Freeman K. C., 2002, AJ, 123, 195
- Iodice et al. (2006) Iodice E., et al., 2006, ApJ, 643, 200
- Leitherer (1999) Leitherer, C. et al. 1999, ApJS, 123, 3
- Lynds & Toomre (1976) Lynds, R. & Toomre, A. 1976, ApJ, 209, 382
- Macciò, Moore, & Stadel (2006) Macciò A. V., Moore B., Stadel J., 2006, ApJ, 636, L25
- Mayya & Korchagin (2001) Mayya, Y.D. & Korchagin, V. 2001, ApSSS, 277, 339 (on-line revision in 2006)
- Mazucca et al. (2001) Mazucca, L.M., Knapen, J.H., Regan, M.W. & Böker, T. 2001, in The Central kiloparsec of Starbursts and AGN, J.H. Knapen et al. , eds. San Francisco: ASP, 573
- Norris et al. (1990) Norris R. P., Kesteven M. J., Troup E. R., Allen D. A., Sramek R. A., 1990, ApJ, 359, 291
- O’Donoghue et al. (2006) O’Donoghue D., et al., 2006, MNRAS, 372, 151
- Persic, Salucci, & Stel (1996) Persic M., Salucci P., Stel F., 1996, MNRAS, 281, 27 (erratum 1996, MNRAS, 283, 1102)
- Radburn-Smith et al. (2006) Radburn-Smith D. J., Lucey J. R., Woudt P. A., Kraan-Korteweg R. C., Watson F. G., 2006, MNRAS, 369, 1131
- Reshetnikov et al. (2001) Reshetnikov V. P., Faúndez-Abans M., de Oliveira-Abans M., 2001, MNRAS, 322, 689
- Reshetnikov (2004) Reshetnikov, V.P. 2004, A&A, 416, 889
- Reshetnikov et al. (2006) Reshetnikov, V., Bournaud, F., Combes, F., Faúndez-Abans, M., and de Oliveira-Abans, M.: 2006, Astron. Astroph. 446, 447.
- Sargent & Searle (1970) Sargent W. L. W., Searle L., 1970, ApJ, 162, L155
- Schweizer et al. (1987) Schweizer, F., Ford, W.K. Jr., Jederzejewsky, R. & Giovanelli, R. 1987, ApJ, 320, 454
- Shane (1980) Shane, W.W. 1980, A&A 82, 314
- Swaters & Rubin (2003) Swaters R. A., Rubin V. C., 2003, ApJ, 587, L23
- van Driel et al. (2002) van Driel W., Combes F., Arnaboldi M., Sparke L. S., 2002, A&A, 386, 140
- Whitmore et al. (1990) Whitmore B. C., Lucas R. A., McElroy D. B., Steiman-Cameron T. Y., Sackett P. D., Olling R. P., 1990, AJ, 100, 1489
- Zasov et al. (2000) Zasov, A., Kniazev, A., Pustilnik, S., et al. 2000, A&AS, 144, 429
- Woudt et al. (2006) Woudt P. A., et al., 2006, MNRAS, 371, 1497