Excitonic Mott transition in type-II quantum dots
Abstract
Photoluminescence spectra measured on a type-II GaSb/GaAs quantum dot ensemble at high excitation power indicate a Mott transition from the low density state comprising of spatially-indirect excitons to a high density electron-plasma state. Under the influence of a very high magnetic field, the electron-plasma that is formed at high excitation powers is ‘frozen-out’ into a state of optically inactive magneto-excitons.
pacs:
71.35.Lk, 78.67.Hc, 71.35.JiPhotoexcited carriers in a semiconductor are a model system where we have ready means to both controllably generate and, through the recombination luminescence, probe the energy levels and statistics of the exciton population. At low excitation power, the Wannier excitons can be treated as independent, much like a gas of non-interacting hydrogenic atoms. A larger density of such entities can lead to the formation of molecular, liquid, metallic, or superfluid phasesZimmermann many particle theory ; butov review . The low and high density regimes are also separated by a Mott transition between the “insulating” excitonic state of bound electron-hole pairs and the plasma state, which occurs due to the combination of enhanced screening, bandgap remormalization, and non-zero bandwidths at high carrier densities. While the dynamics of photoexcited carriers, the nature of the non-equilibrium distribution functions, excitonic dephasing, and the transition itself continue to be actively studied, mainly through time-resolved studies, in bulk and low-dimensional semiconductor samplesmanzke ; vina ; shah ; fenton ; Kappei , there has also been an increasing interest in probing the phases of “spatially indirect” excitons in systems like type-II quantum wells and coupled quantum wells with complimentary dopingbutov review .
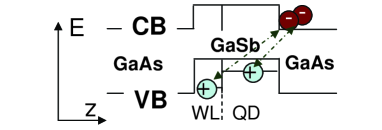
We have studied the photoluminescence (PL) spectra from a type-II self-assembled quantum dot (QD) ensemble. Due to the staggered band alignment at the GaSb-GaAs interfacemanus apl ; Geller APL ; hatami ; muller-kirsch , the GaSb QDs contained within the GaAs matrixmuller-kirsch confine the holesGeller APL , but act as antidots for the electrons [Fig.1]. Under non-resonant optical excitation, the electron-hole pairs generated are spatially separated, with the electrons being loosely bound to the charge of the holes within the QDsmanus apl ; Geller APL ; hatami . As a result, we have yet another kind of spatially-indirect exciton where the charge distribution of the excluded electrons is self-consistently determined such that it corresponds to the minimum energy configurationjanssens peeters , possibly with interesting topological consequencesribeiro ; govorov ; janssens peeters . These excitons have no centre of mass degree of freedom and the average charge of the QDs can be tuned by the strength of the optical excitationmanus apl ; biexciton apl ; manus prb . They do not form excitonic “molecules”; the biexcitons are rather like new “elements” with different “nuclear” chargebiexciton apl ; manus apl . The upper bound on the exciton density is determined by the spatial density of the randomly positioned QDs. Studying the PL spectra from GaSb QDs at different excitation powers and in high magnetic fields, we have encountered two Mott transitions. These are discussed here.
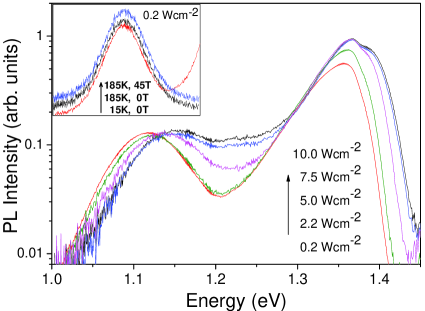
The details of sample growth by metal-organic vapor phase epitaxy and their characterization are described in reference muller-kirsch, . The particular sample measured in this study corresponds to a growth interruption of 2 seconds and a QD density of about muller-kirsch . The low temperature PL spectra exhibit two prominent peaks, from the wetting layer (WL) at about 900 nm and the QD ensemble at about 1100 nm [Fig.2]. The ratio of the WL to the QD PL intensities is strongly excitation power-dependent. This gives an indication of the relative populations of carriers in the two regions. In the range of excitation powers studied herefootnote oidd , there was a monotonic blue-shift of the PL peak position with increasing excitation power [Fig. 3(a)]. Unfortunately, this contribution of the capacitive charging energy associated with the increased hole occupancy at higher excitation powersmanus apl ; biexciton apl completely masks the bandgap renormalization effects.
This letter describes the results of non-resonant PL measurements (excitation wavelength of 514 nm) in high magnetic fields of 45 T. All the magnetic field-dependent measurements described in this study were performed in pulsed magnetic fields and using a liquid nitrogen-cooled InGaAs linear array detector. The detector’s exposure time was chosen depending on the emission intensity. The number of exposures per field pulse were determined by the condition that the variation of the magnetic field B, during the exposure was less than 5%. Spectra were measured in both the rising and the trailing edges and it was ensured that the magnetic field-dependent change in the peak-position of the PL spectra (henceforth called PL peak-shift) inferred from spectra taken in different field pulses had considerable overlaps in the magnetic field ranges they covered.
The PL peak-shift contains valuable information about the excitonic states. The magnetic field-induced shift of excitonic (hydrogenic) ground state at very low fields corresponds to a diamagnetic shift that is to the lowest order in perturbation theory quadratic in the magnetic field, . The high field regime is equivalent to having “free” electrons and holes recombining from their respective Landau level ground states. Thus the shift is linear at very high fields, . q is absolute value of the electron charge, the reduced mass of the electron-hole pair, and is the exciton radius. These functional forms are strictly valid only in the two asymptotic limits, but are a good approximationLandau_Level_Spectroscopy for and respectively, if is the ratio of the cyclotron energy to twice the effective exciton Rydberg energy. As the simplest approximation, a functional form for the PL peak-shift for may be extrapolated by demanding adiabatic continuity between the two regimes and assuming that diamagnetic contribution extends up to . This leads to the following phenomenologically successful relationship [e.g. Ref. Schildermans, ] to describe the PL peak-shift for all :
The crossover field . The first term in Eq.(Excitonic Mott transition in type-II quantum dotsb) corresponds to the excitonic binding energy and is the extrapolation of the high-field slope [second term in Eq.(Excitonic Mott transition in type-II quantum dotsb)] to .
Fig.3(a) shows the PL peak-shift at different powers of the excitation laser measured in magnetic fields of up to about T with the sample at 4.2 K. Fitting these data to Eq.Excitonic Mott transition in type-II quantum dots gives a direct way to measure the excitonic binding energies and the radii. The results are shown in Fig.3(c). The value of the average binding energy of the exciton decreases from 4.5 meV to less than 0.5 meV as the excitation power is increased by one and half orders of magnitude. The evolution is accompanied by the corresponding increase in the exciton radius from 8 nm to about 25 nm. We thus have an indication of the system progressing toward a Mott transitionfootnote_Fock-Darwin . The peak-shift observations correlate well with the zero-field emission spectra of Fig.2, where despite the large inhomogeneous broadening, the loss of excitonic resonance is clearly observed by the broadening of the high energy tail and the significant increase in linewidth at high excitation power [also see Fig.4(d)]. Reference muller-kirsch_many particle, also reports a similar broadening.
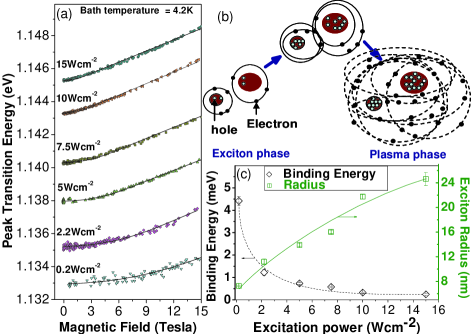
The weakening of the binding of electrons from a specific site can be related to two effects. Of primary importance is the higher electron density, especially of those electrons which participate in the WL PL. Fig.2 shows that the WL PL intensity increases much faster than the QD PL intensity, implying a greater role of screening at higher excitation power. Specifically, there exists a critical screening length beyond which the positively charged dots do not support bound (exciton) states. While for a 3D system with Yukawa interactionRogers is , in the actual QD ensemble the barrier potentials at the QD-matrix heterointerface further aid ionization. QDs are also not a homogeneous three-dimensional system because the electrons are constrained to the upper half of the semi-infinite matrix (excluded by the WL), but still attracted to the holes in the dots and the WL. Secondly, since the average separation of the randomly located QDs in the present sample is about – nm, for exciton sizes of about 25 nm there may be an overlap between some excitons with their neighbors. The delocalization of a few electrons can further aid in screening, leading to further ionization.
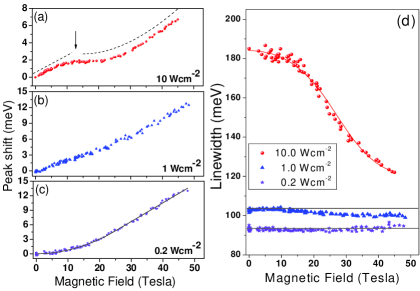
Fig.4 extends the study to much higher magnetic fields (B45 T). For practical reasons pertaining to helium turbulence during the pulse, the high field experiments had to be performed in a helium flow cryostat at a temperature of about K. It is likely that the slight increase in temperature has further aided ionization. The observation of a very large linewidth in Fig.2, at the excitation power of 10 Wcm-2, was indicative of the formation of the plasma phase. Now notice the anomaly in the PL peak-shift of the spectra measured at this excitation power [Fig.4(a)]. The PL peak-shift shows an unexpected change in slope around T and it can no longer be described by Eq.1 in the entire field range. Qualitatively, a linear peak-shift at low fields (indicative of the electron plasma state with near-zero binding energy [cf. Eq.1] ) transforms to a curve described by Eq.1 (dotted line in Fig.4(a)). This transition from linear to quadratic dependencehidden symmetry footnote is due to the magnetic field-induced stabilizationfenton of the insulating magnetoexciton stateribeiro ; govorov ; janssens peeters —an arbitrarily weak 1D (effective dimensionality is reduced on account of 2D magnetic confinement) potential must support at least one bound state. This is similar to the field-induced impurity freeze-out phenomenonfenton of semiconductor physics. Between Fig.4(a) and (b) (and other measurements at intermediate powers) we observe an increase in slope of the field dependence of peak-shift at low magnetic fields. This suggests a coexistence of two phases, due to distribution of critical screening lengths for different sized-QD in the ensemble. Note that Fig.4(c), where we began with a clearly bound excitonic state at B=0, Eq.1 [solid line in Fig.4(c)] describes the PL peak-shift in the entire field range and there is no Mott transition.
Independent evidence of the above described phenomena is provided by the difference in the field dependence of the linewidths of the spectra measured at different excitation powers [Fig.2(inset) and Fig.4(d)]. The linewidth is nearly constant up to T for the spectra measured at the excitation power of 0.2 and 1 Wcm-2, completely determined by the inhomogeneous broadening. Fig.2(inset) shows that increasing the measurement temperature to as high as K also does not affect the spectral shape.
On the other hand, there is a decrease in the linewidth of the spectra measured at 10 Wcm-2[Fig.4(d)] in an applied magnetic field. The linewidth is almost constant in plasma phase below T and the decrease correlates with the anomaly in the peak-shift data. Furthermore, in high magnetic field, the linewidth again tends toward the inhomogeneous broadening-limited value measured for the excitons at lower laser powers. Note that this behavior is hard to explain if we assume that the linewidth enhancement is due to state filling alonemuller-kirsch_many particle .
Fig.4(d) thus serves the purpose of a rough “phase diagram”, where the upper part of the graph corresponding to large linewidths denotes the plasma phase and the lower part the (inhomogeneously broadened) exciton phase. It is clarified that the Mott transition is a zero-temperature phenomenon and thus the measurements described in Fig.4(d) and the rest of the paper only depict magnetic field-, excitation power- and temperature-aided excursions to various phases.
The highly non-equilibrium nature of the phenomena requires the generation of a large number of photoexcited carriers and consequently sample excitation under high laser powers, and will result in some sample heating. However, this heating is only a perturbation to the experimental conditions: Firstly, the zero-magnetic field PL spectra showed a strong temperature dependence at all laser powers and the zero-field PL spectra measured at different powers all merged to a single curve beyond 100 K (not shown). These observations indicate that the difference in the sample heating was of the order of about 10K between the lowest and the highest powers. Furthermore, we observe in Fig.2 that the the loss of excitonic resonance due to many body effects which change the functional form of the spectral density is different from the thermal ionization of excitons. For the spectra measured at 185K and the excitation power of Wcm-2, the inhomogeneous linewidth is unaffected despite the large temperature change.
Finally, we mention that the emission intensities were magnetic field-dependent. Unlike for type-I dots, we observed a magnetic field-induced PL quenching, which suggests that the ground state of magnetoexcitons in our sample is dark with a possibility of a gap that can be overcome at high temperatures.
Conclusions.—We have studied the different phases of spatially indirect excitons in an ensemble of GaSb QDs contained within a GaAs matrix. We have observed systematic changes in the excitonic binding energy and the exciton Bohr radii with changing electron-hole density [Fig.3]. These are interpreted as the transition from an insulating excitonic phase to a single component plasma phase. The magnetic field induced shift of the peak energy of the PL spectra, when the system is in the plasma phase, shows an anomalous functional form [Fig.4] that is indicative of a phase transition. This is attributed to a second Mott transition back to the insulating magnetoexciton state. The loss and the recovery of the excitonic resonance was independently tracked [Fig.2 and Fig.4(d)] by observing the changes in the inhomogeneous linewidth as a function of excitation power and magnetic field.
This work is supported by the Belgian IAP, the SANDiE Network of Excellence (Contract no. NMP4-CT-2004-500101), and EuroMagNET (RII3-CT-2004-506239) projects of the European Commission. BB was a postdoctoral fellow of the FWO Vlaanderen. MH is currently an Academic Fellow of the Research Councils UK. We thank J. Vanacken and F. Herlach for their support and guidance in the pulsed-field experiments.
References
- (1) R. Zimmermann, Many-Particle Theory of Highly Excited Semiconductors (Teubner, Leipzig, 1988).
- (2) L. V. Butov, J. Phys.: Condens. Matter 16, R1577 (2004).
- (3) L. Kappei, et al., Phys. Rev. Lett. 94, 147403 (2005).
- (4) A. Amo, et al., Phys. Rev. B 73, 035205 (2006).
- (5) E. W. Fenton and R. R. Haering, Phys. Rev. 159, 593 (1967).
- (6) J. Shah, et al., Phys. Rev. Lett. 38, 1497 (1977).
- (7) G. Manzke, et al., Phys. Rev. Lett. 80, 4943 (1998).
- (8) L. Müller-Kirsch, et al., Appl. Phys. Lett. 79, 1027 (2001).
- (9) M. Geller et al., Appl. Phys. Lett. 82, 2706 (2003).
- (10) F. Hatami et al., Appl. Phys. Lett. 67, 656 (1995)
- (11) M. Hayne, et al., Appl. Phys. Lett. 82, 4355 (2003).
- (12) E. Ribeiro, et al., Phys. Rev. Lett. 92, 126402 (2004).
- (13) A. B. Kalametsev, et al., JETP Lett. 68, 669 (1998).
- (14) K. L. Janssens, et al., Phys. Rev. B 64, 155324 (2001).
- (15) K. Matsuda, et al., Appl. Phys. Lett. 90, 013101 (2007).
- (16) M. Hayne, et al., Phys. Rev. B 70, 081302(R) (2004).
- (17) Measurements at ultra-low excitation powers reveal an unexpected U-shapemanus prb of the PL peak energy as a function of excitation power, due to optically induced charge depletion (OICD) of the heavily doped QDs. The present study is limited to higher powers where we observe the conventional blue-shift, the physics of the OICD is not relevant.
- (18) R. P. Seisyan and B.P. Zakharchenya in Landau Level Spectroscopy, Modern Problems in Condensed Matter Sciences, Vol. 27.1, (North-Holland, Amsterdam, 1991) pp 344-443.
- (19) N. Schildermans, et al., Phys. Rev. B 72, 115312 (2005).
- (20) The generic conclusions are model independent. For example, using the Fock-Darwin Hamiltonianribeiro , instead of Eq.(1), would yield very similar results.
- (21) L. Müller-Kirsch, et al., Appl. Phys. Lett. 78, 1418 (2001).
- (22) F. J. Rogers, et al., Phys. Rev. A 1, 1577 (1970).
- (23) A similar change in slope of the PL peak-shift in quantum wells was initially thought to be an excitonic Mott transition [H. W. Yoon, et al., Sol. Stat. Comm. 104, 287 (1997).], but later interpreted as a manifestation of the “hidden symmetry” [E. I. Rashba and M. D. Sturge, Phys. Rev. B 63, 045305 (2000)]. The latter explanation is ruled out here because our excitons are not 2D.