75282
E. Dalla Bontà
The Black Hole Mass of
Abell 1836-BCG and Abell 3565-BCG
Abstract
Two brightest cluster galaxies (BCGs), namely Abell 1836-BCG and Abell 3565-BCG, were observed with the Advanced Camera for Surveys (ACS) and the Space Telescope Imaging Spectrograph (STIS) on board the Hubble Space Telescope. By modeling the available photometric and kinematic data, it resulted that the mass of Abell 1836-BCG and Abell 3565-BCG are M⊙ and M⊙ at confidence level, respectively.
keywords:
black hole physics, galaxies: kinematics and dynamics, galaxies: structure1 Introduction
Many nearby galaxies have revealed large dark masses in small regions, so far explained only in terms of supermassive black holes (SBHs, see for a review Ferrarese & Ford 2005). Spectroscopic and photometric data at high spatial resolution have made it possible to derive relatively accurate SBH masses, , for a number of galaxies. These measurements are reliable if the SBH sphere of influence is solved. It was also found that correlates with other galaxy properties, such as bulge luminosity (Magorrian et al. 1998, Marconi & Hunt 2003), light concentration (Graham et al. 2001), and bulge velocity dispersion (Ferrarese & Merritt 2000; Gebhardt et al. 2000). The inextricable link between the evolution of SBHs and the hierarchical build-up of galaxies is most directly probed by the systems that have undergone the most extensive and protracted history of merging, namely the massive galaxies associated with the largest SBHs. This is the case of brightest cluster galaxies (BCGs). Their large masses and luminosities, as well as their having a merging history which is unmatched by galaxies in less crowded environments, make BCGs the most promising hosts of the most massive SBHs in the local Universe. Therefore from Laine et al. (2003) it was selected a sample of BCGs, predicted to host the most massive SBHs (based on the and relations), and for which the SBH sphere of influence could be well resolved using the 0′′.1 wide slit of Space Telescope Imaging Spectrograph (STIS) on board the Hubble Space Telescope (HST).


2 Imaging and spectroscopy
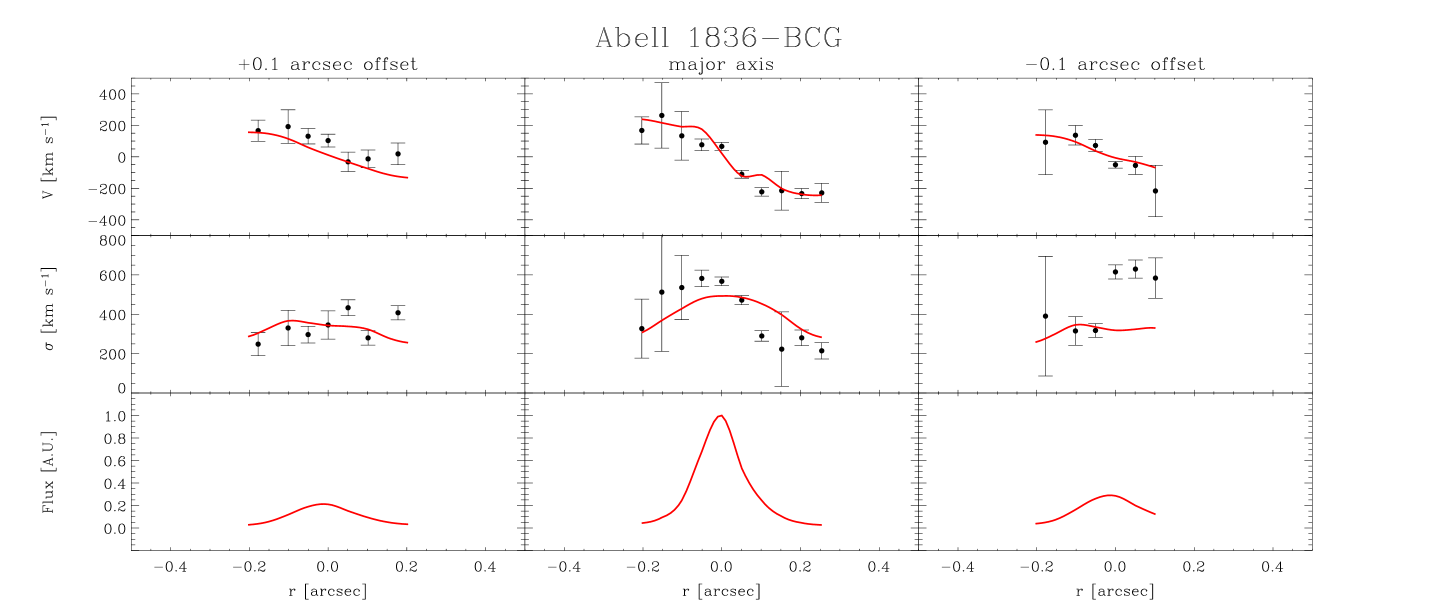
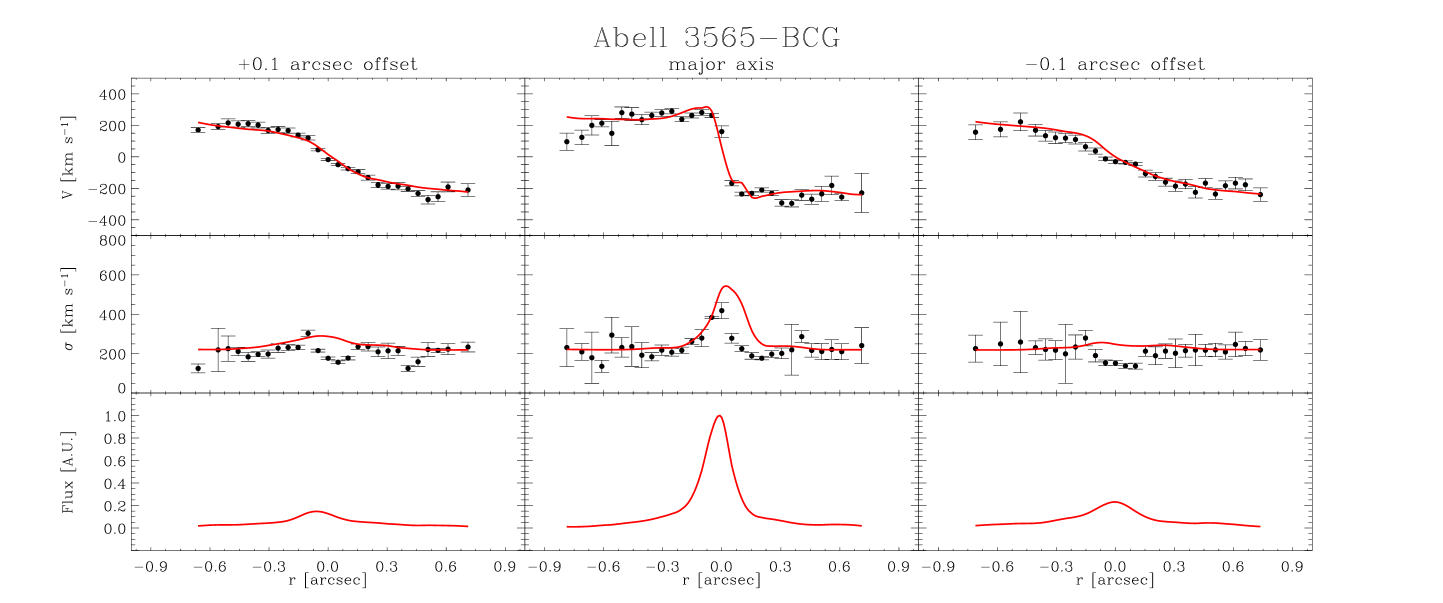
Abell 1836-BCG and Abell 3565-BCG were observed with three filters of the Advanced Camera for Surveys (ACS): F435W (which resembles the Johnson filter), F625W (similar to in the Sloan Digital Sky Survey photometric system), and the narrow-band ( Å) ramp filter FR656N, covering the redshifted H and [N II] emission lines in the nucleus of each galaxy. The images were used to determine the optical depth of the dust, stellar mass distribution near the nucleus, and intensity map. Besides, high-resolution spectroscopy of the H and [N II] emission lines was obtained for both galaxies, to measure the central ionized-gas kinematics. A major axis spectrum was obtained with the slit crossing the nucleus of the galaxy. Two additional offset spectra were obtained displacing the slit by one slit width on either side, perpendicularly to the slit axis. Ionized-gas kinematics was measured by fitting position, width, and flux of the [N II] line. Figs. 1 and 2 show the kinematics of Abell 1836-BCG and Abell 3565-BCG, respectively. They reveal regular rotation curves and strong central velocity gradients, thus they are good candidates for dynamical modeling.
3 Dynamical modeling
For this study, the procedure described in Coccato et al. 2006, to which the reader is referred for details, was followed to model the ionized-gas kinematics. Briefly, a synthetic velocity field was generated assuming that the ionized gas is moving in circular orbits in an infinitesimally thin disk centered at the nuclear location, under the combined gravitational potential of stars and SBH. The model is projected onto the plane of the sky for a given inclination of the gaseous disk, and then degraded to simulate the actual setup of the spectroscopic observations. The latter step includes accounting for width and location (namely position angle and offset with respect to the center) of each slit, STIS PSF, and charge bleeding between adjacent CCD pixels. The free parameters of the model are the mass of the SBH, mass-to-light ratio of the stellar component (and dark matter halo), and inclination of the gaseous disk. Both and are assumed to be radially invariant. Although can be estimated from the images of the disk, the ionized gas is concentrated in the innermost region of the dust disk and slight warps can be present even in the case of disks with a regular elliptical outline (e.g., Ferrarese et al. 1996; Sarzi et al. 2001; Shapiro et al. 2006). Therefore is best treated as a free parameter. The surface brightness distribution of the ionized gas is treated as input, by the narrow-band imaging. The velocity dispersion of the emission lines was assumed to be described by the radial function , with the choice of the best parameters to reproduce the observables. , , and were determined by finding the model parameters which produce the best match to the observed velocity curve, obtained by minimizing where and are the observed and the corresponding model velocity along the different slit positions, respectively.
4 Results
For Abell 1836-BCG a three-dimensional grid of models was explored, with M⊙ in 2.0 M⊙ steps, in steps, and (M/L)⊙ in 0.5 (M/L)⊙ steps. The best model fitting the observed rotation curve requires M⊙, , and (M/L)⊙, where the errors on and , and the upper limit on , are quoted at the confidence level. This is the largest SBH mass to have been dynamically measured to-date. The model is compared to the observed [N II] kinematics in Fig. 1. Figure 2 shows , , and confidence levels individually on , , and , according to the variations expected for one parameter, with the other two held fixed at their best-fitting values.
The rotation curves of Abell 3565-BCG along the three slit positions were fitted for a grid of model parameters defined by M⊙ in 2.0 M⊙ steps, in steps, and (M/L)⊙ in 0.4 (M/L)⊙ steps. The best model requires M⊙, and (M/L)⊙, where all errors are given at the confidence level. The model is compared to the observed kinematics in Fig. 1. Fig. 2 shows the confidence levels on , , and alone.
5 Conclusions
Several authors have recently focused their attention on the position of BCGs and massive galaxies in the upper end of the SBH scaling relations, using both theoretical and, even if indirect, observational considerations. Bernardi et al. (2007) found that BCGs define a shallower relation than the bulk of early-type galaxies. They interpreted it as due to a non-linear correlation between log and log. This would bring the to underestimate for high values. Furthermore, according to von der Linden et al. (2007) BCGs follow a steeper Faber-Jackson relation than non-BCGs. This implies that BCGs can follow at most one of the power-law relations, either the or the L. Both Bernardi et al. (2007) and von der Linden et al. (2007) used SDSS data. On the contrary, Batcheldor et al. (2007) argue that SBHs masses predicted from NIR luminosities are consistent with masses predicted from . They attributed the discrepancies to the presence of extended blue envelopes around the BCGs.
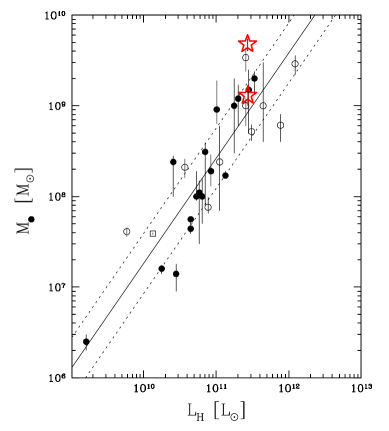
In order to compare the SBH mass determinations of Abell 1836-BCG and Abell 3565-BCG with the prediction of the near-infrared relation by Marconi & Hunt (2003) the 2MASS -band luminosities of the two BCGs were retrieved from the NASA/IPAC Infrared Science Archive. Figure 3 shows the location of the SBH masses in the plane. Only the SBH mass of Abell 1836-BCG is not consistent with the relation, since it is larger than the one expected (i.e., M⊙). The same is true only for M 87, among the seven galaxies with M⊙ dynamically measured so far. The of Abell 1836-BCG is not available in literature, thus it is not possible to discuss its behavior in the relation. On the other hand, all the galaxies with M⊙ lie on the relation. There is no strong evidence that the upper end of the scaling relations is regulated by a different law.
The only way to hush-up the debate is adding new . Before the advent of new classes of telescopes from earth and space, adaptive optics is a viable solution (e.g., Houghton et al. 2006). It will be possible to understand the behavior of both and relations and, in case, if BCGs and normal galaxies have a bimodal trend.
References
- Batcheldor et al. (2006) Batcheldor, D., et al. 2007, ApJ in press
- Bernardi et al. (2007) Bernardi, M., et al. 2007, AJ, 133, 1741
- Coccato et al. (2006) Coccato, L. et al. 2006, MNRAS, 366, 1050
- Ferrarese et al. (1996) Ferrarese, L. et al. 1996, ApJ, 470, 444
- Ferrarese & Ford (2005) Ferrarese, L., Ford, H. 2005, SSRv, 116, 523
- Ferrarese & Merritt (2000) Ferrarese, L., Merritt, D. 2000, ApJ, 539, L9
- Gebhardt et al. (2000) Gebhardt, K., et al. 2000, ApJ, 539, L13
- Graham et al. (2001) Graham, A. W., et al. 2001, ApJ, 563, L11
- Houghton et al. (2006) Houghton, R., et al. 2006, MNRAS, 367, 2
- Laine et al. (2003) Laine, S., et al. 2003, AJ, 125, 478
- Magorrian et al. (1998) Magorrian, J., et al. 1998, AJ, 115, 2285
- Marconi & Hunt (2003) Marconi, A., Hunt, L. K. 2003, ApJ, 589, L21
- Sarzi et al. (2001) Sarzi, M., et al. 2001, ApJ, 550, 65
- Shapiro et al. (2006) Shapiro, K. L., et al. 2006, MNRAS, 370, 559
- von der Linden et al. (2006) von der Linden, A., et al. 2007, MNRAS in press