11email: bvicente@iac.es 22institutetext: Centro de Investigaciones de Astronomía (CIDA), Apdo. 264, Mérida, 3101-A Venezuela.
33institutetext: Departamento de Astrofísica, Universidad de La Laguna, La Laguna (S/C de Tenerife), E-38200 Spain.
Astrometry with Carte du Ciel plates, San Fernando zone.
I. Digitization and measurement using a flatbed scanner.
Abstract
Context. The historic plates of the Carte du Ciel, an international cooperative project launched in 1887, offers valuable first-epoch material for determining of absolute proper motions.
Aims. We present an original method of digitizing and astrometrically reducing Carte du Ciel plate material using an inexpensive flatbed scanner, to demonstrate that for this material there is an alternative to more specialized measuring machines that are very few in number and thus not readily available. The sample of plates chosen to develop this method are original Carte du Ciel plates of the San Fernando zone, photographic material with a mean epoch 1903.6, and a limiting photographic magnitude 14.5, covering the declination range of .
Methods. Digitization has been made using a commercial flatbed scanner, demonstrating the internal precision that can be attained with such a device. A variety of post-scan corrections are shown to be necessary. In particular, the large distortion introduced by the non-uniform action of the scanner is modelled using multiple scans of each plate. We also tackle the specific problems associated with the triple-exposure images on some plates and the réseau grid lines present on all. The final measures are reduced to celestial coordinates using the Tycho-2 Catalogue.
Results. The internal precision obtained over a single plate, in each axis, is comparable to what is realized with similar plate material using slower, less affordable, and less widely available conventional measuring machines, such as a PDS microdensitometer. The accuracy attained over large multi-plate areas, employing an overlapping plate technique, is estimated at 02.
Conclusions. The techniques presented here for digitizing photographic material provide a fast and readily available option for the exploitation of old plate collections. Our demonstration area, consisting of 560 000 stars at an average epoch of 1901.4 is presented as a practical example of the developed scanning and reduction methods. These results are currently being combined with modern astrometry to produce an absolute proper-motion catalogue whose construction is underway.
Key Words.:
astrometry – catalogs – reference systems – surveys – techniques: image processing1 Introduction
The Carte du Ciel project was established at the Astrophysical Congress held in Paris in 1887 and had a twofold objective: the construction of a complete catalogue to V11, the Astrographic Catalogue, and to map the sky to V14, the Carte du Ciel. A total of twenty observatories around the world were assigned the task of taking the photographic plates. It was agreed that all observatories should use the same design and the scale was a roughly consistent one arcmin/mm. More details about the international congress can be found in Gill (1898). Some participants urged that all the measuring should be concentrated in one central bureau, but it was eventually agreed that the measurement and reduction of the plates should be left to the individual observatories. This plate material constitutes the first observational full-sky record, currently with 100 years of antiquity in most cases. As such, it presents a valuable resource for wide-area proper motion determinations and, thus, kinematic studies of the Galaxy. The Astrographic Catalogue objective was successfully completed, culminating in the recent AC2000 Catalogue (Urban et al. 1998) on the Hipparcos reference system. However, only a few observatories completed their assigned declination zones for the Carte du Ciel project.
Some earlier attempts at scanning and reducing of individual plates have been made yielding internal accuracies ranging from 01 to 02 using conventional measuring machines such as a microdensitometer (Geffert et al. 1996, Lattanzi et al. 1991). More recent studies have made use of a handful of plates to determine proper motions for specific objects of astrophysical importance (e.g. Dick et al. 1993, Ortiz-Gil et. al 1998).
Recently, Rapaport et al. (2006) have reported on the construction of a catalogue based on 512 plates in the Bordeaux Carte du Ciel region, using the APM Cambridge automatic measuring machine, with an estimation of the measurement error of about 015 (2.5 ).
Because of the limited availability of conventional astronomical measuring machines and the costs involved in their use, alternative digitization strategies are worth exploring. The use of small machines for scanning permits researchers to overcome the reluctance of proprietary institutions to lend their plate material, which in the present case is honoured as ‘historic property’ and, as such, is subject to stringent access control. Digitization can thus only proceed on site. Trials employing a flatbed scanner have been made (Lamareille et al 2003), but solely for the purpose of judging the photometric precision attainable, not astrometry.
The high speed of a scanner is afforded by imaging with a multi-element detector, such as a 1D CCD array. This requires that a large area be illuminated and imaged simultaneously, leading to significant scattered light and the unavoidable decrease in signal-to-noise and dynamic range of the scanned image. The lower signal-to-noise will adversely affect both the detection limit and the astrometric precision of detected images.
Although scanners are capable of spatial resolutions comparable to a PDS, they are inferior in terms of their stability and repeatability. The primary difficulty in digitizing with a commercial scanner is the large distortions that are introduced by the mechanical limitations of the scanner itself. Scanners are not designed with the high-precision tolerances associated with a more appropriate special-purpose measuring machine such as a PDS. Thus, a detailed analysis and evaluation is necessary to ascertain if astrometrically useful precision can be achieved using a scanner and, if so, what reduction procedures are required.
In this paper we report on the methods developed in the digitization and astrometric calibration of 420 Carte du Ciel plates, which have a mean epoch of 1901.4. Eventually, the resulting early-epoch positions will be used to derive absolute proper motions to the magnitude limit of the CdC plates by combinating them with modern positions from the UCAC2 Catalogue (Zacharias et al. 2004). This paper will confine itself to a description of the techniques developed to process the scanner measurements and an evaluation of the precision attained. However, estimates of the final astrometric precision achieved will be presented in terms of their impact on the planned proper-motion measures and on the projected final proper-motion errors, as this is the primary scientific motivation for the overall project.
2 Plate material
For its part of the Astrographic Catalogue/Carte du Ciel project (AC/CdC in what follows), the Observatorio de San Fernando (Cádiz, Spain) was assigned the area between and declination. The area was fully completed for both surveys producing a total of 2520 plates. It is of note that the collection of 1260 Carte du Ciel plates has not been exploited up to now. The present digitization program was carried out to do this.
Plates of the San Fernando zone were taken between 1892 and 1930, using the Gautier Astrograph with an approximate scale of 60. Each plate covers a field of and observations were planned in a full overlapping strategy, such that every star would be included in two different plates, one of which would contain three exposures. Plates along odd declinations were exposed three times, each 30-minute exposure being shifted , producing a pattern of images for each star that is roughly an equilateral triangle. Plates along even declinations contain a single exposure lasting 30 minutes. All of the plates in the Carte du Ciel project also contain a superimposed réseau grid of 27 perpendicular horizontal and vertical lines, with 5 mm separation. These were included as an aid to assist in the process of visual measurement.
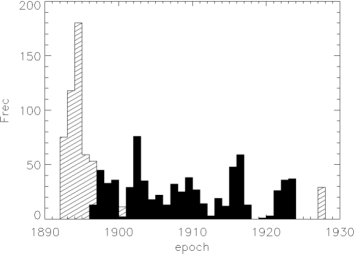
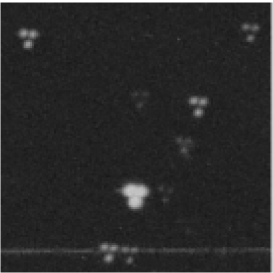
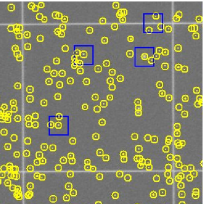
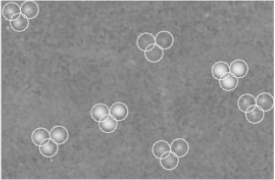
Figure 1 shows the distribution of epochs for the San Fernando plates collection. Some examples of simple-exposure and triple-exposure plates can be seen in Fig. 2.
3 Digitization of the plates
The merits of the photographic medium for astrometric work are many, but among the drawbacks is the need to measure the positions of images on the source material by additional effort. Nowadays, digitization has become the only valid method of doing so, which is important in view of the large amount of material comprising the Carte du Ciel. This digitization is typically done with a specialized measuring machine, for example a PDS microdensitometer. Such instruments are confined to a handful of institutions, where they are permanently installed, i.e., immobile.
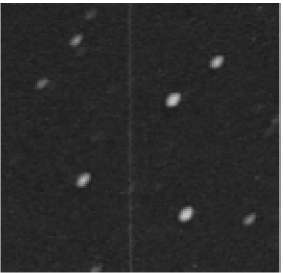
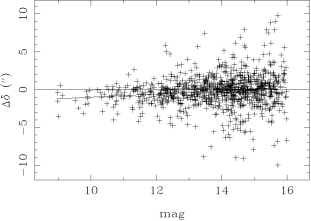
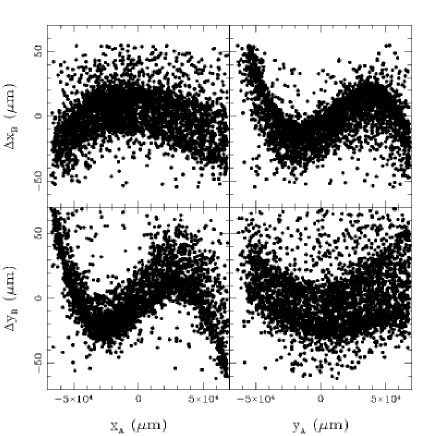
The photographic plates of the AC/CdC surveys represent an important historic legacy of San Fernando Observatory and as such cannot be removed from the observatory. Thus, it is not possible to transport them to a PDS location for measuring. As an alternative, the AC/CdC plates were duplicated onto acetate substrate in 1999 in order to be measured with the PDS microdensitometer of the Centro de Investigaciones de Astronomía (CIDA) in Venezuela. Preliminary tests involving the acetate copies were performed, comparing measures from the PDS at CIDA ( internally) and those from the PDS at Yale University (repeatability of ). External comparison to the original measures of the AC plates (described in Urban et al. 1998) indicated that the duplication process and acetate material introduced relatively large systematic errors, up to in amplitude. These inflated the overall standard error of a single measurement to . Typical distortion patterns are shown in Fig. 3.
In addition to the lower internal precision of the PDS at CIDA, its inefficient serial scanning limited its production to just one plate per day. Both factors, slow speed and errors introduced during the duplication process, were incentives for investigating the use of other digitization devices, such as flatbed scanners, which are readily available and easy to transport. A portable scanner has the advantage of allowing the measurement of the original Carte du Ciel plates at San Fernando Observatory. The high speed of the scanner allows repeated digitization, should this prove of benefit in improving the final precision of the measures. Preliminary studies were done with an Agfa DuoScan scanner of the Universidad de Zaragoza (Spain) to study the astrometric potential of a commercial scanner (see Vicente & Abad 2003 for more details). We concluded that the combination of flatbed scanner and original plate material yields astrometric precision comparable to the PDS measurement of acetate copies, if not better.
The scanner used in the current study is an Agfa DuoScan model f40. It is a flatbed one-pass scanner with an optical resolution 1200 ppi 2400 ppi, dynamic range of 3.0 in density, and 16 bits of digital resolution. It uses a trilinear CCD with 10 600 elements. The important technical specification of this particular model is its built-in scanning bed for transparencies. The lower platform for transparencies has the advantage that images scanned from it are captured directly, not through a glass platter as is the case for opaque material.
We expect the scanner to introduce significant systematic errors, which will differ in magnitude and degree of stability along the two different axes. This expected difference is because of the physical mechanism and manner in which the scanner operates. A linear solid-state detector defines the -axis of the system and rides on a carriage that travels along the -axis. By scanning each plate in two orientations, rotated by , we are able to detect and separate the systematic errors introduced in both axes’ coordinates by the scanner. Details of the procedure used are given in Sect. 5.
The Real Instituto y Observatorio de la Armada in San Fernando (ROA, Spain) has completed the digitization of its collection of 2520 AC/CdC plates. The plates were scanned in 2003 in density mode at the maximum resolution (10.5m per pixel = 063 per pixel), with scans of 13 10013 100 pixels (2), covering the desired area for each plate, 2. Each plate was scanned twice and being rotated 90∘ between scans. For each plate, the pair of scans, which we refer to as scans A and B, are made immediately one right after the other. A mechanical wooden holder was manufactured to ensure that the same area of each plate would be imaged during each of the two scans. The scan images were saved in two-byte integer FITS format and recorded to CD-R disks.
4 Measurement of stellar images
The San Fernando collection of plates is complete and in moderately good condition, considering the long time they have been in storage. There are several characteristics of these plates that complicate the determination of precise positions of their stellar images: 1) the merging of the triple-exposure images on the odd-numbered declination plates - especially difficult are bright stars and those in the outer regions of the plate where the coma is significant, 2) the blending and confusion of stars that fall on réseau grid lines, and 3) the false detections due to plate flaws, spurious dust, and degradations that have accumulated during storage. In addition to these, one must deal with the typical problems of optical aberrations that are also present.
For the present study, one third of the full San Fernando CdC collection has been analysed, covering the right ascension range , comprising 420 plates (180 simple-exposures plates and 240 triple-exposures plates).
The reduction process begins with an initial detection and centroiding of possible stellar images in each scan. This task is accomplished using the software package SExtractor (Bertin & Arnouts 1996). The resulting list of detections includes a large number of false detections, due to the numerous flaws, even after those associated with the réseau grid are removed. Figure 4a illustrates the real-star detection efficiency for the SExtractor threshold parameters adopted.
We note that the SExtractor determined positions are simple the photographic-density-weighted centre of light of the image. This of the image. This is not an optimal determination of the center of a stellar image, both in terms of random and systematic measuring errors. Auer & van Altena (1978) studied stellar image centering in detail with photographic material. They found that 2D Gaussian fits provided the most precise centres, being slightly better than 1D Gaussian fits of the marginal distributions. They also established that centroids, moments of the distribution, are less precise than functional fits to the stellar profiles. In their case study, centroids provided a precision of compared to using Gaussian-fitting. In addition, for bright stars the nonlinear photographic register combines with asymmetric image profiles (due to aberration and/or guiding error) and leads to magnitude equation. Magnitude equation is the undesired correlation between the position of the image centre and the magnitude of the star producing the image. It is caused by the combination of an asymmetric image profile and the non-linear response of the photographic detector.
SExtractor is well-suited to our large fits images in that it is quite fast and consistently provides reliable image detections. The SExtractor centroids are an appropriate choice for the task of mapping the réseau grid lines and providing an approximate astrometric solution to each plate, but not as the basis for our ultimate astrometry. Therefore, we choose to refine the centres using a bi-variant Gaussian fitting method, developed at Yale for use with their PDS machine (Lee & van Altena 1983). Some comparative tests show evidence of the improvement derived from the Gaussian-fitting versus SExtractor centroiding. A magnitude equation is found in the differences of positions between Gaussian-fitting and SExtractor centroids (Fig. 4b). We have investigated the source of this trend and find that it appears in differences of the SExtractor positions compared with an external catalogue, but not in differences of the Gaussian-fit positions with this catalogue. This reinforces the conventional notion that simple centroids are not the optimal centering method for photographic material. Even the Gaussian centering algorithm does not remove all the systematic errors as a function of magnitude, so we will still have to study the magnitude effect in the reduction process, as will be shown in Figs. 16 and 17.
The Yale Gaussian-fitting code requires an initial input position for each star. We used an external star catalogue to provide these input positions, thus addressing several issues; primary among these is that of cleaning, by only attempting to centre objects known to be stars. The SExtractor positions help in defining the projection of the catalogue, at the epoch of the plate material, onto the ,-system of each plate so the Gaussian centering can be performed at the projected star locations.
The input catalogue we use is the UCAC2 – The Second USNO CCD Astrograph Catalogue (Zacharias et al. 2004). UCAC2 is the logical choice as it will also be used to provide the second-epoch positions that will eventually be combined with our CdC measures to calculate proper motions. At present, it represents the most precise astrometry (0020 – 0075) available that reaches to the magnitude limit of the CdC plate material.
In practice, UCAC2 stars are identified within the list of SExtractor detections by positional coincidence, and their SExtractor centroids are used to determine a 4th-order polynomial plate solution by least-square fitting. The plate solution then allows the full list of UCAC2 celestial coordinates to be properly projected onto the ,-system of the plate scan. These projected ,’s are then used as approximate input positions to determine refined centres for all UCAC2 stars that appear in the plate scan. This process of Gaussian centering with an input list from UCAC2 positions is done for both simple and triple exposure plates.
4.1 Elimination of grid lines
The presence of the réseau on the plates creates a large number of non-stellar detections by SExtractor along the grid lines. These can be identified geometrically and then eliminated from the list of detections so as not to confuse and spoil the plate solution and the subsequent UCAC2 projection onto the plate.
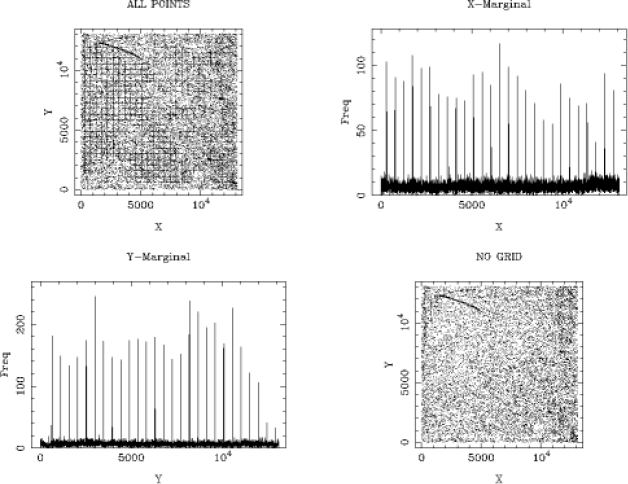
Therefore, a method for eliminating the grid lines has been developed. The marginal distribution along the scan axis is formed by calculating the binned distribution of coordinates of all detections on the plates. Similarly, a marginal distribution is formed. Sample marginal distributions are shown in Fig. 5.
The rectangular grid is sufficiently well aligned to the and axes of the scan, such that a pattern of peaks is seen in the marginal distributions caused by the large number of detections along the grid lines. Knowing the nominal spacing of the grid lines (roughly 480 pixels), it is relatively straightforward to detect their presence in the marginal distributions in an automatic way. Basically, one starts with the highest peak in the distribution, then searches for other peaks around the known distance from the previous peak. Once the and locations of the grid lines are determined, all points within 1 pixel of the grid lines are assumed to be a spurious grid detection and are flagged as such.
From a visual inspection of the plates, it is seen that the scanning orientation is not, in general, perfectly aligned with the grid lines on the plate. They differ by a small rotation angle. The code calculates and includes this angle in its mapping of the grid lines, allowing the grid detections to be eliminated without the need to rotate the original positions.
4.2 Treatment of triple-exposures plates
On the plates with triple exposures, the three images of a bright star will blend to form a central blob that is detected as a single image by SExtractor. The automatic matching between UCAC2 and SExtractor positions is heavily weighted by the brightest stars in both lists, so that the plate solution it produces provides the transformation between UCAC2 coordinates and the centre-of-light of the three exposures. In order to predict locations on the plate for the other three exposure systems, the relative positions of these three images with respect to the centre-of-light position must be determined.
The telescope offsets used during the observations attempted to place the three images in a roughly equilateral triangular pattern, in theory on a side, or 12 pixels in our scans. However, the offsets vary significantly (Fig. 6) from plate to plate and must be determined individually. There is also an expected variation in the triangular pattern as a function of position across each plate, due to the slightly different telescope tangent point of each exposure. This quadratic (plate-tilt) variation is small enough that for the purposes of identifying images by positional coincidence can be ignored. We have developed a method for calculating the offsets of the three another and to the blended centre-of-light system. It involves calculating the and separations between each detection and the other detections in its neighbourhood, and then searching for high-density clustering within this 2D separation space. The relative offsets of the three exposures, i.e., the vertices of the triad exposures, are then deduced from the relative positions of these clusterings.


For each plate we determine the relative offsets, and , where and range from 1 to 3, the three vertices of the triple exposures. Distributions of the exposure separations are shown in Fig. 6 where . Running the procedure on 223 triple-exposure plates, the mean relative distances of the vertices are found to be pixels and pixels. The large dispersions about the mean values clearly show the need for separate offset calculations for each individual plate.
These offsets are applied, in turn, to the predicted centre-of-light locations of the UCAC2 stars in order to get the location of these stars in each of the three offset exposure systems (Fig. 7). The 2D Gaussian centering is then performed using each of the three input lists. Because of (variable) blending across the plates, not all the objects in the input list center successfully. This will affect the completeness of the final catalogue. A loss of up to 15% of stars can be expected due to interferences with the grid lines and spurious flaws, as well as the blending of the triple exposures.
5 Distortion introduced by the scanner
As noted earlier, the imperfect nature of the scanner will deform the scanned image, imparting a distortion into its measured positions. As an aid in understanding the expected functional dependencies, we present a heuristic model of the distortions introduced, and they affect the true positions , giving rise to the measured positions .
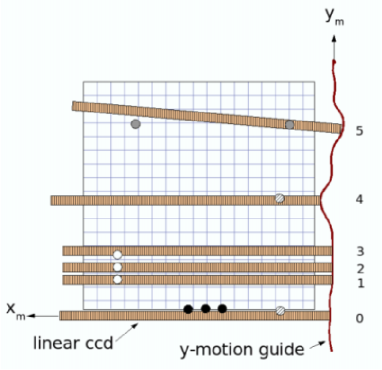
Figure 8 illustrates several of the expected distinct types of scanner distortions. Each type of deviation, labeled by position in the figure, will have a functional dependence associated with it as described in detail below.
-
•
The sample stars shown in black are evenly spaced in , but unless the linear ccd is perfectly straight and has ideal ruling, the measured values will not be evenly spaced (see Position 0). This is an error in as a function of (which may be equally well expressed as a function of either or ).
-
•
The three white stars are evenly spaced in , but the motion of the ccd along is irregular. Although the scanner is designed to move regularly from position 1 to 2 to 3, in fact it skips and slips and measures the third star incorrectly (see Positions 1, 2, 3). This type of displacement produces the most significant distortion seen in our scanner, resulting in large-amplitude errors in as a function of .
-
•
The two stars marked with hatching have the same position, but because of the bump in the rail guiding the y-motion of the ccd, when the second star is measured, its value will appear lower. This is an error in that is a function of (see Position 4).
-
•
Finally, the ccd might not remain exactly perpendicular as it moves in . The two grey stars have the same position, but the scanner will measure different values of because the stars are separated in . This is an error in that is function of (see Position 5).
The assumed stability of the solid-state detector, oriented along the -axis, suggests that the deviations described above are separable along the two scan axes. Furthermore, by scanning each plate in two orientations, rotated by 90∘, the large deviations can be corrected by comparison to the positions of the complementary scan. The details of the correction procedure we have developed are given below. The explicit use of subscripts t and m meant here to distinguish between measured and true coordinates. We will drop the m subscript at this point, since all subsequent references to coordinates will be measurements.

5.1 Scanner-distortion correction
As discussed, the flatbed scanner is expected to introduce substantial distortions into the scanned image, hence positions, and these must be corrected before being transformed into celestial coordinates. Based on the manner in which the scanner is built and operates, we expect any image distortion along the -axis to be constant from scan to scan. That is, the systematic error in as a function of will always be the same, although we don’t know the form of that distortion. The distortion in is expected to change with each scan, because of unpredictable slippage as the carriage moves. We note that one might expect some portion of the -distortion to be stable from scan to scan and, in fact, this is seen. Yet there is still a significant component that varies from plate to plate on top of the common component, resulting in the total deviation.
This behaviour suggests a two-step procedure for removing the distortion caused by the scanner. First, the presumed constant metric of the scanner’s -axis will be utilised to remove the deviations in both and caused by the unpredictable -motion of the scanner, by comparing rotated scans of the same plate. This allows us to put both and measures of both scans onto the metric defined by the -axis of the solid-state detector. Second, the remaining unknown but constant form of the -axis distortions, which by then will be present in both axes, will be determined by comparison to an external source - the independent measures from the contemporaneous AC plate material described by Urban et al. (1998). The constancy of the -distortion allows the residuals from the AC comparison to be stacked for many fields, yielding a well-determined 2D final correction mask that is applied to all plates.
An overview of our scanner-correction pipeline is as follows, with details of the procedures described in the next two subsections:
-
•
correction of a deviation in as a function of by comparing rotated scans of the same plate, implicitly adopting the scanner’s -axis to define a stable system for both axes;
-
•
correction of a remaining deviation of as a function of , again using comparison of rotated scans;
-
•
correction of a roughly cubic polynomial distortion that is common to all scans; followed by
-
•
correction of the deviations in the adopted -axis system from geometric linearity by comparison to independent, external AC measures.
5.1.1 Internal scanner-distortion correction
Utilising the presumed stability of the -axis, we use the repeated, 90∘-rotated scans A and B, to transform all measures onto the “system” of the scanner’s measures, i.e., the metric defined by the solid-state detector. Residuals from a polynomial transformation between scans A and B, shown in Fig. 9, clearly show the 1D function that dominates the measure distortion for a typical plate. The function is well-defined in the bottom panels that correspond to a general cubic solution between booth scans. More precisely, these residuals indicate that portion of the shape of the distortion that is of a higher order than what can be described by the cubic polynomial transformation model. The large cubic-polynomial component turns out to be common among all scans, and thus we have chosen to calculate and correct for it after we make the corrections of the scan-to-scan varying deviations such as shown in Fig. 9. This common component to the distortions will be tackled after the scan-to-scan variations are addressed.
The errors incurred by the motion of the carriage along are erratic and range up to m in size, indicating that the scanner has a significant problem with slippage and non-uniform motion of the carriage. Our overall strategy for this internal-correction step will be to first treat these large-amplitude distortions and then to address successively smaller ones, as they reveal themselves.
For a given pair of scans, there are two 1D -axis functions to be determined. These functions are essentially the differences between scan A’s -axis and scan B’s distorted -axis and between scan A’s distorted -axis and scan B’s -axis. The appropriate residuals are used to define the 1-d functions of the distortion pattern, employing the technique of “Weighted Sliding Polynomial” (Stock & Abad 1988) to parametrize the functions.
There is a high degree of similarity in the distortion pattern of the successive scans A and B. Over time, this -distortion pattern changes substantially. Figure 10 displays the pattern for four different plates scanned days to weeks apart. It is for this reason that the -distortion function for each scan is derived separately, despite a superficial similarity between successive scans.
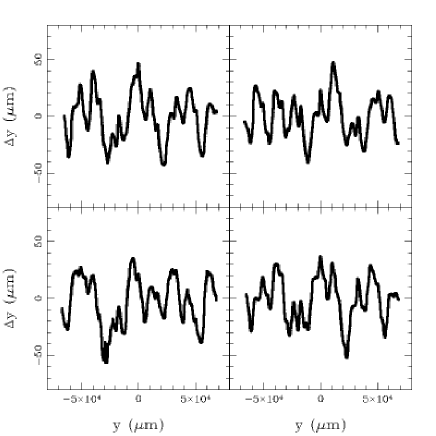
Once the 1D -axis function is determined for each scan, it is applied to the measures of the scan. (The underlying, common cubic-polynomial component will be applied later.) Residual plots from another cubic solution made subsequent to the -axis correction reveals a smaller, but easily measured, cross-axis distortion, a deviation in as a function of . An example of this smaller deviation is shown in Fig. 11.
After application of this second 1D correction function (Fig. 11), the residuals show no remaining discernible systematics. Specifically, the other possible cross-axis distortion, illustrated at position 5 in Fig. 8, does not seem to be exhibited by this scanner. Thus, no correction for this type of distortion is made.


Early tests indicated that the cubic-polynomial component of the scanner distortion is stable and common to all scans. To be precise, what we address here is the difference in a cubic-polynomial deviation along the -axis and along the -axis, since we only have our scan A/B pairs in these internal comparisons to characterise it. Nonetheless, having recognised this component as stable and common to all scans, it was decided to calculate it based on stacked residuals from all scan A/B pairs. We do so by first applying the two 1D (scan-to-scan varying) corrections described above and then performing a simple linear transformation between the resulting scan A and scan B positions. The residuals from these linear transformations are then stacked into a common 2D vector plot and a correction mask is determined. This single mask, which effectively describes the cubic-polynomial modelled in the previous steps, is then applied to both scans of each plate. In practice, a second series of linear solutions, residual stacking, mask construction, and application is performed, to ensure that the systematics are removed to the greatest possible extent.
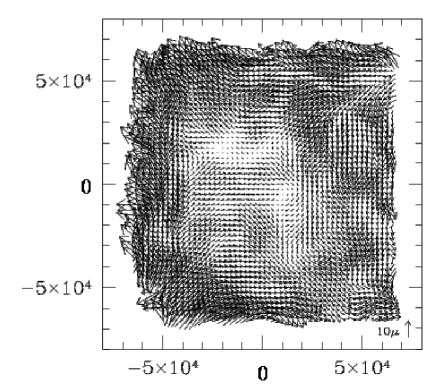
To provide an illustration of the relative amplitudes of the common (cubic) scanner distortion and the plate-to-plate-varying 1D deviation functions that reside on top of it, as well as to demonstrate the validity of using a single mask to describe the common component, Fig. 12 shows the vector residuals for a sample plate’s A/B scan pair before and after each of these two corrections have been made. The left panel indicates the residuals from a linear transformation between scans A and B before any corrections have been applied. The middle panel shows the residuals if only the common component is corrected, as represented by the mask constructed from the stacked residuals. Note the factor of 20 change in plotting scale of the vectors. The third panel shows the residuals after also correcting both scans with their appropriate 1D functions along both axes. Figure 12 is for illustration purposes, as in practice the corrections are not performed in this order. However, the vast improvement seen by applying of the common mask alone, as well as the lack of systematics in the residuals of the final internally-corrected positions, validate that this component is well-described by the common mask.
Figure 13 shows the magnitude of the common, approximately cubic distortion in an absolute sense. Compare the amplitude of the variations with those of the 1D deviations illustrated in Fig. 9. If not for the inclusion of general cubic terms when generating the residuals shown in Fig. 9, the 1D deviation functions could not have been so well-determined.
Summarising the internal portion of our scanner-distortion correction procedure, Table 1 shows the improvement in precision attained by tracking the dispersion of positional differences between rotated scan pairs at each step in the process.
| Step | RMS x () | RMS y () |
|---|---|---|
| Initial (uncorrected) | 31.2 | 32.9 |
| 1-d function corrected | 18.2 | 23.0 |
| Correction cubic pattern | 4.61 | 4.42 |
| 2nd iteration cubic pattern | 4.52 | 4.31 |
5.2 External scanner-distortion correction
At this point in the reduction pipeline, the measures will have been corrected as much as possible using internal comparisons. These internally-corrected measures will still contain a systematic distortion that corresponds to the unknown figure of the scanner’s solid-state detector that defines the scan axis. Presumably, this distortion is a 1D function of position, to which both axes have now been transformed and which should be consistent from scan to scan. This remaining distortion can only be determined by comparison to an external catalogue or set of measures.
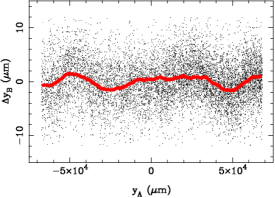
As external reference we use the existing measures of the AC, described by Urban et al. (1998) and used in the construction of the AC2000 Catalogue. These manual measures are of similar plate material, having been taken with the same telescope as our CdC plates. The original AC measures, in digital form, were made available to us by the staff of the USNO. Any systematic differences between the AC measures and our internally-corrected positions will be dominated by the expected remaining scanner distortion, i.e., that due to the geometric non-linearity of the scanner’s solid-state detector. The AC measures are used to correct this distortion in the following manner.

Our internally-corrected scanner measures are transformed to the system of the AC measures by a linear transformation. Initially, the rms of the resulting residuals is . The residuals, as a function of , is then used to create a correction mask. However, there are not enough AC stars on any given plate to do so reliably. Therefore, residuals from a large number of plates are stacked, a correction mask is constructed from these, and then it is applied to every plate’s measures, (see Fig. 14). The resulting rms, after correction for this common pattern, becomes .
The estimated positional errors of the AC measures are a function of declination zone (Urban et al. 1998). For the San Fernando zone, the errors are about 030 to 035, which at the scale of the plates (60) corresponds to 5 to 6 . Thus, achieving an rms in the differences of indicates that our corrected scanner positions have errors less than for a single scan. In the following section, a combined overlap solution will allow a better estimate of the uncertainties in the corrected scanner positions.
Based solely on scan A/B residuals, though, the final resulting single-measurement internal-error estimate for well-measured stars, is
-
•
For simple-exposure plates the and uncertainties are (3.18m, 3.15m) = (019 , 018).
-
•
For the triple-image plates, the corresponding uncertainties are (5.52m , 5.09m) = (033 , 031).
6 Transformation to celestial coordinates
Conversion to celestial coordinates and estimation of the resulting precision, as well as the exploration of any remaining systematic errors, are described in order to evaluate the astrometric quality of the CdC-SF plate/scanner combination. The scientific value of the final astrometry will be in its potential usefulness in providing first-epoch positions for deriving proper motions. Thus, we analyse the CdC-SF positions within this context, while the construction of a proper-motion catalogue based upon them is currently under construction.
A transformation from coordinates into celestial coordinates () has been made using the block-adjustment technique (Stock 1981) including a determination of the field distortion (Abad 1993). This technique utilises not only external catalogue reference stars but also common images in overlapping plates corresponding to the same star. A system of link conditions is established, which reduces all of the plates simultaneously. It imposes the condition of best fit with respect to the reference catalogue, but also internal agreement of overlapping measures. Linear plate solutions in combination with a corrective mask common to all plates are derived and applied in an iterative process. The preliminary solutions for each individual plate are determined using a subset of reference stars identified to initialize the process.
For the purposes of these CdC-SF plate measures, “overlapping” images are broadened to include multiple scans of the same plate, as well as star images that do actually fall in the overlap area of adjacent plates. That is, after transforming both A and B scans onto a common system, and after having applied the various corrections described in the previous section, the and values from each rotated scan will be treated as if they were from separate plates.
The Tycho-2 Catalogue (Høg et al. 2000) is used as the reference catalogue, with its proper motions being used to back-date the coordinates to the epoch of the CdC-SF plates. The Tycho-2 proper motions have a precision of 2.5 mas/yr and, with a magnitude limit of V11.5, the catalogue provides a sufficient star density. Abad (1993) has demonstrated that the overlapping technique does not require a particularly dense grid of reference stars.
Alternatively, the deeper UCAC2 catalogue could have been used as a reference, but we have decided against this. While the estimated precision of the UCAC2 proper motions is only slightly inferior to that of Tycho-2, it is suspected that its systematic errors may be significantly larger. This is due to problems in the “yellow sky” catalogue used as first-epoch material in deriving the UCAC2 proper motions. The yellow-sky catalogue is based on photographic plates from the Lick NPM and Yale/San Juan SPM programs, which are known to suffer from significant but correctible magnitude equation. As a sacrifice to expediency, the standard magnitude-equation corrections adopted by these programs was not applied during construction of the yellow-sky catalogue. It is the bright end of the NPM/SPM plate material that is most susceptible to these magnitude-equation problems, precisely the magnitude range in common with the CdC-SF plates. For this reason, and again noting that it has sufficient star density, Tycho-2 is our choice of reference catalogue for this application111We point out that a revised version of the UCAC2, to be called the UCAC3, is currently under construction by USNO. The new proper motions will be based on an improved reconstruction of the yellow-sky catalogue, one that makes explicit magnitude-equation corrections..
While the overlap method allows for the reduction of the entire set of plates, it was decided to divide the plates into four groups by right ascension. This allows us to compare the results in areas of low and high star density and to adjust relevant parameters of the reduction process accordingly. Each group spans two hours in right ascension and all seven declination zones of the CdC-SF.
Not all of the measured plates were included in the final reduction. Triple-exposure plates have poorer quality than simple-exposures ones, as demonstrated in the previous section. Nevertheless, they are, in general, helpful for the overlap solution in determining field distortion and possible systematic errors at faint magnitudes. Also, these plates can reinforce the solution of the simple-exposure plates via the overlapping conditions. However, in order to avoid spoiling the accuracy of the final catalogue, only the best triple-exposure plates are included, those with final measuring error less than 7m. The included set of higher-quality plates has an average single-measurement internal precision of 02 in each coordinate. All of the simple-exposure plates were included except for a handful that upon manual inspection had failed in part during the image detection process. In summary, we used 170 of the 180 simple-exposure plates and 100 of the 240 triple-exposure plates. In the reduction technique, triple-exposure plates are considered as three independent plates. No blended images are included.
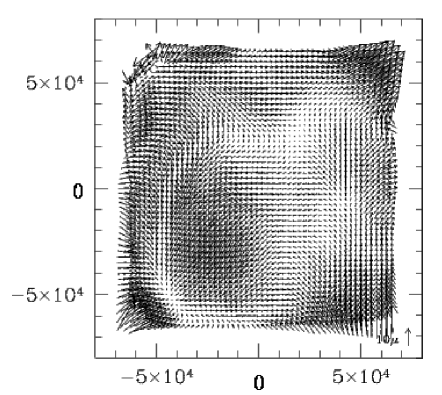
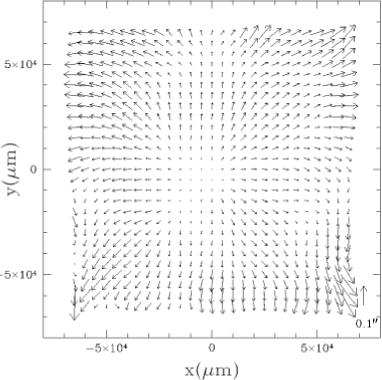
During each iteration, calculated stellar coordinates from the various plates are averaged to derive a mean position for each star. Residuals are obtained as differences between individual positions and their average, if the star is not in the reference catalogue. If the star is identified as a reference, we also calculate the residual difference between the average position and the catalogue position. Both types of residuals from all plates are then stacked as a function of position and plotted as a vector field, assigning higher weights to the residuals formed with the Tycho-2 catalogue than those formed between overlapping plates. The pattern in Fig. 15 shows the stacked residuals, which are used as a representation of the systematic field distortion remaining in the plates. This function is then applied to the positions and a new iteration of the astrometrical reduction performed.
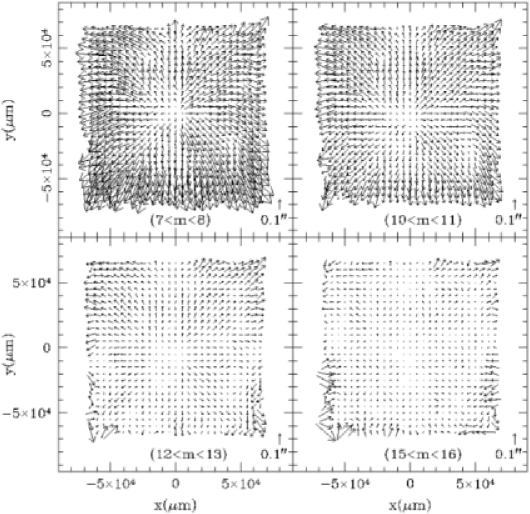

Different correction masks are derived by binning stars into one-magnitude wide intervals (Fig. 16) to determine the magnitude dependence of the systematic errors. Weighted interpolation within these masks provides the corrections to be applied as a function of magnitude. It is seen that the distortion is more pronounced at bright magnitudes. After this correction is made, a slight residual magnitude equation is found, fitted, and corrected for, based on differences with the reference catalogue (Fig. 17). While the Tycho-2 reference stars do not span the entire magnitude range of our sample, we feel there is sufficient magnitude overlap, and thus leverage, to linearly extrapolate the remaining couple of magnitudes to the faintest stars in our sample.
7 Evaluation of the final astrometry
An estimated error for each star in our demonstration area is derived based on the rms of the positional differences of the images that contributed to the average position. The distribution of the errors as a function of magnitude for the entire catalogue is shown in Fig. 18 and given in Table 2 separated by right ascension grouping. The mean values of these uncertainties are for the entire sample, and for stars brighter than 14, the mean values are . The final line in the table also lists the rms differences between our derived positions and the Tycho-2 catalogue, at the CdC-SF epoch. These rms differences are expected to have a significant, possibly dominant, contribution from the Tycho-2 positions at this epoch.
| Area | ||||||||||||
|---|---|---|---|---|---|---|---|---|---|---|---|---|
| Magnitude | ||||||||||||
| 8 | 0.10 | 0.11 | 146 | 0.12 | 0.10 | 114 | 0.12 | 0.16 | 43 | 0.08 | 0.09 | 65 |
| 9 | 0.11 | 0.11 | 1066 | 0.11 | 0.10 | 710 | 0.11 | 0.12 | 369 | 0.11 | 0.10 | 361 |
| 10 | 0.12 | 0.12 | 5437 | 0.12 | 0.11 | 3009 | 0.13 | 0.12 | 1616 | 0.13 | 0.11 | 1368 |
| 11 | 0.11 | 0.10 | 16786 | 0.11 | 0.10 | 7414 | 0.13 | 0.12 | 3445 | 0.13 | 0.11 | 3193 |
| 12 | 0.10 | 0.10 | 34489 | 0.11 | 0.10 | 13918 | 0.13 | 0.12 | 5691 | 0.13 | 0.13 | 5077 |
| 13 | 0.11 | 0.11 | 61426 | 0.12 | 0.11 | 24092 | 0.15 | 0.14 | 8714 | 0.15 | 0.14 | 7843 |
| 14 | 0.22 | 0.20 | 119957 | 0.23 | 0.21 | 46563 | 0.24 | 0.22 | 15161 | 0.26 | 0.24 | 15267 |
| 15 | 0.32 | 0.31 | 84942 | 0.32 | 0.30 | 30315 | 0.31 | 0.30 | 8916 | 0.33 | 0.31 | 9042 |
| Total | 0.21 | 0.19 | 324335 | 0.20 | 0.19 | 126142 | 0.21 | 0.19 | 43960 | 0.22 | 0.21 | 42227 |
| 0.30 | 0.33 | 19066 | 0.34 | 0.35 | 9127 | 0.42 | 0.34 | 4168 | 0.37 | 0.33 | 4028 | |
We note that the global plate-overlap solutions involved the use of both simple and triple-exposure plates to determine the plate distortions and alignments better. However, in compiling the final star positions one has the choice of whether to include images from triple-exposure plates in the position averages. Doing so will improve completeness while slightly eroding the overall precision. The uncertainties quoted above were based on inclusion of the triple images in the final positions. The mean values of the uncertainties using only the simple-exposure plates for the final compilation are for the entire sample.

A comparison of our catalogue with Tycho-2 positions at the CdC plates’ epoch as a function of magnitude shows no systematic pattern, mean differences remaining constant over all magnitudes. Thus our sample can be considered to have been successfully placed on the system ICRS, as defined by Hipparcos, via Tycho-2.
Our uncertainty values agree well with results from other groups deriving astrometry from similar plate material, although from other CdC collections. Table 3 lists the single-plate precision, as well as the accuracy over extended multi-plate areas that is obtained in these various studies. The significant difference between the present study and the others is their use of much more sophisticated measuring machines to measure the plates. Specifically, those studies make use of the APM (Rappaport et al. 2006), a PDS (Ortiz-Gil et al. 1998), and the MAMA (Geffert et al. 1996). By using an inexpensive flatbed scanner and the procedures presented here, comparable astrometric precision and accuracy are obtained. This suggests that limitations intrinsic to the CdC plate material are determining the final astrometric precision in all cases.
| Reference | Machine | Precision | Accuracy | |
|---|---|---|---|---|
| This paper | Scanner | 400 | ||
| Rappaport 2006 | APM | 512 | ||
| Ortiz-Gil 1998 | PDS | 1 | ||
| Geffert 1996 | MAMA | 2 |
Another property of our demonstration sample that needs to be characterised is its completeness. This will obviously be an important aspect of any future catalogue to be based on scanner measures of CdC plates. Our demonstration catalogue contains positions and estimated uncertainties for approximately 560 000 stars that have been selected using the following criteria: (1) the star must match with a counterpart in the UCAC2 catalogue within 35 of tolerance at the CdC plate epoch, (2) duplicate measures, from different plates, within 30 of tolerance are combined into a single entry by averaging the positions, and (3) the star must appear in at least 2 different plate scans, ensuring the minimum constraint that each star’s image be present in both scan rotations.
The input catalogue from which the list of CdC-SF objects has been derived is based on the UCAC2 catalogue. For this reason the upper limit of our area’s completeness is set by that of the UCAC2. However, the properties and condition of the plates and the number of plates not included in the reduction, as well as the automated nature of the reduction pipeline, produce additional losses. Figure 19a shows the relative completeness of CdC-SF compared to UCAC2. Presumably, modifications to the automated pipeline could improve the completeness of our procedures, most notably on the bright end. For instance, bright stars that failed to centre because of extreme saturation may be recovered by fitting with the tepui function (Vicente & Abad 1999) specifically developed for such saturated profiles.


The magnitudes used in constructing both panels of Fig. 19 are extrapolated estimates of made from 2MASS photometry that is included in the UCAC2 catalogue. This so-called pseudo- follows the empirical relation given by Girard et al. (2004)
This approximation works reasonably well over a range of spectral types and allows us to compare the magnitude distributions of various catalogues on a common system, such as is shown in Fig. 19b. Our CdC-SF sample is compared to the Hipparcos, Tycho-2, and UCAC2 catalogues extracted over the same area of sky. The faint-end turnover in the (logarithmic) distribution of our CdC-SF sample is at V=15.1.
As an aside, we note that a crude magnitude estimate was calculated for all stars in our sample, based on calibrating the instrumental magnitude estimates of the Gaussian centering algorithm with the admittedly very approximate magnitudes of the UCAC2 catalogue. A simple polynomial transformation was adopted, and this gave poor results due, presumably, to both the mismatch in passbands and the crude UCAC2 photometry used as reference. These magnitudes were nonetheless adequate as indicators of magnitude when required in the astrometry reduction pipeline. They are also the magnitudes used in all plots, other than Fig. 19, presented in this paper, whenever residuals are shown as a function of magnitude. For this they are also adequate.
Our primary emphasis is astrometry, with the goal of eventually producing an absolute proper-motion catalogue. Photometry is of secondary priority. In order to eventually provide reasonable photographic photometry, a program is currently underway to calibrate the scanner-based instrumental magnitudes using observations made with the 0.8-m Telescope IAC-80 (Observatorio del Teide, Tenerife). At this time, we do not have enough observations (just five fields of ) to cover our demonstration area. In the future, a combination of these standards, along with brighter, secondary calibrations, e.g., Tycho-2 stars, will provide a means of calibrating our scanner-based instrumental magnitudes better.
8 Conclusions and future plans
The 1260 original Carte du Ciel plates, San Fernando zone, have been resurrected in a digital form by use of a commercial flatbed scanner. A method of removing the mechanical distortion introduced by the scanner is presented. A final measuring accuracy of 02 is achieved, similar to what has been obtained in other studies using specialized plate-measuring machines for similar plate material.
Currently, one third of the CdC-SF collection has been measured and reduced (420 plates). This demonstration area has yielded positions at epoch 1901.4 for 560 000 stars, covering a total area of 1080 deg2 in the sky. This sample has a completeness of 85% in the range 7.0 V 14.5. The positions are on the ICRS system defined by Tycho-2 at the epoch of the observation. Internal error estimates are based on multiple exposures for the same star from overlapping plates (02). External comparison with the Tycho-2 positions (rms of the differences of 03) shows that the quality of our measures is as good or better than obtained for the AC project, but extends to fainter magnitudes.
Thus, internal precision and external uncertainty estimates that match those attained with more precise machines for CdC plates demonstrate the potential of this flatbed-scanning and reduction method for exploiting these historical plates.
The early epoch positions derived in our demonstration area are currently being combined with UCAC2 modern positions to calculate absolute proper motions that make use of this long-time baseline. Additionally, the full CdC-SF zone, all 24 hours of right ascension, has been digitized with the flatbed scanner described here and will be reduced following similar procedures. Ultimately, the resulting astrometric catalogue will provide a useful tool in the examination of Galactic structure and kinematics.
Acknowledgements.
We are very grateful to the Observatorio de San Fernando for making the Carte du Ciel plates available to us from their historical archive. We also want to thank all of the people who have participated in the digitization of the collection, with special mention to José Muiños, Fernando Belizón and Miguel Vallejo. The authors wish to thank Terry Girard of Yale University (USA) for providing us with portions of the software used in this work and for very useful discussions and comments during this study.References
- Abad (1993) Abad, C. 1993, A&AS, 98, 1
- Abad & Vicente (1999) Abad, C., & Vicente, B. 1999, A&AS, 136, 307
- Auer & van Altena (1978) Auer, L. H., & van Altena, W. F. 1978, AJ, 83, 531
- Bertin & Arnouts (1996) Bertin, E., & Arnouts, S. 1996, A&AS, 117, 393
- Dick et al. (1993) Dick, W. R., Tucholke, H. J., Brosche, P., Galas, R., Geffert, M., & Guibert, J. 1993, A&A, 279, 267
- Geffert et al. (1996) Geffert, M., Bonnefond, P., Maintz, G., & Guibert, J. 1996, A&AS, 118, 277
- Gill (1898) Gill, D. 1898, MNRAS, 59, 61
- Girard et al. (2004) Girard, T. M., Dinescu, D. I., van Altena, W. F., Platais, I., Monet, D. G., & López, C. E. 2004, AJ, 127, 3060
- Høg et al. (2000) Høg, E., Fabricius, C., Makarov, V., Urban, S., Corbin, T., Wycoff, G., Bastian, U., Schwekendiek, P. & Wicenec, A. 2000, A&A, 357, 367
- Lamareille et al. (2003) Lamareille, F., Thiévin, J., Fournis, B., Grimault, P., Broquet, L., & Davoust, E. 2003, A&A, 402, 395
- Lattanzi et al. (1991) Lattanzi, M. G., Massone, G., & Munari, U. 1991, AJ, 102, 177
- Lee & van Altena (1983) Lee, J. F., & van Altena, W. F. 1983, AJ, 88, 1683
- Ortiz-Gil et al. (1998) Ortiz-Gil, A., Hiesgen, M., & Brosche, P. 1998, A&AS, 128, 621
- Rapaport et al. (2006) Rapaport, M., Ducourant, C., Le Campion, J. et al. 2006, A&A, 449, 435
- Stock (1981) Stock, J. 1981, RMxAA, 6, 115
- Stock & Abad (1988) Stock, J., & Abad, C. 1988, RMxAA, 16, 63
- Urban et al. (1998) Urban, S., Corbin, T., Wycoff, G., Martin, J., Jackson, E., Zacharias, M., & Hall, D. 1998, AJ, 115, 1212
- Vicente & Abad (2003) Vicente, B., & Abad, C. 2003, Astronomy in Latin America, 31
- Zacharias et al. (2004) Zacharias, N., Urban, S., Zacharias, M., Wycoff, G., Hall, D., Monet, D., & Rafferty, T. 2004, AJ, 127, 3043