NEAR-INFRARED STUDY OF THE CARINA NEBULA
Abstract
We have carried out near-infrared (NIR) imaging observations of the Carina Nebula for an area of 400 arcmin2 including the star clusters Trumpler 14 (Tr 14) and Trumpler 16 (Tr 16). With 10 limiting magnitudes of 18.5, 17.5 and 16.5, we identified 544 Class II and 11 Class I young star candidates. We find some 40 previously unknown very red sources with , most of which remain undetected at the band. These young star candidates provide a comprehensive sample to diagnose the star-formation history of this massive star-forming region. The red NIR sources are found to be concentrated to the south-east of Tr 16, along the ‘V’ shaped dust lane, where the next generation of stars seems to be forming. In addition, we find indications of ongoing star formation near the three MSX point sources, G287.51-0.49, G287.47-0.54, and G287.63-0.72. A handful of red NIR sources are seen to populate around each of these MSX sources. Apart from this, we identified two hard X-ray sources near G287.47-0.54, one of which does not have an NIR counterpart and may be associated with a Class I/Class 0 object. The majority of the Class II candidates, on the other hand, are seen to be distributed in the directions of the clusters, demarcating different evolutionary stages in this massive star-forming region. A comparison of the color-magnitude diagrams of the clusters with pre–main-sequence (PMS) model tracks shows that the stellar population of these clusters is very young ( 3 Myr). The -band luminosity function (KLF) of Tr 14 shows structure at the faint end, including a sharp peak due to the onset of deuterium burning, implying an age of 1–2 Myr for the cluster. The KLF of Tr 16, in contrast, is found to rise smoothly until it turns over. The slopes of the mass functions derived for the clusters are found to be in agreement with the canonical value of the field star initial mass function (IMF) derived by Salpeter (1955).
1 INTRODUCTION
The Carina Nebula (NGC 3372) is one of the most active star-forming regions of the Milky Way Galaxy harboring more than a dozen star clusters (Feinstein, 1995). Trumpler 14 and Trumpler 16 (Tr 14 and Tr 16 hereafter), located in the central part of the Nebula, are the youngest and the most populous clusters of this region. There are at least 31 O type stars in these two clusters (Feinstein, 1995), with six exceedingly rare O3 type main-sequence stars. Tr 16 hosts Carinae, which is a typical luminous blue variable and arguably the most massive star of the Galaxy (Massey & Johnson, 1993). There are also three Wolf-Rayet (WR) stars in this region, HD 93162, HD 92740 and HD 93131, of which, HD 93162 is most certainly a member of Tr 16, whereas the other two are likely members of Tr 16 but are located about 25 to the west and south of Carinae respectively (Walborn, 1995).
These clusters, owing to their rich stellar contents, are extensively studied in different wavelengths. For instance, Massey & Johnson (1993) presented optical photometry and spectroscopy of the brightest and bluest stars of the clusters. Cudworth et al. (1993) carried out a proper-motion study of nearly 600 stars of the clusters with a limiting V magnitude of 15.5. Recently, a multiwavelength imaging study of the clusters was carried out by Tapia et al. (2003), in which they studied the cluster properties and estimated the ages of these clusters to be between 1–6 million years. The molecular cloud observations of the Nebula have been made by several groups. Two large CO emission regions are found, known as the northern cloud and the southern cloud (de Graauw et al., 1981; Whiteoak & Otrupcek, 1984), both of which are believed to be a part of a much larger Carina molecular cloud complex with a mass in excess of 5105 and a projected length of 130 pc (Grabelsky et al., 1988). The molecular gas in the vicinity of Tr 16 has been photoevaporated and a large cavity can be seen in the northern molecular cloud (Cox & Bronfman, 1995; Brooks et al., 1998), whereas a strong interaction seems to be occurring between Tr 14 and the northern molecular cloud. As for the distribution of the ionized gas, a large ionized region is found with two concentrations, known as Car I and Car II, located to the west of Tr 14, and to the north of Carinae respectively (Gardner & Morimoto, 1968; Brooks et al., 2001).
The reported distance modulus for Tr 16 ranges from 11.8 (Levato et al., 1981) to 12.55 (Massey & Johnson, 1993), and for Tr 14, from 12.20 (Feinstein, 1983) to 12.99 (Morrell et al., 1988). It has been shown by Turner & Moffat (1980) and Massey & Johnson (1993) that the two clusters are located at the same distance from the sun, whereas some groups have found that they are located at slightly different distances (Walborn, 1973; Morrell et al., 1988). For our study, we have assumed a common distance of 2.5 kpc for both the clusters.
The picture emerging of this massive star-forming region in the last decade suggests that the star formation activity is still ongoing. The first evidence of star formation activity came out in the study by Megeath et al. (1996), in which they found an object, IRAS 10430-5931, to be associated with a bright rimmed globule to the south-east of Tr 16, along the thick ‘V’ shaped dust lane that bisects the Carina Nebula. Using the mid-infrared observations from MSX (Midcourse Space Experiment), and optical emission line observations, Smith et al. (2000) found several clumps along the edge of the dark cloud and to the east of Carinae, including the clump associated with IRAS 10430-5931. They remarked that these IR globules which lie behind the ionization fronts, in the periphery of the Nebula, are candidate sites of triggered star formation. In another case, Smith et al. (2003) identified numerous protoplanetary disk (proplyd) candidates in this region. Moreover, widespread photodissociation regions (PDRs) are also found throughout the Nebula on the surfaces of molecular clouds (Rathborne et al., 2002). In our earlier work on this region based on the data (Sanchawala et al., 2007, Paper I hereafter), we found a compact (2 pc across, assuming a distance of 2.5 kpc) group of ten X-ray sources, located close (4′) to IRAS 10430-5931 and along the ‘V’ shaped dust lane. This compact X-ray group is referred to as the Tr 16-SE group hereafter. More than half of the X-ray sources of the Tr 16-SE group are massive star candidates as judged by their X-ray and NIR properties (see Paper I). All the above examples seem to trace the current generation of star formation which is possibly triggered by the earlier generation of cluster stars [see, e.g. Chen et al. (2007) for examples of triggered star formation in OB associations].
In this paper, we present deep NIR imaging observations () covering 400 arcmin2 area, including the clusters Tr 14 and Tr 16. To aid and complement the identification of young stellar populations of the region, we made use of the X-ray sample of the region derived from the archival datasets, ObsIDs=1249, and 50 (Paper I), and ObsID=4495 (unpublished). For the color-composite image, readers are referred to Paper I. Though NIR imaging observations of Tr 14 and Tr 16 have been reported earlier, for example the recent work by Tapia et al. (2003), our observations are deeper by 2–3 magnitudes than any existing NIR observations. Moreover, we produce the most comprehensive sample of low-mass PMS candidates including Class I and Class II candidates identified based on the NIR colors, as well as Class II and Class III candidates identified based on the NIR and X-ray properties, as the first step to study how star formation proceeds in violent environments and the role massive stars play in the ongoing star-formation activity. The spatial distribution of sources suggests that star formation is in different evolutionary phases in this region with Tr 16 being the most evolved population. Tr 14 seems to be younger than Tr 16 based on the relative fraction of sources with NIR excesses. We construct the -band luminosity functions (KLFs) of the clusters to constrain the ages and initial mass functions (IMFs) of the clusters. The Tr 16-SE group shows a clear excess of sources relative to the field and thus should be an embedded stellar group or cluster. We also find strong indications of ongoing star formation near the three MSX sources, G287.51-0.49, G287.47-0.54, and G287.63-0.72. An approximate estimate of the initial mass functions (IMFs) of the clusters is also presented.
The paper is organized as follows. In §2 we present the NIR observations carried out at the InfraRed Survey Facility (IRSF), the data reduction procedures for the IRSF observations and the description of other datasets used in this work, i.e., 2MASS and . In §3 we present the results and discussions of our work and §4 summarizes the paper.
2 OBSERVATIONS AND DATA REDUCTION
2.1 InfraRed Survey Facility (IRSF)
2.1.1 Observations
The NIR imaging observations toward the Carina Nebula were carried out on 2003 April 1, 2, 9, and 10 using the SIRIUS (Simultaneous InfraRed Imager for Unbiased Survey) camera mounted on the IRSF 1.4 m telescope in Sutherland, South Africa. The camera is equipped with three HAWAII arrays, each of pixels and dichroic mirrors enabling simultaneous observations in the (1.25 ), (1.63 ) and (2.14 ) wavebands. It provides a plate scale of 045 for a field of view of 78 78. More details about the camera are discussed in Nagayama et al. (2003). We observed nine fields toward the Nebula (see Table 1 for the observation log) in 33 mosaics, with an overlap of 1 between the frames in both directions. The composite observed field is centered on the coordinates of Carinae, i.e., R. A. = and Decl. = (J2000.0), covering a total area of . For each pointing, 30 dithered frames were observed, each with an integration time of 30 s, giving a total integration time of 900 s. Two pointings (#5 and #6; see Table 1) observed on April 9, 2003 were affected by bad weather, so were re-observed on 2005 January 14. For these later observations, 45 dithered frames were observed, each with an integration time of 20 s, yielding again a total integration time of 900 s for each pointing. A reference field centered on R. A.= and Decl.= (J2000) was observed with the same integration time as for the target fields. The typical seeing (FWHM) during our observations ranged from 10 to 14 and the airmass from 1.2 to 1.5. For photometric calibration, the standard stars No. 9144 and 9146 from Persson et al. (1998) were observed on each night.
2.1.2 Data Reduction
We used the NOAO’s IRAF111IRAF (the Image Reduction and Analysis Facility) is distributed by the National Optical Astronomy Observatory, which is operated by the Association of Universities for Research in Astronomy, Inc., under cooperative agreement with the National Science Foundation package to reduce the IRSF data. The standard procedures for image reduction were applied, including dark subtraction, sky subtraction and flat field correction. The dithered images in each band were then combined for each pointing to achieve a higher signal-to-noise ratio. We performed photometry on the reduced images using the IRAF’s DAOPHOT package (Stetson, 1987). Since Carina Nebula is a very crowded region and with a large amount of diffuse emission in the NIR, the point spread function (PSF) photometry was performed. To construct the PSF for a given image, we chose about 10 bright stars well isolated from neighboring stars and located away from nebulosities or edges of an image. The task ALLSTAR of DAOPHOT was then used to apply the average PSF to all the stars in the image, from which the instrumental magnitude of each star was derived. The instrumental magnitudes were then calibrated against the standard stars observed on each night. The magnitudes we derived are in the SIRIUS color system. For the purpose of plotting this data in the color-color and color-magnitude diagrams, we have converted our magnitudes to the CIT system using the color conversion equations between the SIRIUS and CIT systems derived by Nakajima et al. (2005).
To remove spurious detections from our catalogues, the IRAF parameters sharpness and chi of the ALLSTAR task were used. These parameters measure the roundness of the object and the goodness of the PSF fit, respectively. Empirically, we found that with a cut at sharpness=1.5, and chi=4, we could eliminate most of the spurious detections and hence reduce much of the scatter in the magnitude error plot.
Since we performed photometry on individual pointings, the catalogues of all the pointings were merged in the end to produce the master catalogues of the composite field in the , , and -bands. For sources lying in the overlapping regions, the magnitudes varied by up to 0.1 mag. For these sources the average value of the magnitude was adopted.
We have obtained photometry for 41,000 sources in the band, 50,000 sources in the band and 36,000 sources in the band. Sources are saturated at 11 mag. The limiting magnitudes at 10 are estimated to be 18.5, 17.5, and 16.5, in the , , and bands, respectively. We estimated the completeness limits of our data by adding artificial stars in our images using the ADDSTAR package in IRAF. These artificial stars were added at a 0.5 magnitude interval and at random places in the images. The detection rate was then derived as a function of magnitude by calculating the fraction of the artificial stars that were recovered in the photometric analysis. This procedure was repeated five times. The 90% completeness limits of our data for the band varied from 15.0 to 15.7 mag, for the band from 14.7 to 15.2 mag, and for the band from 14.7 to 15.3 mag, though we detect sources by up to 3 magnitudes fainter in all the bands. For comparison, the 90% completeness limits for the reference field are reached at 17.25, 16.25, and 16.75 mag in the , , and bands, respectively. The higher number density of sources in the clusters as compared to the reference field, and the non-uniform diffuse NIR emission in the Nebula, are the reasons for shallower completeness limits for the clusters.
By using WCStools222http://tdc-www.harvard.edu/software/wcstools/, we converted our pixel coordinates to R. A. and Decl. coordinates. The USNO-A2.0 catalogue was utilized to select some common sources in the frames to get the transformation relation. The astrometric accuracy is estimated to be 0.5.
2.2 2MASS
Since sources brighter than 11 mag are saturated in our IRSF data, we made use of the 2MASS (Two Micron All Sky Survey)333This publication makes use of the data products from the Two Micron All Sky Survey, which is a joint project of the University of Massachusetts and the Infrared Processing and Analysis Center/California Institute of Technology, funded by the NASA and the NSF. database to study the bright-end of the stellar population. We downloaded the NIR sources from the 2MASS database within our observed IRSF field, with a certain constraints in order to select sources only with good photometric quality. For this, we used the 2MASS flags, namely, read flag, ’Rflg’, blend flag, ’Bflg’, and photometric quality flag, ’Qflg’. The ’Rflg’ and ’Bflg’ indicate the quality of photometry and the blending of a source, respectively, whereas the ’Qflg’ indicates the signal-to-noise ratio of the detection. For our source selection, we considered values of 1–3 for ’Rflag’, 1 for ’Bflag’, and ’A’ for ’Qflg’. The 2MASS magnitudes were also converted to the CIT system444http://www.astro.caltech.edu/ jmc/2mass/v3/transformations/ before combining with our IRSF sample.
2.3
To complement our NIR data, we use the X-ray sample of the Carina Nebula derived from the multiple datasets of the archival Chandra X-ray Observatory (Weisskopf et al., 2002) data. A sample of 450 X-ray sources derived from the merged datasets, ObsIDs=1249, and 50, observed by the Advanced CCD Imaging Spectrometer (ACIS–I) (Garmire et al., 2003) in September 1999, was used (Paper I). The merged observation had a net exposure time of 18 ks, giving a limiting X-ray flux of 10-14 ergs cm-2 s-1. Deeper observations of Tr 14 region were carried out by the ACIS–I in September 2004. We analyzed this recent dataset, ObsID 4495, that has an exposure time of 60 ks. An energy range of 0.5–8.0 keV was adopted for the detection of sources. The CIAO (Fruscione et al., 2006) program WAVDETECT was used to detect the sources, with the wavelet scales ranging from 1 to 16 pixels in steps of , and a source significance threshold of 3 . The X-ray counts were estimated using the DMEXTRACT tool of CIAO. For more details of data analysis procedure, the reader is referred to Paper I. We extracted in total some 500 X-ray sources, 150 of which are not covered by the IRSF field. Together with the previous sample of 450 X-ray sources, our combined sample of the region has 800 sources.
3 RESULTS AND DISCUSSIONS
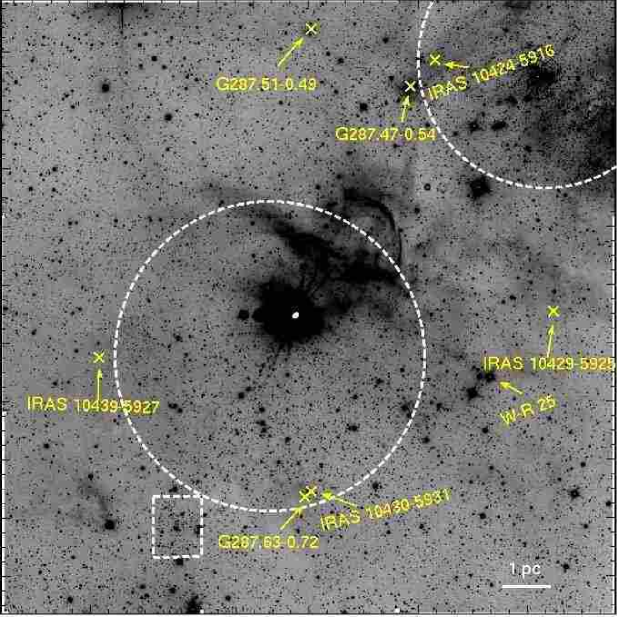
Figure 1 shows the mosaiced band image, centered on Carinae, with the north to the top and east to the left (see also Fig. 2 of Paper I for the color-composite image of the same field). Tr 16 is seen near the center in the image, whereas Tr 14 is seen in the north-west. The WR star, HD 93162 (WR 25), is marked in the figure. Also marked are three MSX point sources, G287.51-0.49, G287.47-0.54, and G287.63-0.72, which are candidate embedded clusters (Rathborne et al., 2004). The IRAS source, IRAS 10430-5923, is known to have IRAS colors characteristic of an embedded star (Megeath et al., 1996). In addition to this, we found three more IRAS sources in our field, IRAS 10424-5916, IRAS 10439-5927, and IRAS 10419-5925, which have IRAS colors characteristic of an embedded star. All of these IRAS sources are marked in the figure. Finally, the Tr 16-SE group is also marked in Fig. 1.
A large amount of diffuse NIR emission is seen in the field, extending northwest of Carinae, which probably arises due to both free-free and bound-free emission. The diffuse emission correlates very well with the 4.8-GHz continuum emission from Car II (see Fig. 3 in Brooks et al. (2001)). To the south-east of Tr 16, where a thick ‘V’ shaped dust lane bisects the Carina Nebula, some bright rimmed clouds or globules are seen, pointing toward Carinae or to Tr 16. The most prominent of these is the bright rimmed globule seen nearly 7 south of Carinae, which was found by Megeath et al. (1996) to be associated with IRAS 10430-5931 (see Fig. 1). CO emission has also been detected from this region (Brooks et al., 1998), which traces the northern edge of the southern molecular cloud.
We selected the sources detected in all the , , and bands using a search radius of 1. There are 27,256 sources common in the , , and bands in the complete field. Of these, 17,495 sources have photometric errors smaller than 0.1 mag in all the three bands. From the 2MASS data, we had an additional 226 bright sources with mag. To search for the X-ray counterparts of the NIR sources, our X-ray sample based on the multiple datasets (see §2.3) was utilized. With a progressively large search radius criteria of 1–3 depending upon the off-axis angle of the X-ray source, we found counterparts of some 600 NIR sources. To find the counterparts of known OB stars, the sample of known OB stars from Massey & Johnson (1993) was used. Within a search radius of 2, our search resulted in 50 O to early-B stars.
3.1 Color-Color Diagrams
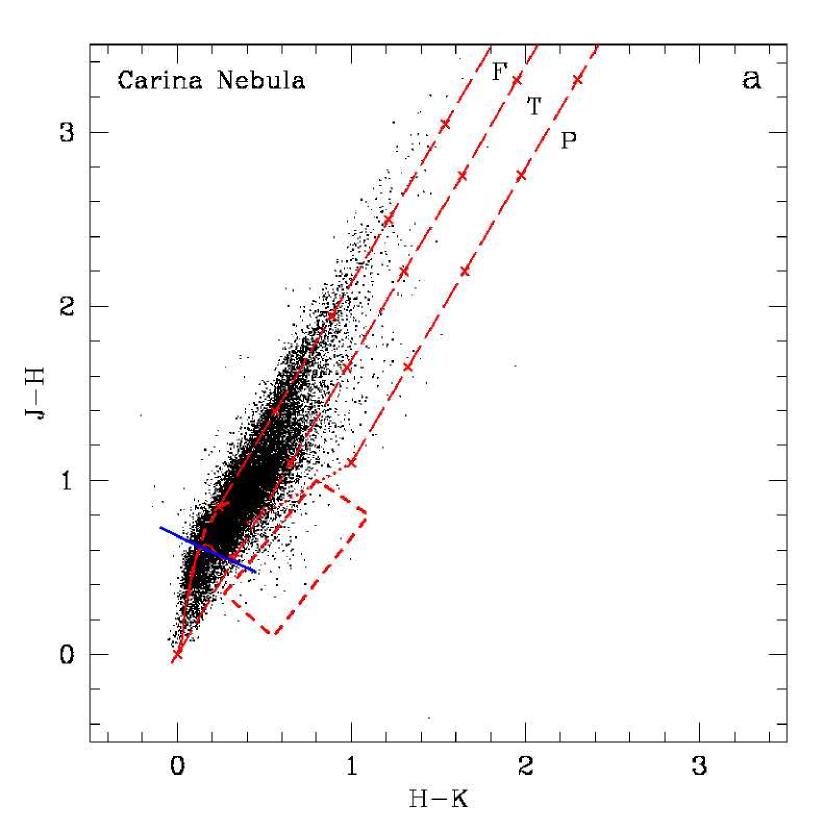
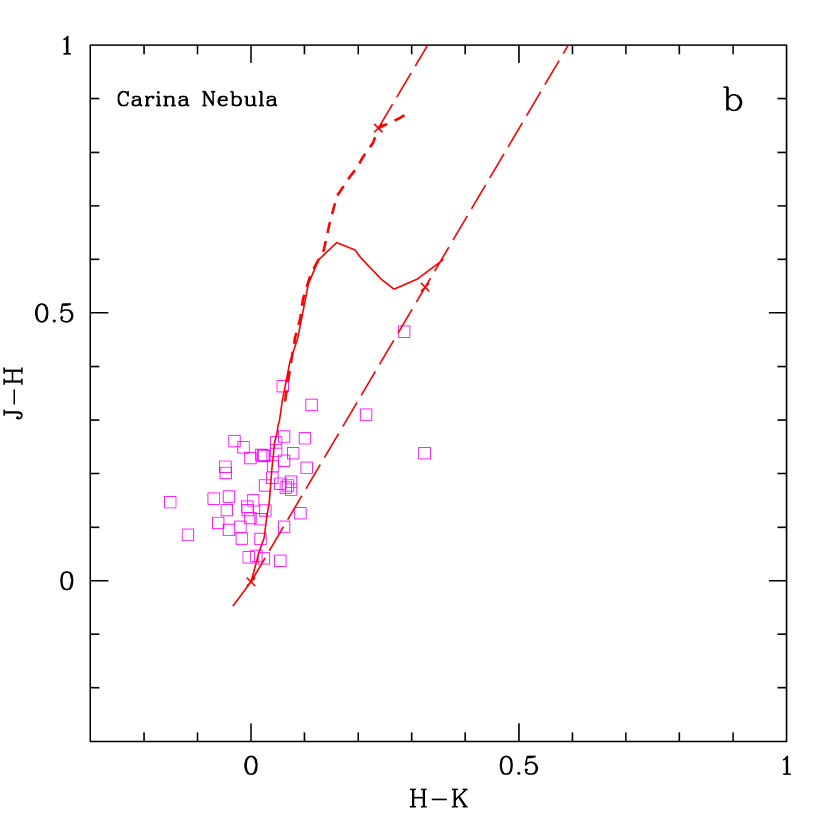
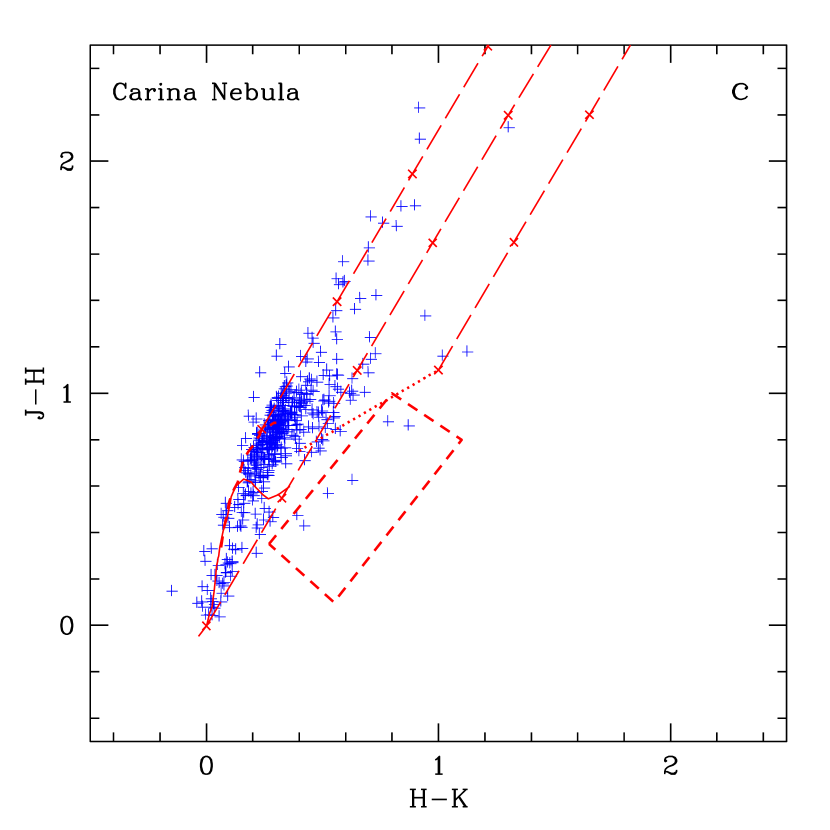
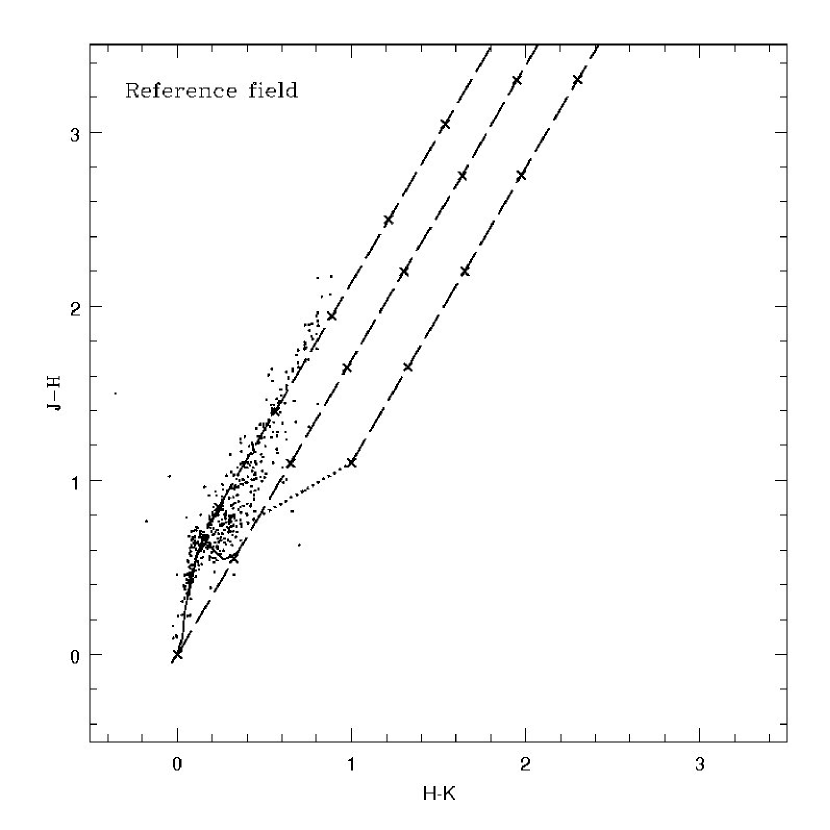
Figure 2a shows the color-color diagram of the 17,495 sources from the IRSF data (with photometric errors smaller than 0.1 mag) and of 226 bright NIR sources from 2MASS. The color-color plots for the NIR sources with counterparts of known OB stars, and with X-ray counterparts, are shown separately in Fig. 2b and Fig. 2c. The intrinsic colors of dwarfs and giants are plotted as solid and dashed line, respectively, which are taken from Bessell & Brett (1988) after being converted to the CIT system. The two long parallel dashed lines adopted as , , and (Cohen et al., 1981), drawn from the base and tip of the dwarf and giant loci, form the reddening band. The crosses marked on the reddening vectors are separated by = 5 mag. The dotted line represents the locus of unreddened classical T Tauri stars (Meyer et al., 1997). One more reddening vector is plotted starting at the tip of the CTTS locus. The region bounded by the short dashed lines below the CTTS locus is where the PMS stars of intermediate mass, i.e., Herbig Ae/Be stars are usually found (Hernández et al., 2005).
As shown in Fig. 2a, the NIR sources are classified in three regions [see, e.g., Tamura et al. (1998) and Ojha et al. (2004)]. “F” sources are mostly reddened field stars although PMS stars with little NIR excesses, viz., weak-lined T Tauri sources or CTTSs may also be included. The sources located redward of region “F” have NIR excesses. Among these, “T” sources show small amounts of NIR excesses. These are T Tauri or Class II objects (Lada & Adams, 1992). It should be noted that this selection would only give a lower limit on the number of T Tauri objects in the sample, as T Tauri objects with small amounts of NIR excesses may well be located in the reddening band and those not highly reddened would be located near the CTTS locus. Sources which fall redward of the region “T” show large amounts of NIR excesses. These “P” sources are protostar-like (also known as Class I) objects. It should be noted that Herbig Ae/Be stars overlap partially with Class I objects in NIR colors. Based on these criteria, we found 544 Class II candidates and 11 Class I candidates.
For comparison, the color-color plot of the reference field is shown in Figure 3. The dwarf and giant loci, the CTTS locus, as well as the reddening bands are plotted in the same way as in Fig. 2. The area of the reference field is 19.36 arcmin2. There are 402 sources detected in this field which are common to all the three bands and have photometric errors smaller than 0.1 mag. Comparison with Fig. 2 shows that, whereas a large number of sources (800) are found with NIR excesses in the Carina Nebula field, the reference field shows sources to be concentrated mainly in the reddening band (the “F” region), with hardly any of them showing NIR excess.
3.2 Color-Magnitude Diagram
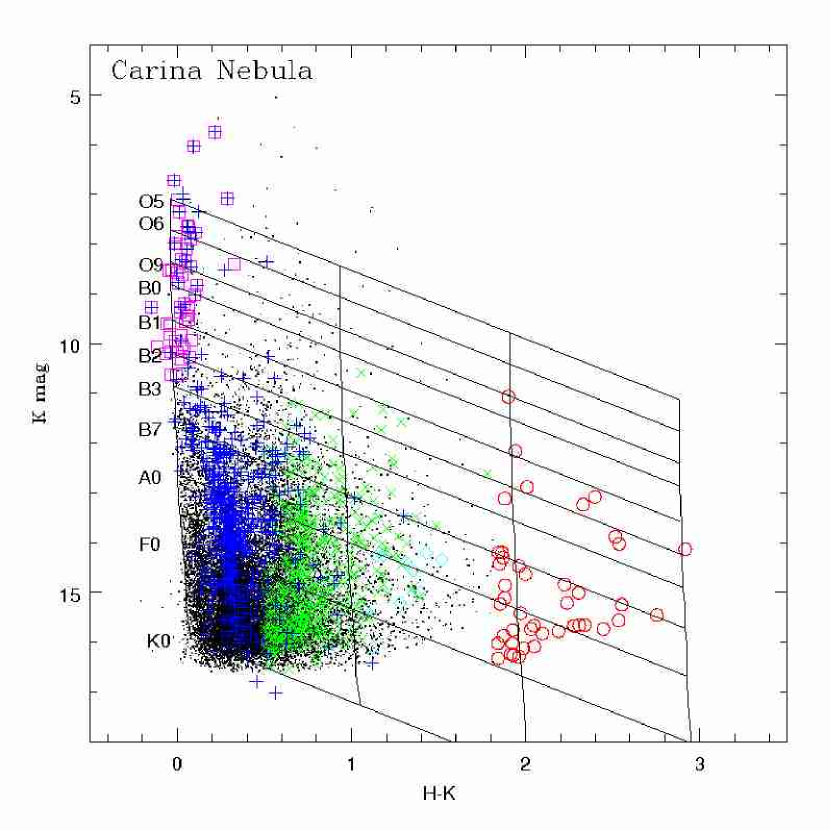
Figure 4 shows the color-magnitude diagram of the 17,495 sources detected in the bands with photometric errors smaller than 0.1 mag, sources selected from 2MASS, plus some 1178 sources which are not detected in the band but are still detected in the and bands. The vertical solid lines (from left to right) in the figure represent the main-sequence tracks (Koornneef, 1983) reddened by equal to 0, 15, 30, and 45 mag for a distance of 2.5 kpc. The slanting lines trace different spectral zones. The symbols in the plot mean the following: (a) known OB stars (Massey & Johnson, 1993) are shown as open squares, (b) the NIR counterparts of the X-ray sources are shown as pluses, (c) the Class II candidates selected from Fig. 2 are shown as crosses, (d) the Class I candidates selected from Fig. 2 are shown as diamonds, (e) the NIR sources with , referred to as red sources from now onward, are shown as open circles, and (f) all other NIR sources are shown as dots.
The color-magnitude diagram appears to show four different groups. Most of the sources below spectral type B3, lying close to the main sequence with nearly zero extinction, are field stars forming the first group. The NIR sources with X-ray counterparts form the second group. As has been shown by, e.g., Getman et al. (2006), the contamination due to field population is small in the X-ray samples of star-forming regions. Most of our NIR sources with X-ray counterparts should be largely predominated by the weak-lined T Tauri population. The Class II candidates selected based on the NIR colors, most of them with no X-ray counterpart, form the third group in the diagram, and these sources have extinction values of 7 mag. The fourth group is the red sources with , and 30 mag. Table 2 lists the PMS candidates identified based on their NIR colors, i.e., Class II and Class I candidates, and based on the X-ray and NIR properties, i.e., Class III and Class II candidates.
3.3 Interstellar Extinction
We used the color-color diagram (Fig. 2a) to estimate the mean extinction toward the Carina Nebula. For this, we traced the stars in the reddening band to the solid line shown in the figure, near the main-sequence locus (M0-M6). The mean extinction determined from the above method is 2.5 mag. The extinction toward the Carina Nebula has been known to be low in general despite the prominent nebulosity seen in the optical images. Massey & Johnson (1993) reported the mean of the known OB stars to be 0.55, which assuming an , gives 1.5 mag. Tapia et al. (2003) found the mean extinction toward Tr 14 and Tr 16 to be 2.5 mag. In our calculation, the mean extinctions estimated individually for Tr 14 and for Tr 16, show no significant difference. However, for the Tr 16-SE group, which appears to be partially embedded, we found a higher mean extinction 6 mag using the same method. As discussed in Paper I, the Tr 16-SE group appears to be correlated with the southern molecular cloud, and “sandwiched” between two CO peaks. The individual extinction of stars in our field ranged from value of 0 to 40 mag.
3.4 Spatial Distribution of Stellar Sources
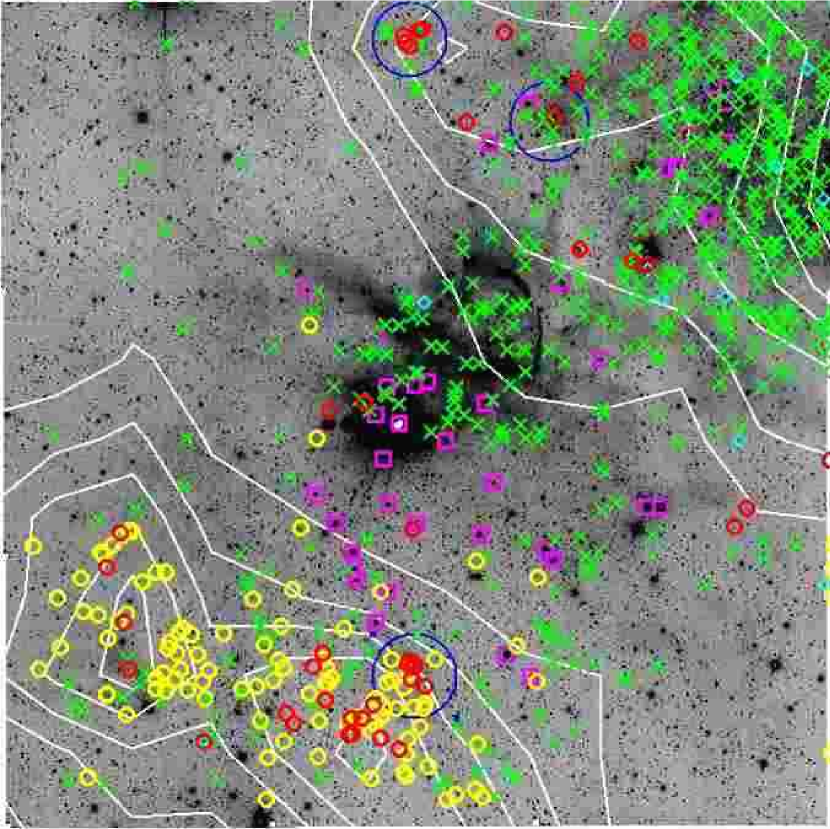
Figure 5 shows the mosaic image of the Carina Nebula in the band centered on Carinae (same as Fig. 1). The known OB stars together with the Class II and Class I candidates identified based on their NIR colors, are separately marked in the figure. Additionally marked are the red sources () as well as some 107 faint (17 mag) NIR sources. The white contours represent the 12CO(1-0) emission (Brooks et al., 1998). The contours seen in the north-west and in the south-east trace parts of the northern and southern molecular clouds respectively, with Tr 16 in between, where the molecular gas exists only in dense clumps of typical masses 10 (Cox & Bronfman, 1995; Brooks et al., 1998).
The known OB stars are seen to be distributed toward the clusters. Most of the Class II and Class I candidates are also seen to be distributed from the north-west to the south-east across the image, connecting Tr 14 and Tr 16, with many more Class II candidates seen in Tr 14 than in Tr 16. However, the red sources with are concentrated to the south-east of Tr 16, near the denser part of the southern molecular cloud, and near the three MSX point sources. The red sources to the south-east of Tr 16, apart from showing a good correlation with the molecular cloud distribution, are also located at where the ionization fronts are interacting with the cloud, as delineated by the PDRs seen in the MSX study (Smith et al., 2000; Rathborne et al., 2002). Moreover, in this region an embedded IRAS source, IRAS 10430-5931, was found to be associated with a bright rimmed globule (Megeath et al., 1996) along with several bright X-ray sources, most of which are massive star candidates (Paper I) with one known O4 star (Smith et al., 1987). Thus, whereas for some sources the large colors could be caused due to reddening by the cloud, many red sources seen here should be PMS objects still embedded in clouds, representing the current generation of star formation. The concentration of red sources near the MSX point sources G 287.630.72, and G 287.510.49 is particularly intriguing as these two MSX sources along with G 287.470.54 are probably embedded clusters based on their mid-IR fluxes (Rathborne et al., 2004).
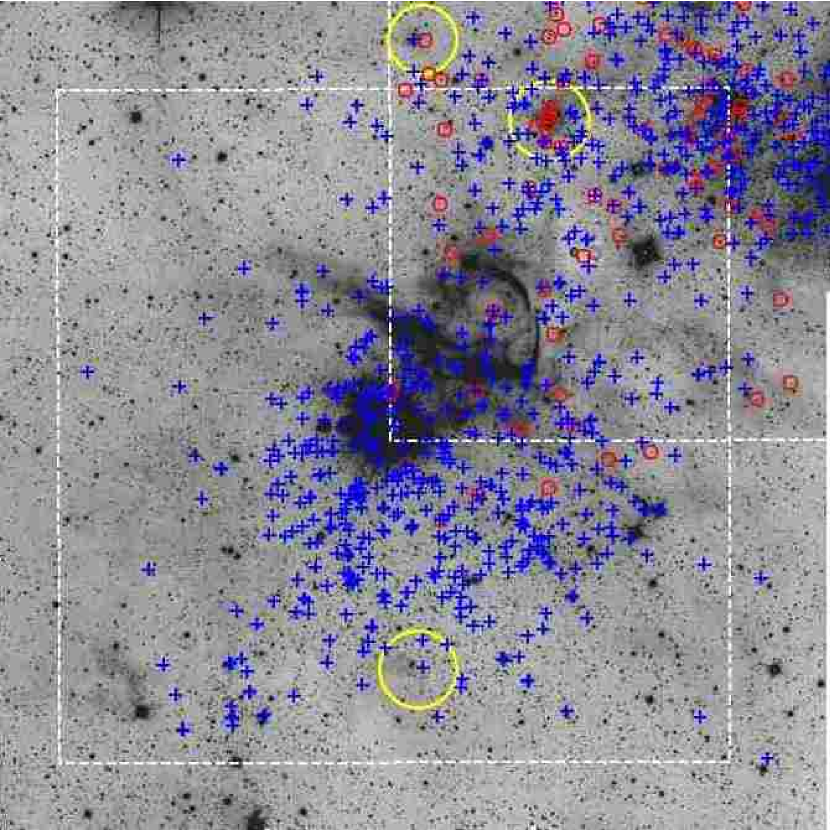
The spatial distribution of the X-ray sources also presents a similar picture. Fig. 6 shows all the X-ray sources with/without NIR counterparts overlaid on the band image. The X-ray sources with NIR counterparts, most of which are low-mass PMS objects, are seen in the direction of Tr 14 and Tr 16. For the X-ray sources without NIR counterparts, their nature remains uncertain in general. It is, however, interesting to note the presence of some 5 such sources, one of which is a hard X-ray source, near G 287.470.54 and G 287.510.49. There are two more X-ray sources near these MSX sources, which are relatively bright and have NIR counterparts. All these 7 X-ray sources detected around the MSX sources are listed in Table 3 with their counts and other properties.
For G 287.510.49, two of the X-ray sources in its vicinity are both hard X-ray sources with the hardness ratios, =0.17, and 0.28. The hardness ratio is defined as =, where stands for the counts in a given energy range shown in the subscript in keV. The high hardness ratios of these X-ray sources are indicative of very high absorbing environments or these sources have intrinsically hard spectra or both. The X-ray source No. 1 (see Table 3), which is relatively faint in X rays, with no NIR counterpart even in the band, is a candidate for Class I or Class 0 type object. The other hard X-ray source No. 2 is a bright X-ray source with an NIR counterpart and has a positional coincidence of 0.2 with the MSX source G 287.510.49 itself. For G 287.470.54, we see four X-ray sources (Nos. 3 to 6), all being moderately bright in X rays and do not have NIR counterparts. Two of these have relatively high hardness ratios. For G 287.630.72, there is only one bright X-ray source nearby, No. 7, with an NIR counterpart.
Thus, the distribution of red NIR sources and X-ray sources strongly indicates that these MSX sources are embedded clusters and are sites of ongoing cluster formation. Apparently, we are seeing star formation at different evolutionary stages. Tr 16 seems to be the most evolved as is evident from the large cavity it has created in the molecular cloud. Tr 14 should be younger than Tr 16 as is indicated by its association with its parental molecular cloud, and by the presence of a larger population of T Tauri candidates as compared to Tr 16. Finally, the region south-east of Tr 16 (including the Tr 16-SE group) and near the MSX point sources show few T Tauri candidates but a concentration of an even younger generation of stellar population including red and faint NIR sources, and hard X-ray sources.
3.5 Stellar Mass Estimates
3.5.1 Tr 14
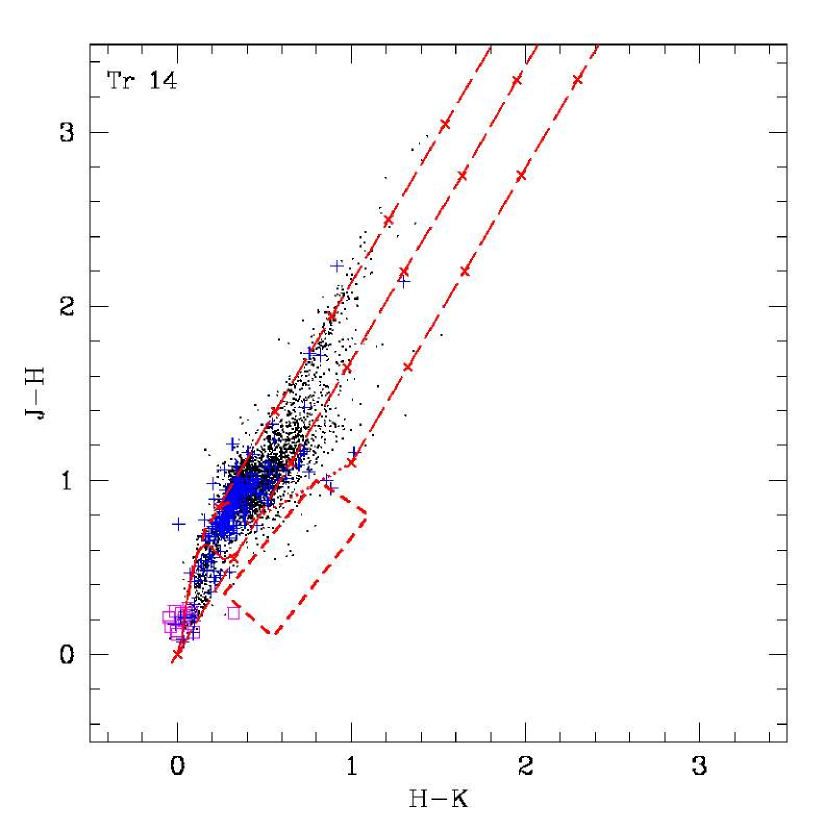
We study the stellar populations of the clusters, Tr 14 and Tr 16 individually. To select the NIR sources associated with the clusters, we have used the positions and the extents of the clusters from Tapia et al. (2003), where they used the star counts in the band to determine the centers and the extents of these clusters. For Tr 14, we used the sources located within a 264 radius of the cluster center, R. A.= and Decl.= (J2000). There are 3490 sources in this area centered on Tr 14 with photometric errors smaller than 0.1 mag in all the bands. Figure 7 shows the NIR 2-color diagram of these sources. The colors of dwarfs and giants as well as the CTTS locus are plotted in a similar way as in Figs. 2 and 3. There are 14 sources cross-identified with known O or B stars (Massey & Johnson, 1993), shown as open squares, and 200 NIR sources with X-ray counterparts, marked as pluses. The T Tauri candidates based on the NIR colors in Tr 14 region are selected in a similar way as discussed in §3.1. We identified 219 CTTS candidates.
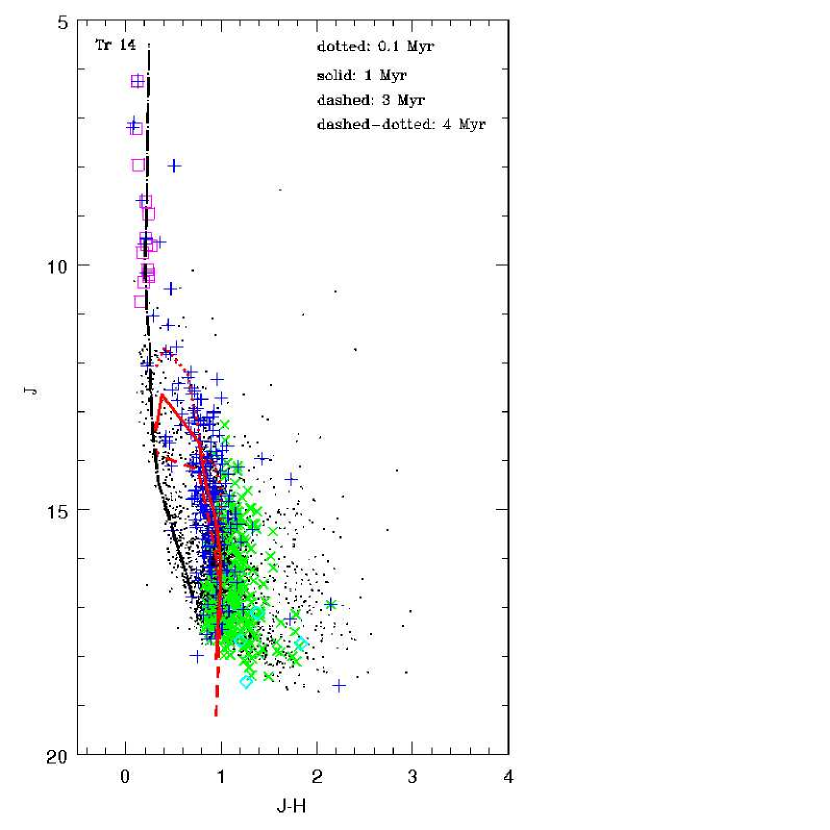
Figure 8 shows the color-magnitude diagram, versus , for Tr 14. The CTTS candidates selected from Fig. 7 are shown as crosses, the known OB stars are shown as open squares, and the NIR sources with an X-ray counterpart are shown as pluses. We compare the distribution of sources with a 4 Myr post–main-sequence isochrone (dashed-dotted line) which was derived from Bertelli et al. (1994) for a distance of 2.5 kpc, and 0.1 Myr (dotted line), 1 Myr (solid line) and 3 Myr (dashed line) PMS evolutionary tracks, which were derived using the model of Palla & Stahler (1999). The PMS as well as post–main-sequence isochrones were corrected for extinction and reddening, by using the mean extinction value of of 2.5 mag estimated for this region, as discussed in §3.3. The OB stars fit well the 4 Myr post–main-sequence isochrone. The low-mass PMS population, which is represented by the T Tauri candidates selected based on their NIR colors, and sources with X-ray counterparts, are seen to be distributed around 0.1–3 Myr PMS tracks. Masses range from 0.1 to 4 from bottom to top for all the PMS curves. For a representative age of 1 Myr, more than 80 % of the PMS candidates have masses smaller than 1 . The lowest mass limit of our data corresponding to our 10 limiting magnitude in , turns out to be 0.2 for a distance of 2.5 kpc of this cluster, assuming an age of 1 Myr.
3.5.2 Tr 16
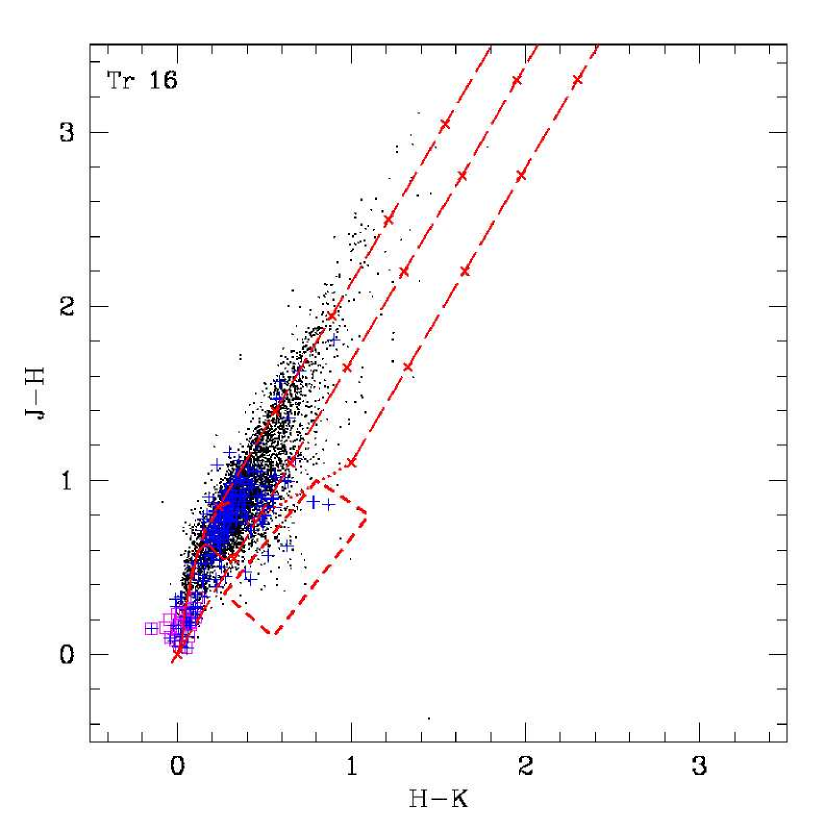
The NIR sources located within a 320 radius of the cluster center, i.e., R. A.= and Decl.= (J2000) (Tapia et al., 2003) were used to study Tr 16. There are 4904 sources detected in this area centered on Tr 16 in , with photometric errors smaller than 0.1 mag. Figure 9 shows the NIR 2-color diagram for Tr 16, with symbols the same as in Fig. 7. There are 27 O or early-B stars and some 218 NIR sources with X-ray emission in Tr 16. By using the similar criteria to identify the CTTS candidates as discussed in §3.1, we selected 114 CTTS candidates.
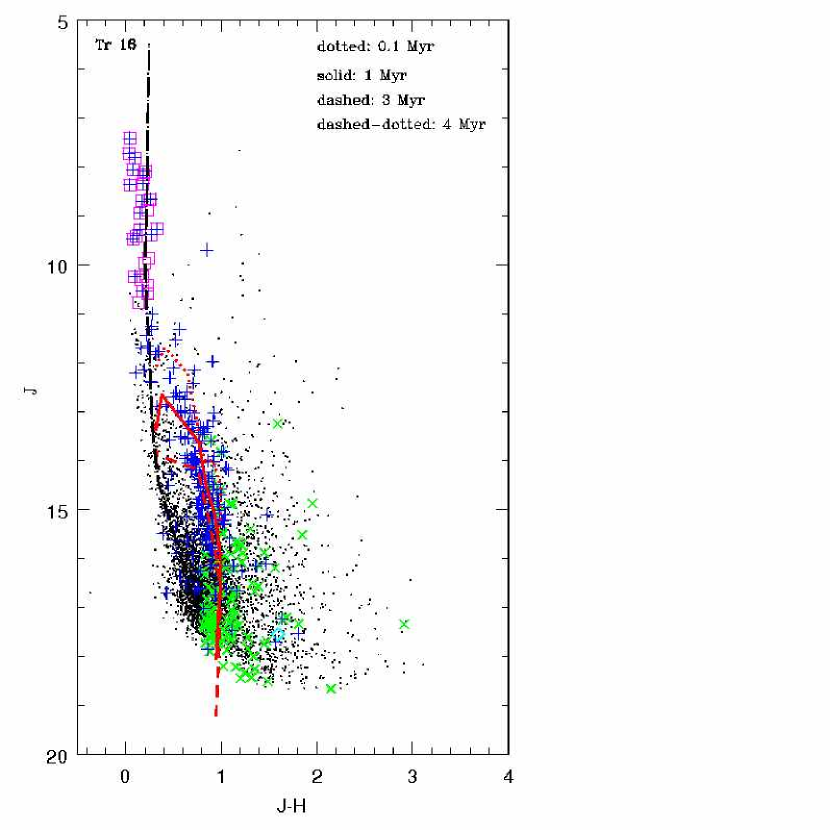
Figure 10 shows the color-magnitude diagram, versus , of Tr 16. The symbols used in this figure are the same as in Fig. 8. In case of Tr 16 also, the 4 Myr post–main-sequence track fits the massive stars, whereas the PMS population is distributed around 0.1–3 Myr PMS tracks. For Tr 16, again using a representative age of 1 Myr, more than 77 % of the PMS candidates have masses smaller than 1 . The comparison of Fig 10 with Fig. 8 shows a more noticeable background contamination in Tr 16 than in Tr 14, i.e., the scatter seen for . For Tr 14, the molecular clouds apparently block a larger fraction of background stars.
3.6 The -band Luminosity Function
The -band luminosity function (KLF) of an embedded cluster is useful in constraining the age and initial mass function (IMF) of the cluster. In order to convert the observed KLF of a cluster — which is the luminosity function of all the stars detected in the band in the direction of the cluster — to the cluster KLF, one needs to apply corrections for (a) the incompleteness of the star counts as a function of the magnitude, and (b) the field star contribution in the line of sight of the cluster.
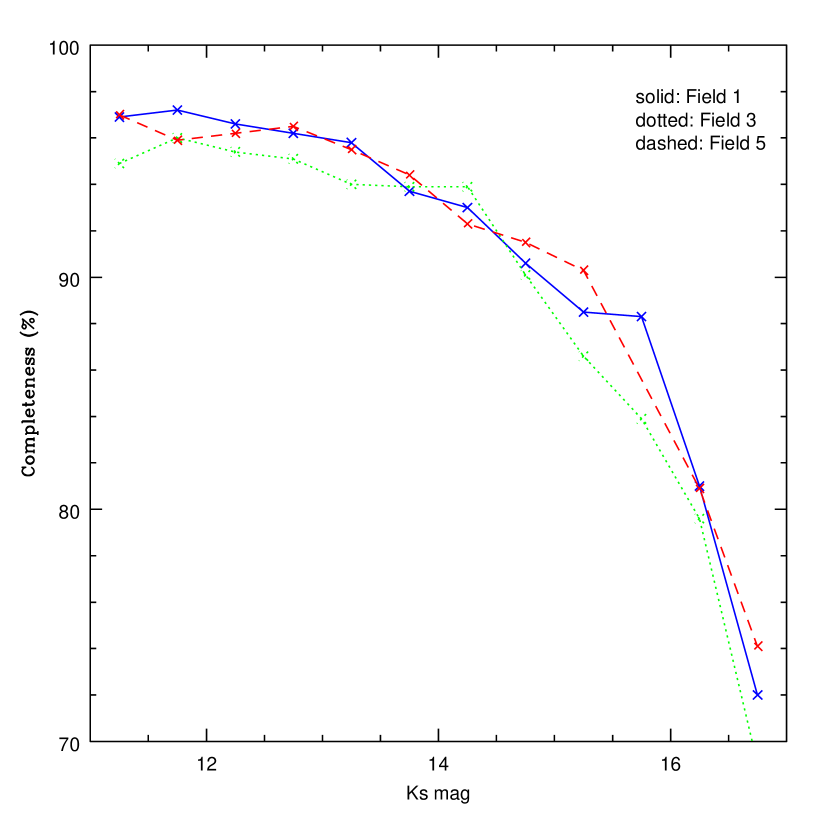
The completeness of our -band data was estimated for each individual field using the ADDSTAR package in IRAF, as described in §2.1.2. The completeness of fields, Nos. 1, 3, and 5 (see Table 1), are demonstrated in Fig. 11, from which one sees a systematic lower completeness for the relatively crowded field No. 3, which includes Tr 14, than that of either field No. 5 (including Tr 16) or field No. 1. This completeness correction estimated for the clusters was applied to the observed KLFs of each cluster.
In the studies of the luminosity function of a star cluster, the correction for the foreground and background population in the line of sight of the cluster is of crucial importance. The under/over estimate of the field stars in the line of sight of a particular cluster can significantly change the estimated cluster luminosity function from the observed one. One method to correct for the foreground and background contamination is to use a reference field, located reasonably away from the cluster, and yet close enough to have a similar Galactic field star distribution, e.g., with the same Galactic latitude. This reference field is then assumed to represent the field population to the cluster. However, a young and partly embedded cluster is still associated with the parental molecular cloud and thus renders an appreciable, and often variable, amount of extinction for the background field stars.
To correct for the foreground and background contamination, we made use of the Galactic model by Robin et al. (2003). This Galactic model makes use of the Besançon model of population synthesis to reproduce the stellar contents of the Galaxy. The advantage in using this model is that the background stars (d 2.5 kpc) can be separated from the foreground stars (d 2.5 kpc). While all the stars in the field suffer a general interstellar extinction, only the background stars suffer an additional extinction due to the cloud — the Carina molecular cloud complex in our case. The use of the model allows us to apply an additional cloud extinction to the background stars. To ensure that the model does a reasonably good job in predicting the field star population, we compared the model star counts with our observed reference field. Figure 12 shows the comparison of the completeness corrected KLF of the reference field with (a) the model star counts where no extinction has been applied to the model, and (b) where all the model stars are made fainter by an interstellar extinction of = 1 mag kpc-1. It can be seen that the latter matches reasonably well with the observed reference field. Hence, we used this model to predict the contamination to the Carina Nebula field, for which all the model stars are made fainter by a general interstellar extinction of = 1 mag kpc-1, whereas the background stars are made fainter by an additional cloud extinction.
To estimate the cloud extinction which affects the background population in the direction of the clusters, we used the NICE (Near-Infrared Color Excess) method (Lada & Adams, 1992), in which the excess in the mean color of the target fields relative to that of the reference field is used to estimate the extinction due to the cloud. Using this method, we found a moderate 1.5 mag for Tr 16, a higher value of 2.5 mag for Tr 14 and 5.5 mag for the Tr 16-SE group. It should be noted that the mean extinction estimated for the individual clusters and for the Tr 16-SE group in §3.3 represents the mean extinction suffered by the cluster members, whereas the NICE method gives an estimate of the cloud extinction which affects the background stars. While a moderate extinction of 1.5 mag (or 0.15 mag) for Tr 16 or 2.5 mag for Tr 14 may not have significant effects on the field star correction, the additional cloud extinction in case of the Tr 16-SE group significantly alters the shape of the cluster KLF.
In Figure 13a, the observed KLF of Tr 16 is shown with only completeness corrected KLF, and our estimate of the field star contribution. Fig. 13b shows the cluster KLF, where the field star contribution has been subtracted from the completeness corrected KLF of Tr 16. The cluster KLF is seen to rise smoothly until 16.5 mag and turns over at = 16.5–17 mag. This turnover is likely due to the sensitivity limit of our data and not the intrinsic turnover for the cluster. Our completeness for the Carina Nebula field reaches 70% at 16.75 mag. For comparison, the completeness of 70% for the reference field is reached at 17.75 mag, and the reference field KLF is seen not to turn over until = 18 mag (see Fig. 12). Thus, it appears that the turnover of Tr 16 KLF is due to the sensitivity of our data.
The observed KLF of Tr 14 is shown in Fig. 14a, together with only completeness corrected KLF and the field star contribution. The cluster KLF is shown in Fig. 14b. One can readily see that the Tr 14 KLF has a very different shape from the Tr 16 KLF (Fig. 13b). For Tr 14, the KLF rises up to 14.5 mag and then levels off until a sharp peak at = 16–16.5 mag, after which it turns over. The peak stands out even in the observed KLF (Fig. 14a), where some 1365 stars are detected in this magnitude bin (16–16.5), whereas after the completeness correction the number becomes 1706. No matter whether we subtract either the number of stars in the observed reference field or the field star contribution from the model, there is an excess of some 1000 stars in this bin. Zinnecker et al. (1993) found sharp peaks in the synthetic KLFs of extremely young (less than 1–2 Myr) clusters, which the authors attributed to the onset of deuterium burning. They found the deuterium peak to shift to fainter absolute magnitudes as the cluster ages, and disappear long before the cluster reaches an age of 10 Myr. We suggest the peak seen in the Tr 14 KLF to be the deuterium peak as has been evidenced in other star clusters of ages 1–2 Myr e.g., in Muench et al. (2003). The turnover of the Tr 14 KLF occurs at a slightly brighter magnitude than the Tr 16 KLF, which, given the similar completeness limits of our data for the two clusters, implies a younger age for Tr 14 than for Tr 16.
Finally, the observed KLF of the Tr 16-SE group is shown together with only completeness corrected KLF and the field star contribution in Fig. 15a. The KLF of the Tr 16-SE group is shown in Fig. 15b. We see a clear excess of stars in the Tr 16-SE group from the bright end to the faint end as compared to the field stars, which suggests that the group should indeed be an embedded association. The KLF is seen to rise until = 16 mag, at which it seems to turn over, but to rise again at = 16.5–17 mag. The turning over at = 16 mag can also be seen in the raw KLF, where a small dip is seen at =16–16.5 mag. The rise seen at = 16.5–17 mag after the apparent turnover at = 16 mag might imply a non-coeval formation for this embedded group.
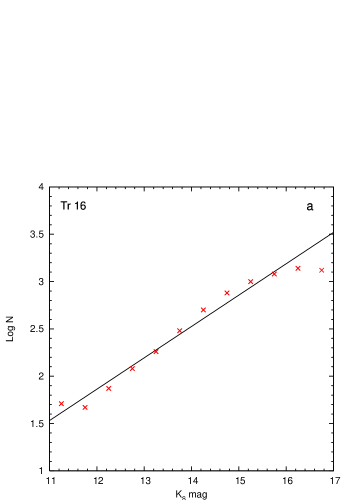
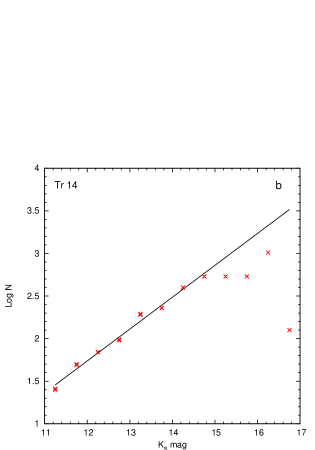
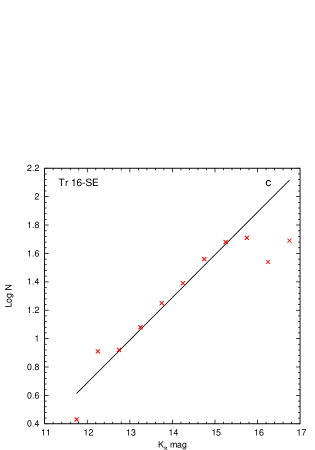
The KLFs of young embedded clusters are known to follow power-law shapes (Lada et al., 1991, 1993). Fig. 16 shows the cluster KLFs of Tr 16 and Tr 14, and of the Tr 16-SE group. A power-law with an index has been fitted to each KLF, where is defined as, , with being the number of stars brighter than . The KLF index is found to be 0.33 0.01 for Tr 16, and slightly steeper for Tr 14, = 0.37 0.01. For the Tr 16-SE group, KLF slope is found to be = 0.30 0.03. These values of KLF slopes are in agreement with =0.32–0.40, the values reported for other young embedded stellar clusters, such as NGC 2024, NGC 2068, and NGC 2071 (Lada et al., 1991), and NGC 2264 (Lada et al., 1993).
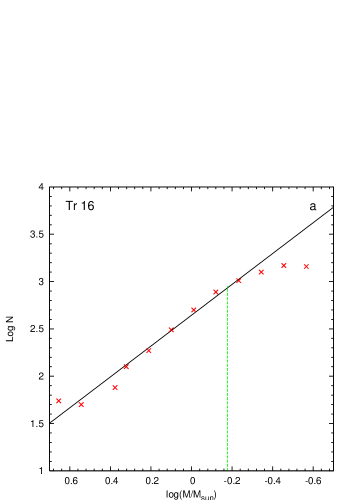
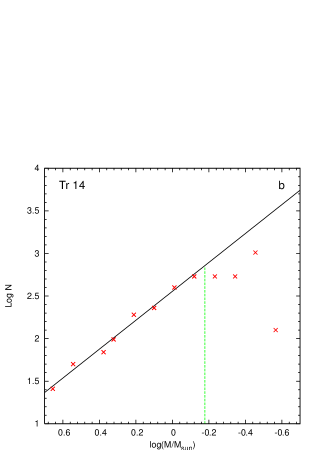
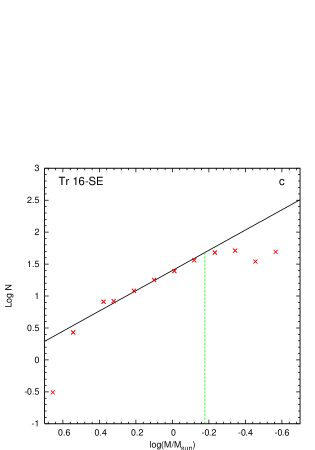
Using the KLFs of the clusters Tr 16 and Tr 14, and of the Tr 16-SE group, we constructed their approximate mass functions assuming certain mass-luminosity relations. Given the young ages of these clusters, these mass functions correspond to the IMFs of these clusters. We estimated the stellar masses from the magnitudes by using the PMS isochrone from Palla & Stahler (1999) for masses between 0.1 to 4 , and the post–main-sequence isochrone from Lejeune & Schaerer (2001) for the higher mass stars. Assuming a representative age of 3 Myr for the clusters, and a distance of 2.5 kpc, the resulting mass functions of Tr 16, Tr 14, and the Tr 16-SE group, are shown in Fig. 17. The dashed line in the figure corresponds to the 90% completeness limit of the data, 0.7 . The best linear fit gives a slope of 1.62 0.13 for Tr 16, 1.69 0.08 for Tr 14, and 1.58 0.12 for the Tr 16-SE group. If we consider an age of 1 Myr instead, the derived slopes of the mass functions become 1.34 0.13 for Tr 16, 1.39 0.08 for Tr 14, and 1.30 0.12 for the Tr 16-SE group. Given a KLF, the derived mass function of a cluster has a shallower slope for a younger age, which can be understood as PMS stars in general get fainter as they evolve toward the main sequence, and more so for lower-mass stars. Considering all the assumptions and uncertainties involved in deriving these mass functions, we conclude that these slopes are in agreement with the slope for field star IMF, , derived by Salpeter (1955).
3.7 Individual Sources and Regions
We discuss below a few infrared sources in our field, i.e., IRAS 10430-5931, and the MSX sources, G 287.51-0.49 and G 287.47-0.54, where we find indications of ongoing cluster formation. The MSX sources are found to be candidate embedded clusters based on their mid-infrared fluxes (Rathborne et al., 2004). In our analysis we find concentration of red NIR sources and X-ray sources around these MSX sources. We present the band images around these sources to show the distribution of the young star candidates we identified. Other than the MSX and IRAS sources, we also discuss the Tr 16-SE group in detail, which was first noticed in our earlier work (Paper I) as an embedded young stellar group or cluster.
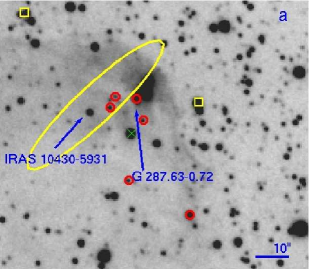
3.7.1 IRAS 10430-5931
IRAS 10430-5931 (R. A=, Decl.= (J2000)) is a deeply embedded infrared source, which is associated with a bright rimmed globule (Megeath et al., 1996). The flux of this IRAS source increases from 12 m to 100 m, which also suggests the source to be an embedded young star. From the molecular line observations 12CO(1–0), 13CO(1–0), and 18CO(1–0), Megeath et al. (1996) estimated an average extinction of =15 mag for this globule and =25 mag near the center of this globule. They found the size of the globule to be 0.5 pc and derived its mass to be 67 using the 13CO data. This IRAS source (Fig. 18a) is associated with the MSX point source G 287.63-0.72, located about 10 away (Rathborne et al., 2004). The bright rim is clearly visible and a number of unresolved sources are seen distributed near the head of the rim. Two T Tauri candidates are distributed outside the rim, which might represent the recent star formation, whereas a handful of red NIR sources (), the MSX source, as well as the IRAS source are located inside the bright rim, which may represent the present epoch of star formation.
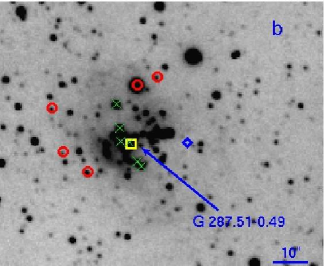
3.7.2 G 287.51-0.49
G 287.51-0.49 is an MSX point source which is a candidate embedded cluster based on its mid-IR fluxes (Rathborne et al., 2004). Fig. 18b shows the -band image centered on this MSX point source. The two hard X-ray sources, as well as the T Tauri candidates and the red NIR sources identified around this MSX source are marked in the figure. It appears that this group of young stars that we have identified, is part of an early episode of cluster formation.
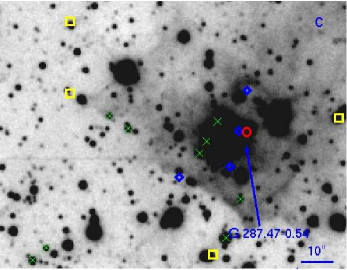
3.7.3 G 287.47-0.54
In Fig. 18c the band image around the MSX point source, G 287.47-0.54, is shown. This mid-IR source also has mid-IR fluxes consistent with being an embedded cluster (Rathborne et al., 2004). From a SIMBAD search, we found an IRAS source, IRAS 10424-5916, located about 40 away, in the north-west of the MSX source. This infrared source has IRAS colors consistent with that of an embedded star. There are four X-ray sources, none with an NIR counterpart, some T Tauri candidates and red NIR sources in the vicinity of this MSX source. Prominent diffuse NIR emission can be seen surrounding this MSX source, enveloping many unresolved sources.
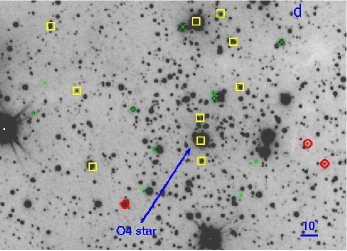
3.7.4 Tr 16-SE group
The band image around a compact group of ten X-ray sources (Paper I) is shown in Fig. 18d. One of these X-ray sources is a known O4 star (Paper I) with the rest mostly being candidate massive stars. The NIR sources with X-ray emission are marked in the figure along with the T Tauri candidates and the red sources. The KLF of this group shows a clear excess of sources as compared to the field stars, suggesting that it should be a bona fide young star group or cluster. The KLF slope of this group, = 0.30, is indicative of its young age.
4 Summary
An NIR imaging survey of a large 400 arcmin2 area centered on Carinae, including clusters Tr 14 and Tr 16 is presented. The 10 limiting magnitudes of the data are 18.5, 17.5, and 16.5 mag, in the , , and bands, respectively. The NIR observations presented in this work are deeper than any NIR imaging survey to date, for this large field in the Carina Nebula. The main conclusions derived from this work are the following.
-
1.
Using the NIR color diagnostics, we found 544 Class II candidates and 11 class I candidates in the entire observed field. A large number (40) of very red NIR sources with , are found, apart from some 100 faint NIR sources () which are detected only in the band.
-
2.
The spatial distribution of the PMS candidates, red and faint NIR sources, suggests that we are seeing star formation in different evolutionary stages in this region. The T Tauri candidates are seen to be distributed in the direction of the clusters, with Tr 14 containing a much larger population of Class II candidates than Tr 16 does. Most of the red and faint NIR sources are seen to the south-east of Tr 16. The red sources together with some hard X-ray sources are also found near the three MSX point sources, hinting that these mid-infrared sources are sites of ongoing cluster formation.
- 3.
-
4.
The shapes of the KLFs of Tr 16 and of Tr 14 differ significantly. The Tr 14 KLF shows a sharp peak in the =16–16.5 mag likely due to the deuterium burning PMS stars, just before it turns over. For Tr 16, the KLF rises smoothly before it turns over at 17 mag, likely due to the sensitivity of our data.
-
5.
The KLF of the Tr 16-SE group shows that the group has a much higher number density of sources relative to the field therefore should be a bona fide young star group or cluster. The KLF slope for the Tr 16-SE group is found to be 0.30, which is indicative of its very young age.
-
6.
The slopes of the IMFs are found to be 1.62 for Tr 16, 1.69 for Tr 14, and 1.58 for the Tr 16-SE group, down to our completeness limit of 0.7 .
References
- Bertelli et al. (1994) Bertelli, G., Bressan, A., Chiosi, C., Fagotto, F., & Nasi, E. 1994, A&AS, 106, 275
- Bessell & Brett (1988) Bessell, M. S. & Brett, J. M. 1988, PASP, 100, 1134
- Brooks et al. (1998) Brooks, K., Whiteoak, J. B., & Storey, J. W. V. 1998, PASA, 15, 202
- Brooks et al. (2001) Brooks, K. J., Storey, J. W. V., & Whiteoak, J. B. 2001, MNRAS, 327, 46
- Chen et al. (2007) Chen, W. P., Lee, H.-T., & Sanchawala, K. 2007, in Proceedings of IAU symposium, 237, 278
- Cohen et al. (1981) Cohen, J. G., Persson, S. E., Elias, J. H., & Frogel, J. A. 1981, ApJ, 249, 481
- Cox & Bronfman (1995) Cox, P., & Bronfman, L. 1995, A&A, 299, 583
- Crowther et al. (1995) Crowther, P. A., Smith, L. J., Hillier, D. J., & Schmutz, W. 1995, A&A, 293, 427
- Cudworth et al. (1993) Cudworth, K. M., Martin, S. C., & Degioia-Eastwood, K. 1993, AJ, 105, 1822
- de Graauw et al. (1981) de Graauw, T. et al. 1981, A&A, 102, 257
- Feinstein (1983) Feinstein, A. 1983, A&S, 96, 293
- Feinstein (1995) Feinstein, A. 1995, RevMexAA, 2, 57
- Fruscione et al. (2006) Fruscione, A. et al. 2006, in Proceedings of SPIE. 6270, 62701
- Gardner & Morimoto (1968) Gardner, F. F., & Morimoto, M. 1968, ApJ, 21, 881
- Garmire et al. (2003) Garmire, G. P., Bautz, M. W., Ford, P.G., Nousek, J. A., & Ricker, G. R. 2003, in Proceeding of SPIE, 4851, 28
- Getman et al. (2006) Getman, K. V., Feigelson, E. D., Townsley, L., Broos, P., Garmire, G., Tsujimoto, M. 2006, ApJ, 163, 306
- Grabelsky et al. (1988) Grabelsky, D. A., Cohen, R. S., Bronfman, L., & Thaddeus, P. 1988, ApJ, 331, 181
- Hernández et al. (2005) Hernández, J., Calvet, N., Hartmann, L., Briceño, C., Sicilia-Augilar, A., & Berlind, P. 2005, AJ, 129, 856
- Koornneef (1983) Koornneef, J. 1983, A&A, 128, 84
- Lada & Adams (1992) Lada, C. J., & Adams, F. C. 1992, ApJ, 393, 278
- Lada et al. (1993) Lada, C., Young, T., & Greene, T. 1993, ApJ, 408, 471
- Lada et al. (1994) Lada, C. J., Lada, E. A., Clemens, D.,& Bally, J. 1994, ApJ, 429, 694
- Lada et al. (1991) Lada, E. A., DePoy, D. L., Evans, N. J., & Gatley, I. 1991, ApJ, 371, 171
- Lejeune & Schaerer (2001) Lejeune, T., & Schaerer, D. 2001, A&A, 366, 538
- Levato et al. (1981) Levato, H. & Malaroda, S. 1981, PASP, 93, 714
- Massey & Johnson (1993) Massey, P., & Johnson, J. 1993, AJ, 105, 980
- Megeath et al. (1996) Megeath, S. T., Cox, P., Bronfman, L., Roelfsema, P. R. 1996, A&A, 305, 296
- Meyer et al. (1997) Meyer, M., Calvet, N., & Hillenbrand, L. A. 1997, AJ, 114, 288
- Morrell et al. (1988) Morrell, N., Garcia, B. & Levato, H. 1988, PASP, 100, 1431
- Muench et al. (2003) Muench, A. A., Lada, E. A., Lada, C. J., Elston, R. J., Alves, J. F., Horrobin, M., Huard, T. H., Levine, J. L., Raines, S. N., Román-Zúñiga, C. 2003, AJ, 125, 2029
- Nagayama et al. (2003) Nagayama, T., Nagashima, C., Nakajima, Y., Nagata, T., Sato, S., Nakaya, H., Yamamuro, T., Sugitani, K. & Tamura, M. 2003, Proc. SPIE, 4841, 459
- Nakajima et al. (2005) Nakajima, Y. et al. 2005, AJ, 129, 776
- Ogura et al. (2002) Ogura, K., Sugitani, K., & Pickles, A. 2002, AJ, 123, 2597
- Ojha et al. (2004) Ojha, D. K. et al. 2004, ApJ, 608, 797
- Palla & Stahler (1999) Palla, F., & Stahler, S. 1999, ApJ, 525, 772
- Persson et al. (1998) Persson, S. E., Murphy, D. C., Krzeminski, W., Roth, M. & Rieke, M. J. 1998, AJ, 116, 2475
- Rathborne et al. (2002) Rathborne, J. M., Burton, M. G., Brooks, K. J., Cohen, M., Ashley, M. C. B., & Storey, J. W. B. 2002, MNRAS, 331, 85
- Rathborne et al. (2004) Rathborne, J. M., Brooks, K. J., Burton, M. G., Cohen, M., & Bontemps, S. 2004, A&A, 418, 563
- Robin et al. (2003) Robin, A. C., Reylé, C., Derrière, S., & Picaud, S. 2003, A&A, 409, 523
- Salpeter (1955) Salpeter, E. E. 1955, ApJ. 121, 161
- Smith et al. (2000) Smith, N., Egan, M. P., Carey, S., Price, S. D., Morse, J. A. ,& Price, P. A. 2000, ApJ, 532, L145
- Smith et al. (2003) Smith, N., Bally, J. & Morse, J. A. 2003, ApJ, 587, L105
- Sanchawala et al. (2007) Sanchawala, K., Chen, W. P., Lee, H-. T-., Chu, Y. H., Nakajima, Y., Tamura, M., Baba, D., & Sato, S. 2007, ApJ, 656, 462 (Paper I)
- Smith et al. (2000) Smith, N., Egan, M., Carey, S., Price, S. D., Morse, J. A., & Price, P. A. 2000, ApJ, 532, L145
- Smith et al. (1987) Smith, R. G. 1987, MNRAS, 227, 943
- Stetson (1987) Stetson, P. B. 1987, PASP, 99, 191
- Tapia et al. (2003) Tapia, M., Roth, M., Vázquez, R. A., & Feinstein, A. 2003, MNRAS, 339, 44
- Tamura et al. (1998) Tamura, M., Itoh, Y., Oasa, Y., & Nakajima, T. 1998, Science, 282, 1095
- Turner & Moffat (1980) Turner, D. G., & Moffat, A. F. J. 1980, MNRAS, 192, 283
- Weisskopf et al. (2002) Weisskopf, M. C., Brinkman, B., Canizares, C., Garmire, G., Murray, S., & Van Speybroeck, L. P. 2002, PASP, 114, 1
- Whiteoak & Otrupcek (1984) Whiteoak, J. B., & Otrupcek, R. E. 1984, PASA, 5, 552
- Walborn (1973) Walborn, N. R. 1973, AJ, 78, 1067
- Walborn (1995) Walborn, N. R. 1995, RevMexAA 2, 51
- Zinnecker et al. (1993) Zinnecker, H., McCaughrean, M. J., & Wilking, B. A. 1993, in Protostars and Planets III, ed. E. H. Levy & J. I. Lunine (Tucson: Univ. Arizona Press), 429
| Date | Field | Seeing (FWHM) | Airmass | ||
|---|---|---|---|---|---|
| (J2000) | (J2000) | ″ | |||
| 2003 April 1 | 1…… | 10 45 52.80 | -59 33 56.4 | 1.5 | 1.2 |
| 2003 April 1 | 2…… | 10 45 00.76 | -59 32 06.6 | 1.5 | 1.2 |
| 2003 April 2 | 3…… | 10 44 08.20 | -59 32 55.8 | 1.1 | 1.3 |
| 2003 April 2 | 4…… | 10 45 46.13 | -59 39 23.0 | 1.1 | 1.3 |
| 2005 January 14 | 5…… | 10 45 04.05 | -59 38 58.4 | 1.1 | 1.1 |
| 2005 January 14 | 6…… | 10 44 10.50 | -59 39 24.9 | 1.1 | 1.1 |
| 2003 April 10 | 7…… | 10 45 59.67 | -59 47 46.3 | 1.3 | 1.1 |
| 2003 April 10 | 8…… | 10 45 03.66 | -59 48 06.5 | 1.3 | 1.2 |
| 2003 April 1 | 9…… | 10 44 05.89 | -59 46 36.0 | 1.4 | 1.3 |
| 2005 January 14 | Reference field | 10 47 17.41 | -59 39 26.0 | 1.1 | 1.1 |
Note. — Units of right ascension are hours, minutes, and seconds, and units of declination are degrees, arcminutes, and arcseconds.
| Number | |||||||
|---|---|---|---|---|---|---|---|
| (J2000) | (J2000) | (mag) | (mag) | (mag) | (counts) | (counts s-1) | |
| 1 | 10 43 35.52 | -59 38 12.4 | 15.79 | 14.43 | 13.55 | - | - |
| 2 | 10 43 35.71 | -59 30 13.0 | 16.56 | 15.73 | 15.23 | - | - |
| 3 | 10 43 35.76 | -59 34 14.1 | 15.01 | 14.03 | 13.70 | 61.6 | 0.00103 |
| 4 | 10 43 35.85 | -59 34 44.8 | 16.52 | 15.30 | 14.37 | - | - |
| 5 | 10 43 35.92 | -59 38 15.9 | 17.23 | 16.16 | 15.39 | - | - |
| 6 | 10 43 35.99 | -59 39 04.6 | 17.65 | 15.83 | 14.64 | - | - |
| 7 | 10 43 36.28 | -59 35 42.1 | 15.45 | 13.91 | 12.96 | - | - |
| 8 | 10 43 36.37 | -59 31 40.5 | 16.43 | 15.32 | 14.60 | - | - |
| 9 | 10 43 36.46 | -59 38 42.0 | 17.21 | 16.24 | 15.49 | - | - |
| 10 | 10 43 36.48 | -59 31 59.0 | 15.93 | 14.94 | 14.62 | 42.3 | 0.00071 |
| 11 | 10 43 36.48 | -59 33 42.3 | 13.60 | 13.18 | 13.10 | 28.4 | 0.00047 |
| 12 | 10 43 36.49 | -59 34 35.4 | 16.69 | 15.78 | 15.18 | - | - |
| 13 | 10 43 36.60 | -59 36 01.7 | 17.18 | 15.96 | 15.20 | - | - |
| 14 | 10 43 36.75 | -59 38 26.3 | 16.62 | 15.54 | 14.89 | - | - |
| 15 | 10 43 36.84 | -59 32 47.7 | 12.73 | 11.76 | 10.90 | 64.4 | 0.00107 |
| 16 | 10 43 36.84 | -59 33 14.7 | 12.56 | 12.07 | 11.90 | 68.9 | 0.00115 |
| 17 | 10 43 36.84 | -59 33 58.2 | 16.49 | 15.33 | 14.94 | - | - |
| 18 | 10 43 36.84 | -59 34 37.4 | 14.47 | 13.45 | 12.69 | 50.3 | 0.00084 |
| 19 | 10 43 36.84 | -59 36 08.2 | 15.40 | 14.08 | 13.54 | 86.1 | 0.00144 |
| 20 | 10 43 37.09 | -59 45 06.9 | 18.13 | 16.43 | 15.00 | - | - |
| 21 | 10 43 37.17 | -59 33 35.8 | 14.96 | 13.80 | 13.00 | - | - |
| 22 | 10 43 37.20 | -59 32 30.4 | 16.46 | 15.47 | 14.85 | - | - |
| 23 | 10 43 37.20 | -59 36 00.1 | 17.77 | 16.51 | 15.73 | - | - |
| 24 | 10 43 37.20 | -59 32 11.7 | 15.96 | 15.14 | 14.86 | 30.5 | 0.00051 |
| 25 | 10 43 03.72 | -59 34 24.4 | 12.72 | 12.32 | 12.24 | 43.0 | 0.00072 |
Note. — Units of right ascension are hours, minutes, and seconds, and units of declination are degrees, arcminutes, and arcseconds.
| ID | ||||||||
|---|---|---|---|---|---|---|---|---|
| (J2000) | (J2000) | (counts) | (counts s-1) | (mag) | (mag) | (mag) | ||
| 1 | 10 44 57.39 | -59 31 19.7 | 97.0 | 0.0016 | 0.28 | - | - | - |
| 2 | 10 44 59.64 | -59 31 19.8 | 288.0 | 0.0048 | 0.17 | 12.5 | 11.5 | 10.8 |
| 3 | 10 44 32.39 | -59 33 01.5 | 117.0 | 0.0019 | -0.56 | - | - | - |
| 4 | 10 44 32.39 | -59 33 13.2 | 70.0 | 0.0011 | -0.08 | - | - | - |
| 5 | 10 44 33.15 | -59 33 27.7 | 71.3 | 0.0011 | -0.33 | - | - | - |
| 6 | 10 44 35.08 | -59 33 30.7 | 79.1 | 0.0013 | -0.91 | - | - | - |
| 7 | 10 44 57.94 | -59 47 09.4 | 164.5 | 0.0091 | -0.25 | 13.4 | 12.7 | 12.3 |
Note. — The counts listed here are without background subtraction. is the hardness ratio of the X-ray sources, defined as =, where stands for the counts in a given energy range shown as the subscript in keV.