“Hidden” Seyfert 2 Galaxies in the Chandra Deep Field North
Abstract
We have compared the X-ray–to–optical flux ratios () of absorbed active galactic nuclei (AGNs) in the Chandra Deep Field North (CDF-N) with those of nearby, optically classified Seyfert 2 galaxies. The comparison provides an opportunity to explore the extent to which the local population of absorbed AGNs can account for the properties of the distant, spectroscopically ambiguous sources that produce the hard X-ray background. Our nearby sample consists of 38 objects that well represent the local Seyfert 2 luminosity function. Integrated UBVRI photometry and broadband X-ray observations are presented. Using these data, we have simulated the ratios that local Seyfert 2s would exhibit if they were observed in the redshift range as part of the CDF-N. In the simulations we account for the effects of redshift on flux measurements in fixed observed-frame bands, and the way the luminosity function of a given population is sampled in a flux-limited survey like the CDF-N. Overall, we find excellent agreement between our simulations and the observed distribution of ratios for absorbed AGNs in the CDF-N. Our analysis has thus failed to reveal any physical differences between the local population of Seyfert 2s and CDF-N sources with similar X-ray properties. These results support the hypothesis that the nuclear emission lines of many distant hard X-ray galaxies are hidden in ground-based spectra due to a combination of observational effects: signal-to-noise ratio, wavelength coverage, and dilution by host-galaxy light.
1 Introduction
Broadband X-ray observations have revealed that many active galactic nuclei (AGNs) are heavily obscured by dense gas and dust located in their host galaxies (e.g., Awaki et al. 1991). The selective absorption caused by the obscuring medium flattens (or inverts) the intrinsically steep X-ray spectra of these AGNs, making them attractive candidates for the origin of the hard (2–10 keV) X-ray background (XRB; Setti & Woltjer 1989). Detailed models based on the observed properties of nearby AGNs have demonstrated that a distant population of obscured objects is indeed capable of accounting for the spectrum and intensity of the hard XRB (Comastri et al. 1995; Gilli, Salvati, & Hasinger 2001; Moran et al. 2001). Consistent with this expectation, the X-ray colors of sources detected in extremely deep exposures with the Chandra X-ray Observatory, which have resolved the majority of the hard XRB, indicate that obscured AGNs are the most prevalent sources at faint hard X-ray fluxes (Alexander et al. 2003).
Locally, the vast majority of obscured AGNs have the optical spectra of Seyfert 2 galaxies, which are characterized by strong, narrow emission lines. Spectroscopy of faint, hard Chandra sources should, therefore, provide a straightforward means of confirming the Seyfert 2 model for the XRB. But a different picture has emerged: Follow-up studies of distant Chandra sources have instead revealed a significant population of apparently normal galaxies whose starlight-dominated optical spectra have only weak emission lines, if any (e.g., Mushotzky et al. 2000; Barger et al. 2001a, 2001b, 2002; Szokoly et al. 2004). Many such sources have the X-ray properties of Seyfert 2 galaxies, but they seem to lack the corresponding optical emission-line signatures.
There are several viable explanations for the normal optical appearance of distant absorbed AGNs. One possibility is that moderately luminous AGNs in the past tend to be more heavily obscured than similar objects in the local universe (Barger et al. 2001a, 2005). A higher covering factor of the nuclear obscuration would reduce the illumination of the narrow emission-line region by the ionizing continuum, resulting in weaker narrow lines. Alternatively, extranuclear dust may play a greater role in obscuring our view of the narrow emission-line regions of distant objects (Rigby et al. 2006). Yet another possibility is that distant AGNs may accrete predominantly in a radiatively inefficient mode, whereby they produce significant hard X-ray emission but far less of the soft X-ray and ultraviolet flux that is chiefly responsible for the ionization of the narrow-line gas (Yuan & Narayan 2004).
As an alternative to these scenarios, Moran, Filippenko, & Chornock (2002) have suggested that the limitations of ground-based observing may be the culprit. The small angular sizes of distant sources cause their ground-based spectra to be dominated by light from stars and/or H II regions in the host galaxy, which can mask the emission lines associated with their nuclear activity. Integrated spectra of local Seyfert 2s confirm that host-galaxy dilution would alter many of their spectroscopic classifications if they were observed at modest redshifts with ground-based facilities (Moran et al. 2002). Still, the extent to which this dilution affects the demographics of the distant X-ray galaxy population has yet to be demonstrated. Ultimately, a determination of whether the optically normal appearance of distant absorbed AGNs is largely physical or observational in origin has important implications for the nature of supermassive black holes and their environments at earlier epochs.
Unfortunately, distant X-ray galaxies tend to be faint at all wavelengths, which limits the amount and quality of information we have about their properties. For example, over half of the X-ray sources detected in the 2 Ms Chandra Deep Field North (CDF-N; Alexander et al. 2003; Barger et al. 2003) have optical counterparts that are fainter than . Clearly, high-quality optical spectra can only be obtained for the small fraction of relatively bright sources in that field. On the other hand, broadband magnitudes and colors have been measured for nearly all of the CDF-N sources. X-ray–to–optical flux ratios (), therefore, offer one of the best handles we have on the nature of these objects. It has been shown that the ratio broadly discriminates between various classes of celestial X-ray sources (e.g., Stocke et al. 1991), in particular, between luminous AGNs and truly normal (or quiescent) galaxies. Thus, a comparison of the ratios of the optically normal, X-ray–bright objects that have turned up in the deep Chandra surveys to those of local active galaxies with similar high-energy properties could be very informative. For instance, if host-galaxy dilution is generally not a factor, we might expect the deficit of nuclear emission (line and continuum) in the absorption or accretion-mode scenarios described above to lead to systematically higher ratios in the distant population.
A fair comparison of the ratios of nearby and distant objects requires the consideration of several important factors. First, samples of local and high-redshift AGNs are typically defined in very different ways. Nearby samples contain objects recognized as AGNs for a variety of reasons (e.g., X-ray brightness, strength of their emission in some other region of the spectrum, optical emission-line properties, etc.) whereas distant X-ray galaxies are usually identified on the basis of a sole property: detection as an X-ray source. In addition, the volume surveyed in flux-limited studies such as the CDF-N is a sharp function of luminosity, which leads to a deficit of low-luminosity sources and an over-representation of (rare) high-luminosity objects in the derived source catalogs. Thus, nearby and distant AGN samples may contain inherently different types of objects and/or similar objects that are drawn largely from different portions of the AGN luminosity function. Another complication is that different portions of the rest-frame spectra of nearby and distant galaxies fall within the fixed observed-frame bands used to establish their ratios. Redshift effects can have a significant impact on the perceived ratios of AGNs (Moran 2004; Peterson et al. 2006) and must be accounted for. And finally, only the integrated fluxes of distant sources can be measured, and the same must be obtained for local objects.
In this paper, we present a comparison of the ratios of absorbed AGNs in the CDF-N with those of nearby galaxies classified optically as type 2 Seyferts. Our approach accounts for the observational factors described above by (1) employing a nearby sample that well represents the local Seyfert 2 luminosity function and (2) accurately simulating how the nearby objects would appear if they were observed in the CDF-N, including the effects of how pencil-beam surveys like the CDF-N sample the luminosity function of a given population. This allows us to examine in detail the extent to which nearby, well-characterized AGNs can explain the properties of distant, spectroscopically ambiguous X-ray galaxies. The criteria used to define the comparison sample of absorbed AGNs from the CDF-N are outlined in § 2. In § 3, the local Seyfert 2 sample is described, along with the integrated optical and X-ray data we have collected for the objects. Our simulations are presented in § 4, along with discussion of how the ratios of Seyfert 2 galaxies are transformed by redshift and sampling effects. Our findings are summarized in the final section.
2 The CDF-N Sample of Absorbed AGNs
Our investigation of the ratios of absorbed AGNs requires an appropriate sample of distant X-ray galaxies from a well-characterized survey, and an unbiased sample of local objects with broadband X-ray and optical data. For the distant X-ray galaxy sample, the 2 Ms CDF-N is an ideal resource. The details of the Chandra observations and parameters of the sources detected in the survey have been thoroughly documented (Alexander et al. 2003). In addition, deep optical imaging and spectroscopy of the sources have been obtained with the Subaru 8 m and Keck 10 m telescopes (Barger et al. 2002, 2003), yielding optical fluxes and, for many objects, spectroscopic redshifts.
The sources we have selected from the CDF-N have X-ray properties similar to those of nearby Seyfert 2s and are drawn from a well-defined portion of the deep survey. First, we select only sources with total exposure times between 1.5 Ms and 2.0 Ms. This exposure time range brackets the strong peak in the CDF-N source exposure time distribution centered at 1.7 Ms (Alexander et al. 2003), and because it is narrow, it allows us to establish an effective X-ray flux limit and solid angle for the deep survey, which are required for the simulations described below. Next, since we are chiefly concerned with the origin of the XRB, we select CDF-N sources with 2–8 keV hard-band detections and absorbed X-ray spectra with effective photon indices (as indicated by their “hardness ratios”). These are the sources responsible for the hard XRB, and based on observations of nearby objects, they are expected to be Seyfert 2 galaxies. Finally, we require that the included sources have a measured spectroscopic redshift.
Over 80% of the sources that satisfy these criteria have redshifts between and . We have further restricted our CDF-N sample to this redshift range for two reasons. First, objects closer than are probably extended in optical images, and published magnitudes for them may not reflect their total optical emission. Second, our simulations (§ 4) employ UBVRI data for nearby Seyfert 2s to yield the observed-frame -band fluxes they would have at various redshifts. At , the rest-frame band is roughly centered on the observed band. Adopting this redshift limit thus eliminates the need for significant extrapolation of our local galaxy spectra to wavelengths shortward of .
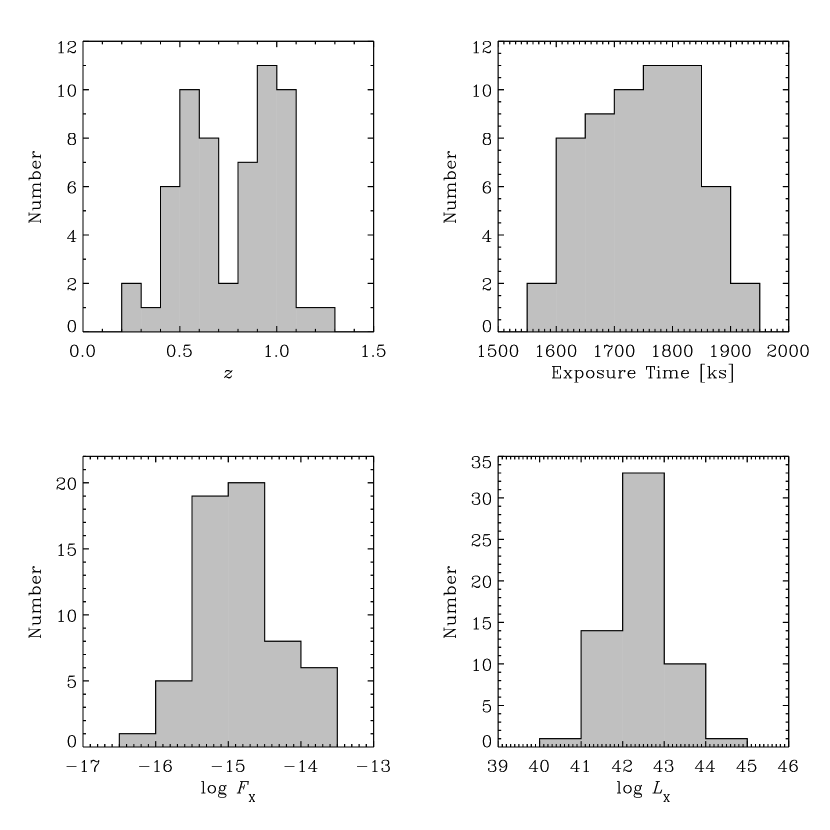
A total of 59 CDF-N sources meet all of our selection criteria. Using published 2–8 keV fluxes and -band magnitudes (Alexander et al. 2003; Barger et al. 2002, 2003), we have computed their observed-frame flux ratios. Optical spectra are published for only 38 of the objects (Barger et al. 2002), but a visual inspection of these indicates only half a dozen or so clearly have the spectral signatures of narrow-line AGNs. Curiously, one other object is reported to have broad emission lines, though they appear to be weak in the Barger et al. data. The spectra of the rest of the objects are consistent with those of normal galaxies, or are ambiguous because of the signal-to-noise ratio and/or wavelength coverage of the data. Presuming the rest of the objects we have selected to be similar, it is safe to conclude that the majority of the absorbed AGNs in our CDF-N sample are not considered to be Seyfert 2s on the basis of their ground-based optical spectra. The redshifts, Chandra exposure times, 2–8 keV fluxes, and 2–8 keV luminosities of the CDF-N objects are shown in Figure 1.
3 The Local Sample of Seyfert 2 Galaxies
To ensure that our comparison of the ratios of nearby and distant objects is fair, it is vital that we employ a local sample that is as complete and unbiased as possible. However, because of the variety of ways in which Seyfert 2s have been discovered and the fact that their luminosity function is not firmly established, this is a non-trivial matter. The biases that result when samples are flux-limited and defined on the basis of a particular property (e.g., ultraviolet excess or far-infrared color) are well documented (Ho & Ulvestad 2001). In addition, samples of Seyfert 2 galaxies can be tainted by spectroscopic misclassifications.
To minimize the effects of selection biases and contamination in our study, we have chosen to use objects drawn from the distance-limited sample of Ulvestad & Wilson (1989; hereafter UW89), which consists of all Seyfert galaxies known (at the time of its definition) with redshifts km s-1 () and a declinations . Because the objects were included on the basis of distance, and not some observed property, and because their nuclear activity was noticed for a variety of reasons, the sample is free of significant selection biases. In addition, detailed optical investigations of this sample have verified that all 31 of the Seyfert 2s it contains are bona fide narrow-line AGNs (Moran et al. 2000). For this study, we also include the 7 objects listed by UW89 as “narrow-line X-ray galaxies” (NLXGs), despite the fact that several of them are technically intermediate type 1 Seyferts that display weak, broad H components in high-quality optical spectra. Our analysis of ASCA data for the NLXGs (§ 3.2) has confirmed that all of the objects are absorbed X-ray sources, with column densities of cm-2 or more. Thus, over a range of redshifts they would satisfy the spectral flatness criterion used above to select absorbed AGNs in the CDF-N (§ 2). Including the NLXGs, our local sample of absorbed AGNs (which we refer to as “Seyfert 2s” for convenience) stands at 38 objects.
We note that not every galaxy within the UW89 distance and declination limits has been searched for a Seyfert nucleus, so the sample must be incomplete to some degree. Indeed, some Seyfert galaxies have been discovered within the sample volume since 1989. The level of incompleteness is probably most significant at low values of the nuclear luminosity, where, in many cases, an accurate emission-line classification cannot be made without careful starlight template subtraction (Ho, Filippenko, & Sargent 1997). Still, several lines of evidence suggest that the UW89 sample, while falling short of perfection, is nonetheless a very good one. First, the radio properties of the UW89 Seyferts are broadly consistent with those of objects in other samples, e.g., the CfA sample (Kukula et al. 1995). Second, as Figure 3 of Lumsden & Alexander (2001) illustrates, the UW89 sample extends to much lower luminosities than other well-studied collections of Seyfert 2s, such as the CfA/12 m (Tran 2001) and IRAS (Lumsden et al. 2001) samples. Thus, it contains more typical Seyfert 2s and suffers less from an over-representation of high-luminosity objects than these other samples. Finally, the X-ray luminosity density of the Seyfert 2 population derived from the UW89 sample is able to account for both the intensity and spectral slope of the 2–10 keV X-ray background (Moran et al. 2001). Taken in combination, these results suggest that the UW89 sample must represent the luminosity function of type 2 Seyfert galaxies reasonably well.
3.1 Broadband Optical Data
The fluxes measured for distant CDF-N objects reflect their integrated optical and X-ray emission; comparable data are needed for local Seyfert 2 galaxies so that we can simulate what their ratios would be if they were observed at modest redshift in the CDF-N. Surprisingly, although the UW89 objects are among the most well-studied Seyfert 2 galaxies, relatively little information about their integrated optical fluxes has been published. Integrated magnitudes in the blue and visual bands can be found for about 60% of the sample, and data at redder wavelengths are even more sparse. In this section we describe our UBVRI observations of over half of the UW89 sample, and our methods of determining integrated magnitudes for the remainder of the objects.
3.1.1 UBVRI Observations
Our optical data were acquired with the 0.9-m WIYN telescope at Kitt Peak and the 1.3-m McGraw Hill telescope at the MDM Observatory during six separate runs between 2003 January and 2006 January. On the WIYN telescope, we used the S2KB CCD, which affords a field of view and an image scale of per pixel. At MDM we employed the “Templeton” CCD, which has an field of view and a scale of per pixel. Images were obtained with Harris UBVRI filters on the 0.9-m, and on the 1.3-m, Harris BVR filters were used in conjunction with a Bessell filter and an Arizona filter. During our 2003 October, 2004 March, and 2006 January runs, we obtained photometric observations in all five bands for 21 UW89 galaxies.
We processed our images using standard IRAF procedures. In each, an integrated instrumental magnitude was measured within a circular aperture centered on the nucleus of the UW89 galaxy. The size of the aperture was initially selected to include all of the galaxy flux visible when the image was displayed with extreme settings of the contrast and dynamic range. The aperture was then resized to the point at which increasing its radius did not result in an increase of the galaxy’s flux. The flux from foreground stars was measured and subtracted from the total flux in the galaxy aperture. The sky background level was estimated within a concentric annulus placed well outside the galaxy aperture. A few of the UW89 objects have nearby companions, which have not been excluded in our measurements. Our objective is to compare the UW89 sample and distant X-ray galaxies, and the flux from companions would not be separable in observations of the latter. By including companion flux in the nearby sample we preserve the true diversity of the morphologies and integrated colors of its members, making our comparison as valid as possible. In the end, this concerns only a handful of objects: NGC 5929 is interacting with NGC 5930, a spiral galaxy of comparable brightness; NGC 262 has a minor companion, LEDA 212600, and two fainter satellite galaxies; and NGC 1667 has a single dwarf companion.
We observed equatorial standard star fields (Landolt 1992) to calibrate our instrumental magnitudes. Average extinction coefficients for each band were obtained from Landolt (1983). Following Bessell (1995), we transformed the magnitudes of the standard stars to the Johnson-Kron-Cousins system defined by Bessell (1990). The formal uncertainties in our UBVRI measurements, which include the effects of photon statistics, flat-fielding accuracy, aperture size, and transformation to the standard scale, are estimated to be 0.02–0.04 mag. Table 1 lists the UBVRI photometry results for the 21 objects we observed.
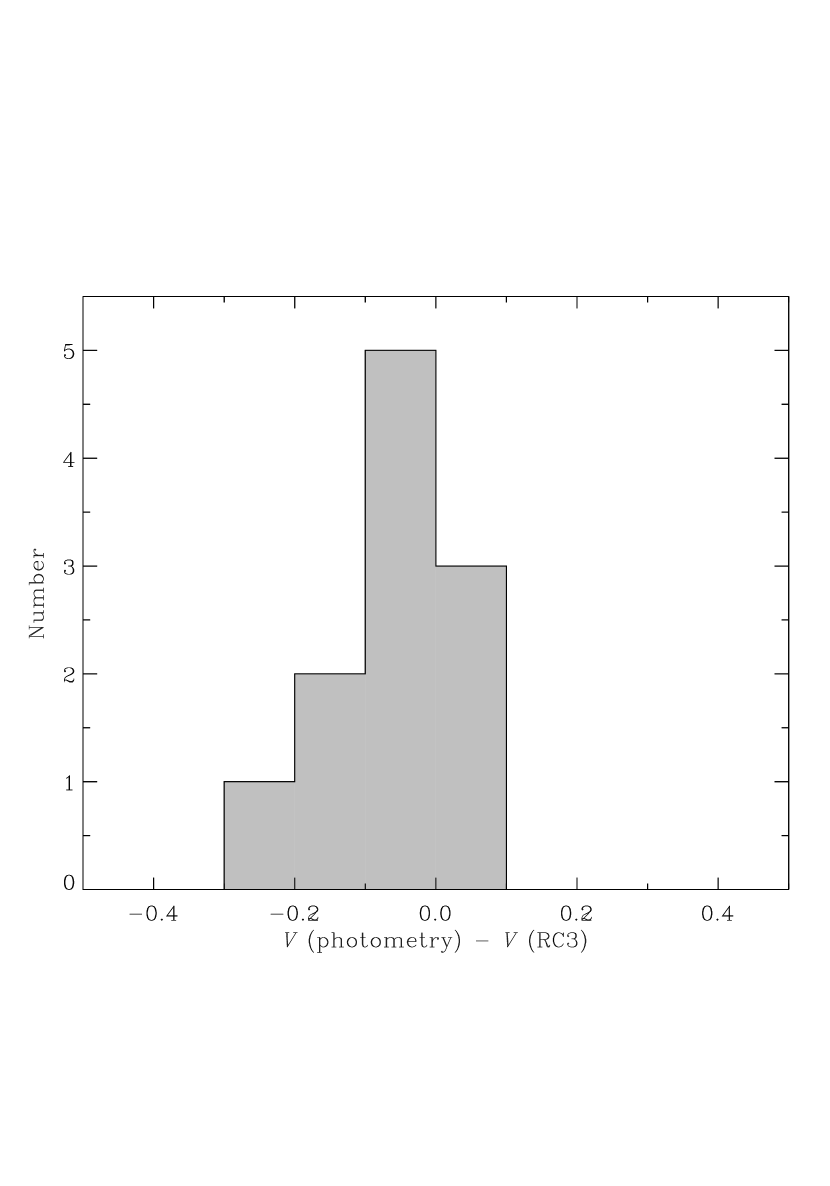
For 12 of these galaxies, integrated photoelectric photometry in and (with typical uncertainties of 0.1–0.2 mag) is published in the Third Reference Catalog of Bright Galaxies (RC3; de Vaucouleurs et al. 1991). This provides a limited opportunity to check the accuracy of our measurements. As the left panel of Figure 2 indicates, the differences between our -band magnitudes and those listed in the RC3 are (for 11 objects) consistent with the expected uncertainties in the two quantities (the median offset is 0.04 mag with a standard deviation of 0.10 mag). One significant discrepancy was uncovered, however: We find Mrk 3 to be brighter than the RC3 values by 0.58 mag in and 0.43 mag in . The problem may be related to a very bright foreground star located within the aperture we used to extract the galaxy’s flux. The star is not responsible for our flux being too high — using an aperture that completely excludes the star we obtain a value that is fainter by only 0.2 mag. Thus, we are confident that we have successfully removed the contribution of the star in our full-aperture data, but it is not clear how the contamination was handled in the RC3 measurement. We note that the RC3 also lists values of — photographic magnitudes from the Shapley-Ames catalog (Sandage & Tammann 1981) that have been reduced to the system. The value for Mrk 3 of is entirely consistent with our measurement of . Thus, given the overall agreement between our measurements and those listed in the RC3, we have confidence in the accuracy of our photometry.
3.1.2 Integrated Magnitudes of the Unobserved Galaxies
Information about the integrated magnitudes of the 17 (mostly southern) galaxies we did not observe is also available from the RC3 (, , and ) and the ESO-Uppsala survey ( and ; Lauberts & Valentijn 1989). We have adopted photoelectric magnitudes from the RC3 whenever they are available (12 galaxies), and have supplemented these with photographic magnitudes from the ESO catalog when (ESO) agrees with (RC3). Three other objects that have only photographic magnitudes in the RC3 have and measurements in the ESO catalog; the magnitudes agree in each case, so we have adopted the ESO values for these galaxies. Only data are available for the two remaining objects.
To estimate integrated magnitudes in the bands lacking published data, we have used the and/or colors of the objects to determine the most appropriate Johnson-Cousins color template from the compilation of Fukugita et al. (1995). The majority of the galaxies are best represented by an Sab template, though for several an S0 (6 galaxies) or Sbc (2 galaxies) template provides the closest match. For the two objects with magnitudes only (thus no integrated colors), we have adopted the Sab template. In all cases, the template we have selected is consistent with the galaxy’s morphological type listed in the NASA/IPAC Extragalactic Database (NED).
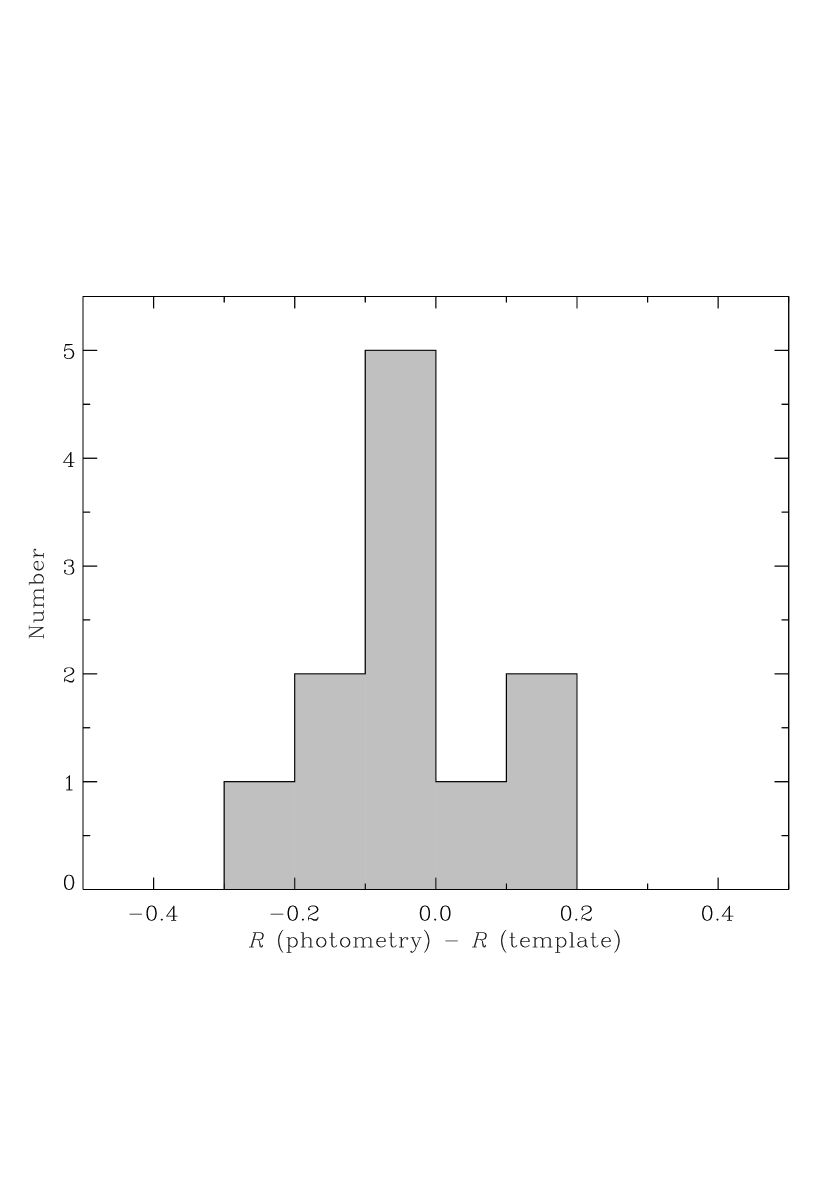
Turning once more to the 11 objects we observed that have reliable photoelectric data in the RC3, we have compared the -band magnitudes extrapolated from their values to the magnitudes that we derived from our images. As the right panel of Figure 2 indicates, the median difference in these magnitudes is 0.04 mag with a standard deviation of 0.11 mag. The similarity between the left and right panels of Figure 2 suggests that the application of a Fukugita et al. (1995) template does not add an appreciable systematic error to the extrapolated magnitudes, giving us confidence that the extrapolated magnitudes for the unobserved objects are reasonably accurate. The integrated magnitudes obtained from the literature, together with those derived from application of the appropriate color template, are listed in Table 2. The final column of Table 2 indicates the bands for which published data are available and the Fukugita et al. (1995) galaxy template that was used.
3.1.3 Corrections for Galactic Extinction
Corrections for Galactic extinction are necessary for a determination of the true optical fluxes of the UW89 Seyfert 2s and for comparisons to galaxies in other samples. We corrected our magnitudes by computing for each object in each of the five bands. Values of the color excess in the direction of each galaxy (originating from Schlegel et al. 1998) were obtained from NED. The total absorption in each band was then calculated from using Table 6 of Schlegel et al. (1998). The final extinction-corrected magnitudes for all 38 UW89 objects are listed in Table 3. For clarity, magnitudes obtained from our observations or the RC3 are given in plain type and those derived with the use of a Fukugita template are given in italics. The Galactic latitudes of the UW89 members span a wide range, so the extinction corrections vary considerably from object to object.
3.1.4 Ultraviolet Data
In the simulations described in § 4, information about the slope of the near-UV spectra of the UW89 objects is needed to ensure that the observed-frame -band fluxes we predict for them are accurate for all assumed redshifts up to our limit of . The atlas of galaxies observed with GALEX (Gil de Paz et al. 2006) provides integrated fluxes for 8 UW89 Seyfert 2s (Mrk 3, NGC 262, 1068, 1386, 2992, 4117, 4388, and 7582) at a near-UV wavelength of 2267 Å. After correcting for Galactic extinction [; Gil de Paz et al. 2006], we find that the colors of our 8 objects range from 1.64 to 3.17. For the rest of the UW89 objects, we adopt the median value of .
3.2 X-ray Data
Broadband X-ray data in the –10 keV energy range are available for the entire UW89 Seyfert 2 sample. Nearly all (36/38) of the objects were observed with the ASCA satellite; the two remaining galaxies (NGC 5283 and NGC 5728) have been observed with the Chandra X-ray Observatory. Although several other UW89 galaxies have also been observed with Chandra, the ASCA data are preferred because of the consistent depth of the exposures and the fact that, due to the large ASCA beam ( arcmin half-power diameter), we can be sure that they represent the total X-ray flux from the nucleus and host galaxy. The nucleus is likely to dominate in the majority of cases, at least at the higher X-ray energies, but many objects are weak and their extended X-ray emission (from supernova remnants, X-ray binaries, etc.) could be comparable to the nuclear flux.
Details of the ASCA observations and data reduction for the UW89 sample have been described by Moran et al. (2001); a brief summary is provided here. The data were obtained from our own observations and from the HEASARC data archive at NASA’s Goddard Space Flight Center. The ASCA exposure times of the UW89 Seyfert 2s are uniformly long (most are in the 35–45 ks range), and the targets were placed at the “1-CCD” off-axis position in most of the images. For this work we focus on data collected with the Gas Imaging Spectrometers (GIS) on board ASCA; compared to the satellite’s SIS instruments, the GIS have better hard X-ray sensitivity and more consistent response, and due to their larger field of view, background estimation is more straightforward with them.
The Chandra images of NGC 5283 and NGC 5728 were obtained from the data archive at the Chandra X-ray Observatory Center (CXC). The objects were observed with the ACIS-S instrument for 9.8 ks and 19.0 ks, respectively. Both sources are relatively weak ( count s-1), so spectral distortions resulting from photon pile-up are not a concern.
We extracted source and background events for all of the ASCA and Chandra data sets, and generated response and effective area files specific to the individual observations. All 38 UW89 Seyfert 2s were detected above a signal-to-noise ratio of 4 (full band). For 25 objects, the net counts obtained were sufficient to allow spectral modeling with the XSPEC software (Arnaud 1996). We have modeled the spectra as the sum of three components: a weakly absorbed power law with a photon index and associated column density of , a heavily absorbed power law with slope and column density , and a Gaussian Fe K line of width centered at energy . In all instances but one, an acceptable fit with reasonable best-fit spectral parameters was obtained. The exception is NGC 1068, which has a far more complex broadband X-ray spectrum (Iwasawa, Fabian, & Matt 1997; Matt et al. 1997). Table 4 lists the adopted distances to the galaxies (see Moran et al. 2001), the X-ray spectral parameters derived from our fits, and the associated X-ray fluxes in the 0.5–2 keV and 2–8 keV bands. We note that while our relatively simple spectral models generally afford statistically acceptable fits, they may not represent the best physical description of the X-ray emission in every case. The main purpose of our spectral analysis is to provide accurate fluxes, which it does. This is true even for NGC 1068; our approach yields soft- and hard-band fluxes that are respectively within 10% and 1% of those obtained using a more complex model that provides a good fit.
For the 13 weakly detected objects, X-ray fluxes were estimated from ratios of the counts detected in hard (4–10 keV) and soft (1–4 keV) bands. First, we computed the median Seyfert 2 X-ray spectrum based on the spectral fits obtained for the 25 “strong” sources above. The median spectrum is characterized by the following parameters: , , , and cm-2. (An Fe K component is not included, for reasons that will become clear below.) The median model is similar to the composite Seyfert 2 X-ray spectrum derived from the summed emission of the UW89 objects (Moran et al. 2001), despite the fact that the latter is dominated by the most luminous sources.
To estimate the X-ray fluxes of the weak sources, we fixed the parameters of the median model and varied the normalizations of the two power-law components in XSPEC until the hard-to-soft counts ratio associated with the model matched the observed counts ratio. We then fixed the ratio of the normalizations and scaled them until the count rate implied by the model was identical to the total observed count rate. The fluxes in 0.5–2.0 keV and 2.0–8.0 keV ranges were then computed from the model. To validate our approach, we applied the same procedure to the “strong” sources whose spectra could be modeled directly. As Figure 3 indicates, the 2–8 keV fluxes obtained directly from spectral fitting and those obtained using the median model differ by only a few percent in most cases (even without a contribution from an Fe K line). Based on this good agreement, we are confident that the fluxes we have derived for the 13 weak objects (also listed in Table 4) are reasonably accurate.
4 Simulations
4.1 Approach
A direct, fair comparison of the ratios of distant absorbed AGNs with those of nearby Seyfert 2 galaxies cannot be made. First of all, the ratio is measured in the observed frame, so its value for a given object varies with redshift. Secondly, the ways in which samples of distant and nearby sources are assembled naturally lead to different luminosity distributions in the samples, which in turn affect the distributions of their ratios. Our approach, therefore, is to take a sample of nearby Seyfert 2s that well represents the local luminosity function and simulate the distribution of flux ratios that would result if they were observed under the same conditions (and with the same redshift distribution) as the distant sources. This minimizes the effects of redshift and selection bias.
We begin by applying the information listed in Table 4 to determine the fluxes of each UW89 source in the observed 0.5–2 keV and 2–8 keV bands as a function of redshift. The luminosity distances used in the calculations are based on an = 70 km s-1 Mpc-1, , cosmology. The results establish the redshift range within which each UW89 object would be detectable if observed as part of the Ms portion of the CDF-N survey. Specifically, we apply the same criteria used to define our CDF-N sample of absorbed AGNs: a 2–8 keV flux limit corresponding to the this exposure time ( erg cm-2 s-1) and an effective spectral index , which corresponds to a flux ratio . It is interesting to note that, based on these criteria, four UW89 galaxies would not be included in the CDF-N (as absorbed AGNs) in the range. The spectra of NGC 1068, NGC 1386, and NGC 5135 are too steep to meet the spectral flatness criterion while their 2–8 keV fluxes are above the hard X-ray flux limit. The fourth object, NGC 4941, falls below the flux limit before . Only 10 objects would be detectable in the CDF-N all the way out to our redshift limit of .
We use Monte Carlo methods to simulate the distribution that nearby Seyfert 2 galaxies would have if observed in the CDF-N, randomly selecting a redshift (weighted by the CDF-N redshift distribution) and a UW89 galaxy (unweighted, since to first order the UW89 sample is the local Seyfert 2 luminosity function). We first verify that the UW89 object would be included in the CDF-N as an absorbed AGN at the chosen redshift. If not, another galaxy is selected at the same redshift. Next, we determine the likelihood that an object with the UW89 galaxy’s X-ray luminosity would be included in the CDF-N. For this test, we have combined the CDF-N flux limit and survey solid angle (170 arcmin2 for Ms) to estimate the volume searched in the CDF-N as a function of minimum detectable 2–8 keV luminosity. The results are plotted in Figure 4, along with the fixed volume represented by the UW89 sample (calculated by Moran et al. 2001). Below a luminosity of erg s-1, the volume searched in the CDF-N is less than that of the UW89 sample. Therefore, in this range, the ratio of the CDF-N volume to the UW89 volume defines the probability that a local object of a given luminosity would be included in the CDF-N.
If a UW89 galaxy passes all the above tests, the UBVRI photometry reported in § 3 is used to compute its integrated, observed-frame -band flux. The optical spectrum of the object is approximated by converting the broadband magnitudes to flux densities at the band centers and assuming they are joined by power laws. The spectrum is shifted and dimmed appropriately for the selected redshift; the portion falling within the observed band is then integrated over the width of the band to give us the optical flux. As the redshift approaches , the rest-frame UV spectrum shortward of the center of the band enters the observed-frame band. The NUV data (§ 3.1.4) is used to extrapolate to shorter wavelengths, though the value of the color we adopt affects the flux by %. Using the derived optical flux, the ratio of the object is then calculated. The process continues until an distribution composed of UW89 objects is obtained.
4.2 Redshift and Sampling Effects
Before presenting the results of our simulations and a comparison to the CDF-N, we explore the way source redshifts and the flux-limited nature of deep surveys combine to influence the ratios of a population of absorbed AGNs.
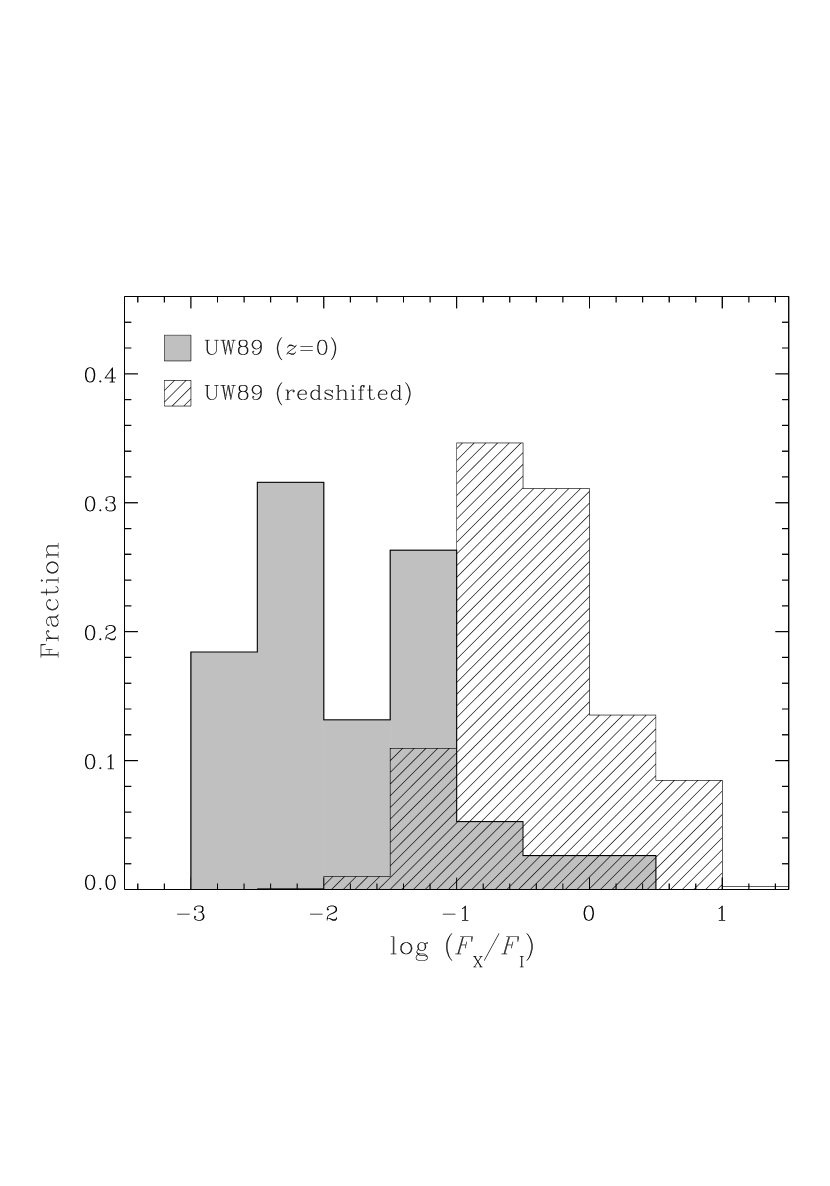
As Table 3 indicates, the intrinsic integrated optical colors of the UW89 objects are quite red (). In the X-ray band, the heavy absorption in Seyfert 2 galaxies usually hardens their observed X-ray spectra considerably (see the composite UW89 X-ray spectrum in Fig. 1 of Moran et al. 2001). Thus, as the redshift of a typical Seyfert 2 galaxy increases, a brighter portion of its rest-frame X-ray spectrum is shifted into the observed 2–8 keV band, and a fainter portion of its rest-frame optical spectrum is shifted into the observed band. The observed-frame ratio should therefore increase significantly with redshift. This effect is clearly demonstrated in Figure 5, where we have plotted , , and vs. redshift for four UW89 Seyfert 2s spanning a wide range of intrinsic ratios. Between and , the observed flux ratios of these objects increase by factors of 15 to 35.
Of equal importance are the effects of sampling in a flux-limited survey such as the CDF-N. As Figure 4 illustrates, the volume searched for X-ray galaxies in the CDF-N is a strong function of the observed 2–8 keV luminosity. This naturally leads to Malmquist bias in the CDF-N source catalog, i.e., an under-representation of relatively abundant sources with low X-ray luminosities, and an over-representation of rare, high-luminosity sources. If happens to depend on (and it does; see § 4.3), these Malmquist effects will be imprinted on the distribution for absorbed AGNs in the CDF-N.
In combination, the effects of redshift and sampling can dramatically alter the observed distribution for Seyfert 2 galaxies. In Figure 6 we have plotted the rest-frame distribution for the UW89 sample, along with the distribution obtained by simulating CDF-N observations of the UW89 objects (as described in the previous section). Clearly, the two distributions bear no resemblance to each other, even though they are derived from the same set of objects. This illustrates why a direct comparison of the ratios of nearby and distant sources would yield misleading results. More generally, Figure 6 indicates that , as an activity diagnostic, can be ambiguous. X-ray survey results are often summarized with plots that compare the X-ray and optical fluxes of the detected sources, with diagonal lines drawn for constant values of (e.g., Alexander et al. 2003; Bauer et al. 2004). Frequently, the region on these plots represented by log are labeled “AGNs,” while that represented by log are labeled “galaxies.” Our investigation of the UW89 sample reveals that Seyfert 2s at modest redshift can have ratios well outside the range expected for AGNs.
4.3 Comparison to the CDF-N
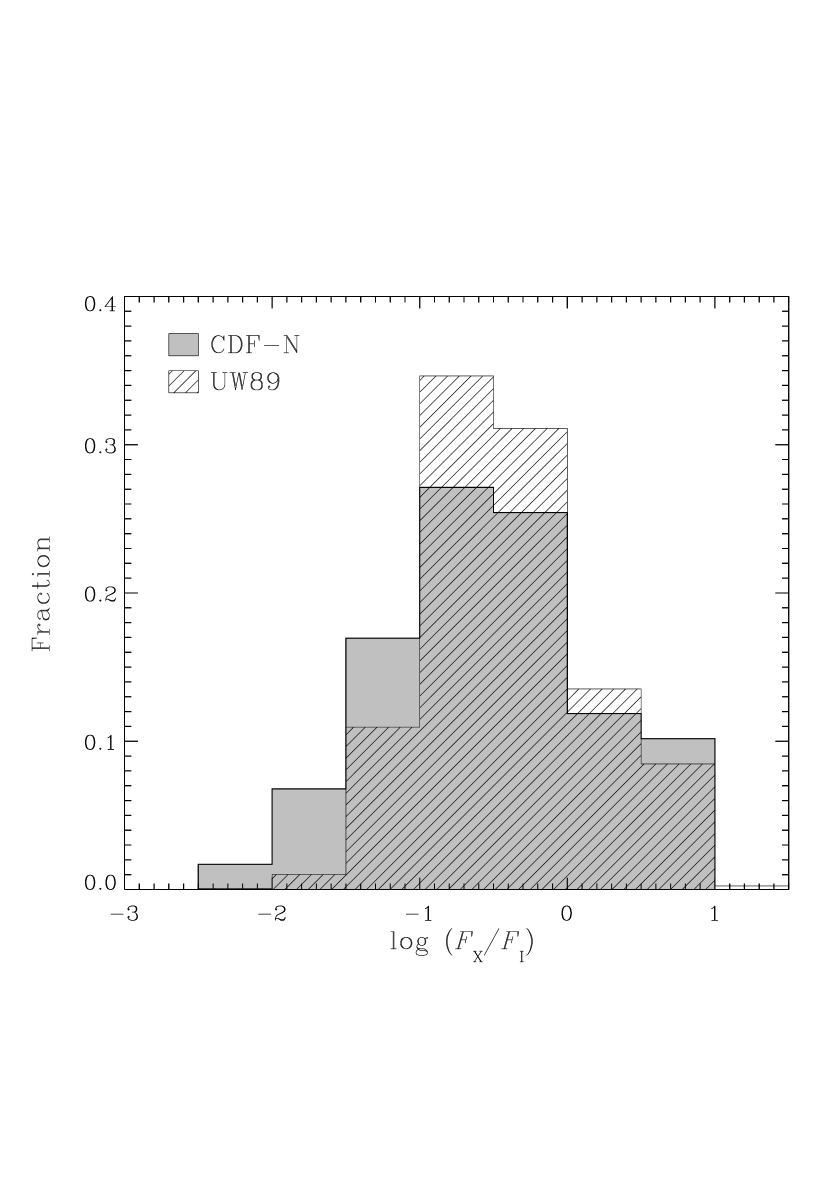
The distribution for the absorbed AGNs in the CDF-N and the results of our simulations are compared in Figure 7. As the Figure indicates, the two distributions are broadly consistent with each other: they peak at the same place and have roughly the same width. The match is especially good for values of log . Note that the CDF-N distribution comprises just 59 objects, so there is some statistical uncertainty associated with the number of objects in each bin of that distribution. The only possible discrepancy occurs at the lowest ratios, where the simulated UW89 distribution falls consistently below the CDF-N distribution. Given the nature of the rest-frame distribution of the UW89 sample (Fig. 6), there is no chance that the good agreement between the CDF-N and simulated UW89 flux-ratio distributions is coincidental. Instead, it must be a reflection of the similarity between the nearby and distant populations of absorbed AGNs.
A more detailed comparison is provided in Figure 8, which plots the observed ratio as a function of observed 2–8 keV luminosity for the 59 CDF-N sources and a UW89 simulation consisting of 75 successful trials. Two things are immediately obvious in Figure 8: (1) the CDF-N and UW89 points occupy similar locations in the – plane, and (2) scales roughly linearly with for both populations, albeit with a fair amount of dispersion. The fact that UW89 and CDF-N galaxies of a certain nuclear luminosity () have about the same range of ratios indicates that they are fundamentally similar objects in terms of their optical properties. Moreover, because the slope of the “correlation” between and is about unity, the median optical luminosity of the objects must be roughly constant and independent of the luminosity of the nucleus. In a statistical sense, therefore, it appears that the optical luminosities of absorbed AGNs (with observed ergs s-1) are dominated by emission from the host galaxy.
It is also evident from Figure 8 that the match between the UW89 and CDF-N samples is not perfect. In particular, there are no UW89 objects with observed hard X-ray luminosities above ergs s-1, whereas the CDF-N sample extends to ergs s-1. Also, there appear to be too few UW89 objects with ergs s-1 and log , consistent with the discrepancy between the flux-ratio distributions shown in Figure 7. Although several factors can affect the exact location of an absorbed AGN in the – plane, the differences indicated in Figure 8 are almost certainly related to the completeness of the UW89 sample rather than physical differences between the nearby and distant sources. At the high- end, the volume associated with the UW89 sample is too small to include rare, high-luminosity objects, which are in fact over-represented in the CDF-N due to the large volume it surveys for such sources (see Fig. 4). At the low- end, the incompleteness of the UW89 sample noted in § 3 is probably the primary issue. Again, the nearby Seyfert 2 galaxies that are absent in the UW89 sample are likely to be objects with low-luminosity nuclei, such as those for which starlight template subtraction is required for an accurate emission-line classification. Having more local galaxies with low X-ray luminosities would increase the representation of low- sources in our simulations. The fact that our simulations reproduce the flux-ratio distribution of distant absorbed AGNs as well as they do implies that the shortcomings of the UW89 sample are not too severe.
4.4 Optically Normal X-ray Galaxies in the Deep Surveys
If nearby Seyfert 2 galaxies are able to account for the relative X-ray and optical properties of distant absorbed AGNs, why do the objects detected in the Chandra deep surveys often lack emission-line evidence for nuclear activity? As Moran et al. (2002) have demonstrated, a combination of observational factors — host-galaxy dilution, signal-to-noise ratio, and wavelength coverage — are capable of making many UW89 Seyfert 2s appear “normal” in their integrated spectra. The bulk of the UW89 and CDF-N objects overlap in terms of their optical luminosities, which in both cases are dominated by host-galaxy emission, so these observational factors should affect the ground-based spectra of distant absorbed AGNs in a similar way. It would seem, therefore, that additional hypotheses for the optically normal appearance of the CDF-N population — at least those objects that satisfy our selection criteria — are unnecessary at this time.
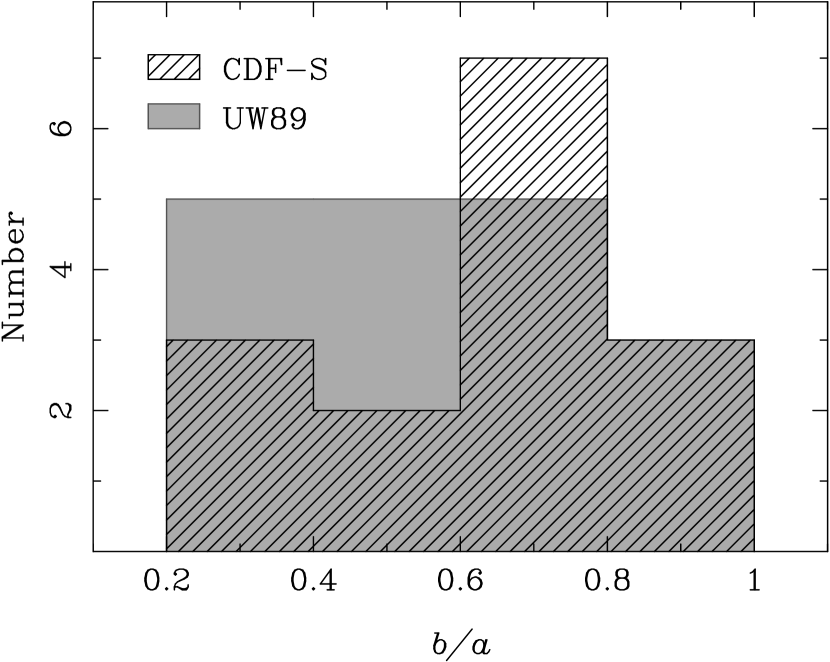
However, in a recent study of objects from the Chandra Deep Field South (CDF-S), Rigby et al. (2006) have argued that the absence of strong AGN-like emission lines in the ground-based spectra of distant X-ray galaxies results primarily from obscuration of the narrow-line region by extranuclear dust, rather than host-galaxy dilution. Their conclusions are based on the finding that the morphologies of optically active galaxies (with broad emission lines or high-excitation narrow lines) and optically dull galaxies (with weak and/or low-excitation emission lines) differ statistically. Optically active galaxies in the CDF-S tend to have high ratios of their semiminor and semimajor axes , whereas optically dull objects have a relatively flat distribution of . Taking the measured axis ratio as a proxy for inclination, Rigby et al. suggest that the optically dull sources are missing AGN-like emission lines because extranuclear dust obscures the narrow-line region in the more inclined galaxies.
To examine the inclination hypothesis, we have compared axis ratio distributions for appropriate subsets of the Rigby et al. and UW89 samples. For the CDF-S galaxies, we have compiled the distribution for those objects in the subsample of Rigby et al. that satisfy our X-ray selection criteria, i.e., detection in the 2–8 keV band and a (2–8 keV)/(0.5–2 keV) flux ratio in excess of 2. Although we have ignored their emission-line classifications, this resticted CDF-S sample of 15 objects includes just one optically active source — a narrow-line object — so any possible confusion introduced by the presence of broad-line AGNs has been eliminated. Likewise, we have limited the UW89 comparison sample to include only the 18 objects that would be detected in the CDF-S ( ergs cm-2 s-1) at . We have estimated axis ratios for the UW89 galaxies using our images or images available from NED. Our measurements, obtained both by hand and with the ellipse task in IRAF, are based on the shape of the outer, low surface-brightness isophotes. The two methods yield very similar results for all objects where both could be successfully employed. In a handful of cases (e.g., interacting galaxies) the output from ellipse is suspect and we favor the values measured by hand. Our best estimates of for the UW89 subsample are listed in Table 5. As Figure 9 indicates, local Seyfert 2s have a very broad distribution of , implying that they are at least as inclined as the optically dull objects in the CDF-S. One caveat here is that has not been measured in exactly the same way for the nearby and distant sources. However, given the coarse binning used in Figure 9 it is unlikely that a different measurement approach for the local sample would alter these results significantly. The fact that the UW89 objects have strong nuclear emission lines suggests that inclination, and the associated effects of extranuclear dust, cannot be the primary origin of the optically normal appearance of the distant, absorbed X-ray galaxies.
In a recent complementary study, Peterson et al. (2006) have examined the ratios that nearby AGNs would have if they were observed at a redshift of . Their analysis revealed that many such objects would have low ratios and modest X-ray luminosities, similar to the optically bright, X-ray–faint sources (OBXFs; Hornschemeier et al. 2001, 2003) that have been detected in the CDF-N. Spectroscopically, the OBXFs appear to be quiescent, and Peterson et al. have reasoned that many could harbor normal Seyfert 2 nuclei if host-galaxy dilution is significant in their ground-based optical spectra. Our results support this conclusion. In Figure 5, it is clear that redshift effects on are slight at . All but a few of the UW89 objects would be detectable at in the CDF-N, so the UW89 distribution at that redshift would look much like the distribution shown in Figure 6, shifted by only in log . A significant number of the UW89 galaxies would therefore have log , similar to the OBXFs in the CDF-N. In addition, the low- objects in the sample would have X-ray luminosities in the range of normal galaxies ( ergs s-1 or less), and many would have quiescent optical spectra (Moran et al. 2002). Thus, as Peterson et al. have suggested, a number of the OBXF objects could be unrecognized Seyfert 2s.
5 Summary and Conclusions
To investigate the nature of the “normal” X-ray–luminous galaxies in the CDF-N, we have obtained UBVRI photometry and broadband X-ray data for a distance-limited Seyfert 2 galaxy sample that broadly represents the local luminosity function for absorbed AGNs. From these data we have measured the integrated fluxes of the galaxies, since this is what is normally derived from multiwavelength observations of the distant objects detected in the deep X-ray surveys.
We have selected a sample of absorbed AGNs from a well-defined portion of the CDF-N for comparison to the local objects. Using the redshift distribution of the CDF-N sources, we have simulated the ratios that the UW89 objects would have if they were observed at modest redshift as part of the CDF-N. By including (1) the effects of redshift on flux measurements in fixed observed-frame bands, and (2) the way the luminosity function of a given population is sampled in a flux-limited survey like the CDF-N, we have shown that nearby Seyfert 2s with strong nuclear emission lines are able to account for the X-ray and optical properties of distant absorbed AGNs, despite the fact that the latter often lack optical evidence for nuclear activity in ground-based data. The integrated spectra of UW89 galaxies indicate that observational factors — host-galaxy dilution, signal-to-noise ratio, and wavelength coverage — are capable of hiding the nuclear emission lines of bona fide Seyfert 2s (Moran et al. 2002). We conclude, therefore, that the same factors provide the simplest explanation for the “normal” appearance of many absorbed AGNs in the Chandra deep surveys. Note that our arguments are statistical — it is certainly possible that some distant absorbed AGNs appear to be normal because they are located in edge-on host galaxies, or because they have unusually high amounts of nuclear obscuration. In general, though, we have been unable to identify differences between the nearby and distant populations of absorbed AGNs that cannot be attributed to host-galaxy dilution. Until we do, it seems unnecessary to invoke the existence of a significant new class of X-ray–bright, optically normal galaxies (XBONGs; Comastri et al. 2002) that differ from nearby Seyfert 2s in some fundamental way.
The problem with the X-ray–luminous “normal” galaxies may be mainly a matter of perception. In Figure 10, we have plotted the integrated spectra of two galaxies from the UW89 sample, Mrk 3 and NGC 788 (Moran et al. 2002). In most respects, these two AGNs are nearly identical: they have similar X-ray luminosities and absorption column densities; optically, their luminosities are comparable and both exhibit polarized broad emission lines; and both reside in S0 host galaxies at a distance of Mpc. However, as Figure 10 illustrates, a wide range of line strengths exists among “real” Seyfert 2s. Mrk 3 would be easily recognized as an AGN at moderate redshifts, whereas NGC 788 would not. The main difficulty with the deep X-ray survey results may lie with an expectation that the average Seyfert 2 resembles Mrk 3, when in fact NGC 788 is the more typical object.
References
- (1) Alexander, D. M., et al. 2003, AJ, 126, 539
- (2) Arnaud, K. 1996, in Astronomical Data Analysis Software and Systems V, ed. G. Jacoby & J. Barnes (San Francisco: ASP), 17
- (3) Awaki, H., Koyama, K., Inoue, H., & Halpern, J. P. 1991, PASJ, 43, 195
- (4) Barger, A. J., Cowie, L. L., Bautz, M. W., Brandt, W. N., Garmire, G. P., Hornschemeier, A. E., Ivison, R. J., & Owen, F. N. 2001b, AJ, 122, 2177
- (5) Barger, A. J., Cowie, L. L., Mushotzky, R. F., & Richards, E. A. 2001a, AJ, 121, 662
- (6) Barger, A. J., et al. 2002, AJ, 124, 1839
- (7) Barger, A. J., et al. 2003, AJ, 126, 632
- (8) Barger, A. J., et al. 2005, AJ, 129, 578
- (9) Bauer, F. E., et al. 2004, AJ, 128, 2048
- (10) Bessell, M. S. 1990, PASP, 102, 118
- (11) Bessell, M. S. 1995, PASP, 107, 672
- (12) Comastri, A., Setti, G., Zamorani, G. & Hasinger, G. 1995, A&A, 296, 1
- (13) Comastri, A., et al. 2002, ApJ, 571, 771
- (14) de Vaucouleurs, G., de Vaucouleurs, A., Corwin, H. G., Jr., Buta, R. J., Paturel, G., & Fouqué, P. 1991, Third Reference Catalog of Bright Galaxies, (New York: Springer-Verglag)
- (15) Fukugita, M., Shimasaku, K., & Ichikawa, T. 1995, PASP, 107, 945
- (16) Gil de Paz, A., et al. 2006, ApJS, in press (astro-ph/0606440)
- (17) Gilli, R., Salvati, M., & Hasinger, G. 2001, A&A, 366, 407
- (18) Ho, L. C., Filippenko, A. V., & Sargent, W. L. W. 1997, ApJS, 112, 315
- (19) Ho, L. C., & Ulvestad, J. S. 2001, ApJS, 133, 77
- (20) Hornschemeier, A. E., et al. 2001, ApJ, 554, 742
- (21) Hornschemeier, A. E., et al. 2003, AJ, 126, 575
- (22) Iwasawa, K., Fabian, A. C., & Matt, G. 1997, MNRAS, 289, 443
- (23) Kukula, M. J., Pedlar, A., Baum, S. A., & O’Dea, C. P. 1995, MNRAS, 276, 67
- (24) Landolt, A. U. 1983, AJ, 88, 439
- (25) Landolt, A. U. 1992, AJ, 104, 340
- (26) Lauberts, A., & Valentijn, E. A. 1989, The Surface Photometry Catalogue of the ESO-Uppsala Galaxies (Garching: European Southern Observatory)
- (27) Lumsden, S. L., & Alexander, D. M. 2001, MNRAS, 328, L32
- (28) Lumsden, S. L., Heisler, C. A., Bailey, J. A., Hough, J. H., & Young, S. 2001, MNRAS, 327, 459
- (29) Matt, G., et al. 1997, A&A, 325, L13
- (30) Moran, E. C., 2004, in Supermassive Black Holes in the Distant Universe, (Kluwer: Boston), ed. A. J. Barger, p. 225
- (31) Moran, E. C., Barth, A. J., Kay, L. E., & Filippenko, A. V. 2000, ApJ, 540, L73
- (32) Moran, E. C., Filippenko, A. V., & Chornock, R. 2002, ApJ, 579, L71
- (33) Moran, E. C., Kay, L. E., Davis, M., Filippenko, A. V., & Barth, A. J. 2001, ApJ, 556, L75
- (34) Mushotzky, R. F., Cowie, L. L., Barger, A. J., & Arnaud, K. A. 2000, Nature, 404, 459
- (35) Peterson, K. C., Gallagher, S. C., Hornschemeier, A. E., Muno, M. P., & Bullard, E. C. 2006, AJ, 131, 133
- (36) Rigby, J. E., Rieke, G. H., Donley, J. L., Alonso-Herrero, A., Pérez-González, P. G. 2006, ApJ, 647, 922
- (37) Sandage, A., & Tammann, G. A. 1981, Revised Shapley-Ames Catalog of Bright Galaxies, Carnegie Institution of Washington Publ. 635
- (38) Schlegel, D. J., Finkbeiner, D. P. & Davis, M. 1998, ApJ, 500, 525
- (39) Setti, G., & Woltjer, L. 1989, A&A, 224, L21
- (40) Stocke, J. T., et al. 1991, ApJS, 76, 813
- (41) Szokoly, G. P., et al. 2004, ApJS, 155, 271
- (42) Tran, H. D. 2001, ApJ, 554, L19
- (43) Ulvestad, J. S., & Wilson, A. S. 1989, ApJ, 343, 659
- (44) Yuan, F., & Narayan, R. 2004, ApJ, 612, 724
| Galaxy | |||||
|---|---|---|---|---|---|
| MCG 05-18-002 | 14.12 | 13.52 | 11.92 | 11.28 | 10.49 |
| MCG 01-27-020 | 14.82 | 14.83 | 14.08 | 13.65 | 13.05 |
| Mrk 3 | 13.88 | 13.60 | 12.39 | 11.64 | 10.96 |
| Mrk 1066 | 14.50 | 14.17 | 13.19 | 12.56 | 11.83 |
| NCG 262 | 13.68 | 13.67 | 12.84 | 12.28 | 11.72 |
| NCG 591 | 14.15 | 14.00 | 13.18 | 12.62 | 11.96 |
| NGC 788 | 13.45 | 13.02 | 12.05 | 11.50 | 10.80 |
| NGC 1358 | 13.50 | 13.06 | 12.09 | 11.48 | 10.83 |
| NGC 1667 | 12.90 | 12.79 | 12.03 | 11.46 | 10.82 |
| NGC 1685 | 14.58 | 14.29 | 13.40 | 12.73 | 12.16 |
| NGC 2110 | 14.50 | 13.22 | 11.83 | 11.06 | 10.18 |
| NGC 2273 | 12.86 | 12.65 | 11.64 | 11.02 | 10.31 |
| NGC 3081 | 13.22 | 12.96 | 12.05 | 11.51 | 10.87 |
| NGC 3982 | 12.10 | 12.18 | 11.59 | 11.14 | 10.57 |
| NGC 4117 | 14.09 | 13.84 | 13.00 | 12.43 | 11.78 |
| NGC 4388 | 11.86 | 11.72 | 10.96 | 10.45 | 9.76 |
| NGC 4941 | 12.03 | 12.06 | 11.15 | 10.60 | 9.86 |
| NGC 5347 | 13.23 | 13.17 | 12.46 | 11.93 | 11.14 |
| NGC 5695 | 13.82 | 13.49 | 12.66 | 12.09 | 11.31 |
| NGC 5929 | 12.76 | 12.99 | 12.05 | 11.45 | 10.72 |
| NGC 7672 | 14.95 | 14.76 | 13.94 | 13.40 | 12.50 |
Note. — Uncorrected for Galactic extinction.
| Galaxy | Lit. data/template | |||||
|---|---|---|---|---|---|---|
| IC 3639 | 13.34 | 13.01 | 12.23 | 11.87 | 11.22 | /Sbc |
| MCG 05-23-016 | 14.49 | 14.07 | 13.29 | 12.44 | 11.83 | /S0 |
| NCG 424 | 14.18 | 13.76 | 12.91 | 12.38 | 11.77 | /S0 |
| NGC 1068 | 9.70 | 9.61 | 8.87 | 8.31 | 7.66 | /Sab |
| NGC 1386 | 12.42 | 12.09 | 11.23 | 10.76 | 10.15 | /S0 |
| NGC 2992 | 13.54 | 13.14 | 12.18 | 11.62 | 10.97 | /S0 |
| NGC 3281 | 13.12 | 12.70 | 11.72 | 11.17 | 10.56 | /S0 |
| NGC 4507 | 13.05 | 12.92 | 12.07 | 11.70 | 11.05 | /Sab |
| NGC 5135 | 13.01 | 12.88 | 12.11 | 11.55 | 10.90 | /Sab |
| NGC 5283 | 14.53 | 14.20 | 13.42 | 12.86 | 12.21 | /Sab |
| NGC 5506 | 13.21 | 12.79 | 11.92 | 11.38 | 10.77 | /S0 |
| NGC 5643 | 10.89 | 10.74 | 10.00 | 9.48 | 8.87 | /Sbc |
| NGC 5728 | 12.70 | 12.37 | 11.59 | 11.03 | 10.38 | /Sab |
| NGC 6890 | 13.14 | 13.01 | 12.25 | 11.57 | 10.92 | /Sab |
| NGC 7172 | 13.24 | 12.85 | 11.91 | 11.15 | 10.54 | /S0 |
| NGC 7314 | 11.57 | 11.62 | 11.01 | 10.61 | 9.99 | /Sbc |
| NGC 7582 | 11.62 | 11.37 | 10.62 | 10.06 | 9.41 | /Sab |
Note. — Uncorrected for Galactic extinction.
| Galaxy | |||||
|---|---|---|---|---|---|
| IC 3639 | 12.96 | 12.71 | 12.00 | 11.69 | 11.09 |
| MCG 05-18-002 | 13.05 | 12.67 | 11.27 | 10.75 | 10.10 |
| MCG 05-23-016 | 13.90 | 13.60 | 12.93 | 12.15 | 11.62 |
| MCG 01-27-020 | 14.66 | 14.70 | 13.98 | 13.57 | 12.99 |
| Mrk 3 | 12.86 | 12.79 | 11.77 | 11.14 | 10.60 |
| Mrk 1066 | 13.79 | 13.60 | 12.75 | 12.21 | 11.57 |
| NCG 262 | 13.32 | 13.38 | 12.62 | 12.10 | 11.59 |
| NCG 424 | 14.10 | 13.69 | 12.86 | 12.34 | 11.74 |
| NCG 591 | 13.90 | 13.80 | 13.03 | 12.50 | 11.87 |
| NGC 788 | 13.30 | 12.91 | 11.96 | 11.43 | 10.75 |
| NGC 1068 | 9.52 | 9.47 | 8.76 | 8.22 | 7.60 |
| NGC 1358 | 13.16 | 12.79 | 11.88 | 11.31 | 10.71 |
| NGC 1386 | 12.35 | 12.04 | 11.19 | 10.73 | 10.13 |
| NGC 1667 | 12.46 | 12.45 | 11.76 | 11.24 | 10.67 |
| NGC 1685 | 14.27 | 14.05 | 13.21 | 12.58 | 12.05 |
| NGC 2110 | 12.46 | 11.60 | 10.56 | 10.06 | 9.45 |
| NGC 2273 | 12.41 | 12.30 | 11.37 | 10.81 | 10.15 |
| NGC 2992 | 13.21 | 12.88 | 11.98 | 11.46 | 10.85 |
| NGC 3081 | 12.92 | 12.72 | 11.87 | 11.37 | 10.77 |
| NGC 3281 | 12.60 | 12.29 | 11.40 | 10.91 | 10.37 |
| NGC 3982 | 12.02 | 12.12 | 11.55 | 11.11 | 10.54 |
| NGC 4117 | 14.02 | 13.79 | 12.95 | 12.39 | 11.75 |
| NGC 4388 | 11.68 | 11.58 | 10.85 | 10.36 | 9.69 |
| NGC 4507 | 12.52 | 12.50 | 11.75 | 11.44 | 10.86 |
| NGC 4941 | 11.83 | 11.90 | 11.03 | 10.51 | 9.79 |
| NGC 5135 | 12.69 | 12.62 | 11.91 | 11.39 | 10.78 |
| NGC 5283 | 13.98 | 13.76 | 13.08 | 12.59 | 12.01 |
| NGC 5347 | 13.11 | 13.08 | 12.45 | 11.87 | 11.09 |
| NGC 5506 | 12.89 | 12.53 | 11.72 | 11.22 | 10.65 |
| NGC 5643 | 9.97 | 10.01 | 9.44 | 9.03 | 8.54 |
| NGC 5695 | 13.73 | 13.41 | 12.60 | 12.05 | 11.28 |
| NGC 5728 | 12.59 | 12.28 | 11.52 | 10.98 | 10.34 |
| NGC 5929 | 12.63 | 12.89 | 11.97 | 11.38 | 10.67 |
| NGC 6890 | 12.92 | 12.84 | 12.12 | 11.46 | 10.84 |
| NGC 7172 | 13.10 | 12.74 | 11.82 | 11.08 | 10.49 |
| NGC 7314 | 11.45 | 11.53 | 10.94 | 10.55 | 9.95 |
| NGC 7582 | 11.54 | 11.31 | 10.57 | 10.02 | 9.38 |
| NGC 7672 | 14.56 | 14.45 | 13.70 | 13.21 | 12.36 |
| Galaxy | (Mpc) | EWKα | (0.5–2 keV) | (2–8 keV) | ||||||
|---|---|---|---|---|---|---|---|---|---|---|
| IC 3639 | 43.7 | 0 | 1.78 | 2.42E23 | 1.70 | … | … | … | 1.30E-13 | 2.43E-13 |
| MCG 05-18-002 | 23.1 | 0 | 1.78 | 2.42E23 | 1.70 | … | … | … | 2.07E-13 | 5.28E-13 |
| MCG 05-23-016 | 33.3 | … | … | 1.50E22 | 1.80 | 6.35 | 0.39 | 0.29 | 8.25E-12 | 7.21E-11 |
| MCG 01-27-020 | 46.8 | 0 | 1.78 | 2.42E23 | 1.70 | … | … | … | 3.40E-14 | 4.21E-13 |
| Mrk 3 | 54.0 | 0 | 2.05 | 4.74E23 | 1.83 | 6.31 | 0.10 | 0.73 | 8.26E-13 | 2.77E-12 |
| Mrk 1066 | 48.1 | 0 | 1.78 | 2.42E23 | 1.70 | … | … | … | 1.62E-13 | 3.92E-13 |
| NCG 262 | 60.1 | 0 | 1.77 | 1.77E23 | 1.77 | 6.16 | 0.10 | 0.14 | 1.38E-13 | 3.56E-12 |
| NCG 424 | 46.6 | 0 | 1.61 | 2.42E23 | 1.61 | 6.41 | 0.10 | 1.49 | 2.14E-13 | 1.04E-12 |
| NCG 591 | 60.7 | 0 | 1.78 | 2.42E23 | 1.70 | … | … | … | 3.76E-14 | 2.90E-13 |
| NGC 788 | 54.4 | 0 | 1.15 | 4.80E23 | 1.67 | 6.23 | 0.24 | 0.39 | 8.13E-14 | 3.48E-12 |
| NGC 1068 | 14.4 | 2.90E21 | 5.59 | 3.16E21 | 1.28 | 6.52 | 0.30 | 3.26 | 1.02E-11 | 5.19E-12 |
| NGC 1358 | 53.8 | 0 | 1.78 | 2.42E23 | 1.70 | … | … | … | 5.14E-14 | 4.27E-13 |
| NGC 1386 | 16.9 | 2.04E21 | 3.47 | 1.94E23 | 1.96 | 6.40 | 0.10 | 0 | 4.90E-13 | 4.46E-13 |
| NGC 1667 | 60.7 | 0 | 1.78 | 2.42E23 | 1.70 | … | … | … | 2.81E-14 | 1.27E-13 |
| NGC 1685 | 60.4 | 0 | 1.78 | 2.42E23 | 1.70 | … | … | … | 3.38E-14 | 8.31E-14 |
| NGC 2110 | 29.1 | 5.80E20 | 1.61 | 3.61E22 | 1.61 | 6.26 | 0.51 | 0.41 | 1.20E-12 | 2.39E-11 |
| NGC 2273 | 28.4 | 0 | 1.95 | 4.41E23 | 1.95 | 6.36 | 0.11 | 1.38 | 2.25E-13 | 9.69E-13 |
| NGC 2992 | 30.5 | 0 | 4.58 | 9.74E21 | 1.61 | 6.46 | 0.47 | 1.59 | 1.30E-12 | 3.99E-12 |
| NGC 3081 | 32.5 | 0 | 2.01 | 5.36E23 | 1.58 | 6.22 | 0.13 | 0.41 | 2.12E-13 | 3.75E-12 |
| NGC 3281 | 42.7 | 0 | 1.85 | 6.02E23 | 1.64 | 6.30 | 0.10 | 0.99 | 2.72E-13 | 2.25E-12 |
| NGC 3982 | 27.2 | 0 | 1.78 | 2.42E23 | 1.70 | … | … | … | 1.03E-13 | 3.22E-13 |
| NGC 4117 | 17.0 | 2.21E21 | 1.60 | 3.99E23 | 1.60 | 6.43 | 0.10 | 0.11 | 7.62E-14 | 1.31E-12 |
| NGC 4388 | 16.8 | 0 | 1.50 | 3.98E23 | 1.96 | 6.34 | 0.16 | 0.62 | 5.41E-13 | 4.86E-12 |
| NGC 4507 | 47.2 | 0 | 1.78 | 3.02E23 | 1.53 | 6.23 | 0.23 | 0.30 | 5.41E-13 | 1.73E-11 |
| NGC 4941 | 6.4 | 1.18E21 | 1.61 | 9.13E23 | 1.61 | 6.35 | 0.10 | 0.64 | 1.08E-13 | 8.26E-13 |
| NGC 5135 | 54.9 | 0 | 2.88 | 3.84E23 | 1.80 | 6.34 | 0.10 | 1.44 | 5.36E-13 | 4.65E-13 |
| NGC 5283 | 41.4 | 1.10E21 | 3.28 | 1.06E23 | 1.60 | 6.40 | 0.10 | 0 | 3.91E-14 | 1.14E-12 |
| NGC 5347 | 36.7 | 0 | 1.78 | 2.42E23 | 1.70 | … | … | … | 5.16E-14 | 1.94E-13 |
| NGC 5506 | 28.7 | 1.11E21 | 2.20 | 3.02E22 | 1.82 | 6.39 | 0.23 | 0.22 | 3.81E-12 | 6.03E-11 |
| NGC 5643 | 16.9 | 0 | 1.90 | 1.76E23 | 1.64 | 6.34 | 0.10 | 2.73 | 4.49E-13 | 1.12E-12 |
| NGC 5695 | 56.4 | 0 | 1.78 | 2.42E23 | 1.70 | … | … | … | 5.05E-14 | 1.23E-13 |
| NGC 5728 | 42.2 | 3.63E20 | 2.07 | 7.17E23 | 1.67 | 6.33 | 0.10 | 1.12 | 9.22E-14 | 1.00E-12 |
| NGC 5929 | 38.5 | 5.16E21 | 1.70 | 2.77E23 | 1.70 | 6.19 | 0.10 | 0.35 | 8.06E-14 | 1.40E-12 |
| NGC 6890 | 31.8 | 0 | 1.78 | 2.42E23 | 1.70 | … | … | … | 3.99E-14 | 1.69E-13 |
| NGC 7172 | 33.9 | 0 | 1.69 | 9.62E22 | 1.82 | 6.44 | 0.10 | 0.20 | 1.93E-13 | 1.01E-11 |
| NGC 7314 | 18.3 | … | … | 7.62E21 | 1.95 | 6.24 | 0.77 | 0.45 | 8.36E-12 | 3.42E-11 |
| NGC 7582 | 17.6 | 0 | 1.68 | 1.23E23 | 1.82 | 6.24 | 0.10 | 0.18 | 4.51E-13 | 1.23E-11 |
| NGC 7672 | 53.5 | 0 | 1.78 | 2.42E23 | 1.70 | … | … | … | 4.80E-14 | 9.08E-14 |
Note. — Column densities () are in units of atoms cm-2. Iron line centroids (), energy widths (), and equivalent widths (EWKα) are all in units of keV. Fluxes are in units of erg cm-2 s-1.
| Galaxy | |
|---|---|
| MCG 05-23-016 | 0.45 |
| Mrk 3 | 0.97 |
| NCG 262 | 0.79 |
| NCG 424 | 0.33 |
| NCG 788 | 0.76 |
| NCG 2110 | 0.80 |
| NCG 2992 | 0.39 |
| NCG 3081 | 0.57 |
| NCG 3281 | 0.43 |
| NCG 4388 | 0.28 |
| NCG 4507 | 0.86 |
| NCG 5283 | 0.91 |
| NCG 5506 | 0.32 |
| NCG 5728 | 0.74 |
| NCG 5929 | 0.78 |
| NCG 7172 | 0.52 |
| NCG 7314 | 0.39 |
| NCG 7582 | 0.46 |
Note. — Galaxies included here are those that would be detected as absorbed AGNs in the CDF-S at . NGC 5929 is interacting with NGC 5920; the axis ratio listed is for NGC 5929 alone.