Semi-Empirical Cepheid Period-Luminosity Relations in Sloan Magnitudes
Abstract
In this paper we derive semi-empirical Cepheid period-luminosity (P-L) relations in the Sloan magnitudes by combining the observed mean magnitudes from the Large Magellanic Cloud Cepheids (LMC) and theoretical bolometric corrections. We also constructed empirical band P-L relations, using the publicly available Johnson-Sloan photometric transformations, to be compared with our semi-empirical P-L relations. These two sets of P-L relations are consistent with each other.
Subject headings:
Cepheids — distance scale1. Introduction
The Cepheid period-luminosity (P-L) relation is a fundamental tool in distance scale and stellar pulsation studies, which is traditionally studied in the standard Johnson-Cousin magnitude system. However, the magnitude system from the broad band filters employed in the Sloan Digital Sky Survey (SDSS, hereafter Sloan magnitudes) are becoming more popular in current and future studies. For example, observations with the Canada-France-Hawaii Telescope (CFHT), the Pan-STARRS111http://pan-starrs.ifa.hawaii.edu/public/home.html (Kaiser, 2004), the Dark Energy Survey222https://www.darkenergysurvey.org/ (DES Collaboration, 2005), the Large Synoptic Survey Telescope333http://www.lsst.org/lsst_home.shtml (LSST, Tyson, 2002), to name a few, will be done in the Sloan filters. In addition to wide field imaging, many of these surveys will include a time-domain component to detect asteroids and supernovae. Therefore, it is possible that a large number of variable stars, including Cepheids, will be observed and/or detected from these surveys. The purpose of this paper is to provide semi-empirical Cepheid P-L relations in the Sloan magnitudes for current and future Cepheid and distance scale studies (for example, the M33 Cepheids observed with CFHT as presented in Hartman et al. 2006).
2. Data, Method and Results
Since the Large Magellanic Cloud (LMC) Cepheid P-L relation is extensively used in distance scale studies, we use the publicly available LMC Cepheid data from the OGLE (Optical Gravitational Lensing Experiment, Udalski et al., 1999) database in this paper. The logarithmic periods, the extinction corrected band mean magnitudes and the extinction corrected colors for the fundamental mode LMC Cepheids were obtained from the OGLE database. We first remove Cepheids without a color in the OGLE sample. The remaining OGLE LMC Cepheids were then cross-correlated with the sample given in Kanbur & Ngeow (2006) to remove outliers and “bad” Cepheids in our OGLE sample. Additional LMC Cepheids data are supplemented from table 1 of Sandage et al. (2004). However we only include Cepheids with (where is pulsation period in days, see Kanbur & Ngeow 2006 for detailing why Cepheids are restricted to this range). Our final sample consists of LMC Cepheids with band photometric data, of them having periods less than 10 days. From our sample, the fitted linear LMC P-L relations are:
| (1) | |||||
| (2) |
with dispersion of and in and band, respectively. For completeness, we also include the band P-L relation from the Cepheids in our sample that have the band mean magnitudes (because the number of Cepheids with colors is less than those with colors in Sandage et al. 2004 sample):
| (3) |
with dispersion of . These P-L relations are in good agreement with the results presented by the OGLE team444ftp://sirius.astrouw.edu.pl/ogle/ogle2/var_stars/lmc/cep/
catalog/README.PL, Sandage et al. (2004) and Kanbur & Ngeow (2006).
It is possible to derive semi-empirical P-L relations in the Sloan magnitudes by combining the LMC Cepheid data with theoretical bolometric corrections (). In this paper we use the theoretical from the Padova group (Girardi et al., 2002, 2004), which are tabulated in grids with different metallicity, effective temperature () and surface gravity (). We first selected the within the grids of and , which are appropriate for classical Cepheids at mean light, from all of the available metallicity () given by the Padova group. To obtain the for LMC Cepheids at , these grids of were then interpolated using the available metallicity. From the interpolated , we obtain a regression between , and color in the form of:
| (4) | |||||
which has a dispersion of . Similarly, regressions for in passband takes the form of , where . The coefficients in Johnson-Cousin and Sloan passbands are given in Table 1.
| 0.057 | ||||||
| 0.012 | ||||||
| 0.009 | ||||||
| 0.112 | ||||||
| 0.036 | ||||||
| 0.006 | ||||||
| 0.011 | ||||||
| 0.004 |
Note. — is the dispersion of the regression.
For each of the LMC Cepheids in our sample, the surface gravity can be estimated using (Kovács, 2000; Beaulieu et al., 2001). Then the and the for our LMC Cepheids can be determined using the regressions we found previously. By combining the definitions of bolometric correction () and distance modulus (), we have . Then for each of the individual LMC Cepheids in our sample, is a constant and independent of passband. This quantity can be estimated using either or with available mean magnitudes, or using either or with available mean magnitudes. The mean difference between and for our LMC Cepheids is mag. with a standard deviation of mag., while the difference for and is mag. with a larger standard deviation of mag. For the LMC Cepheids in our sample, we adopt the averaged value of if all three band data are available for a given Cepheid, else we use as the averaged value from and bands. Once the values of and the in Sloan magnitudes are known for each Cepheid in the sample, the apparent Sloan magnitudes can be estimated by and the P-L relations can be derived.
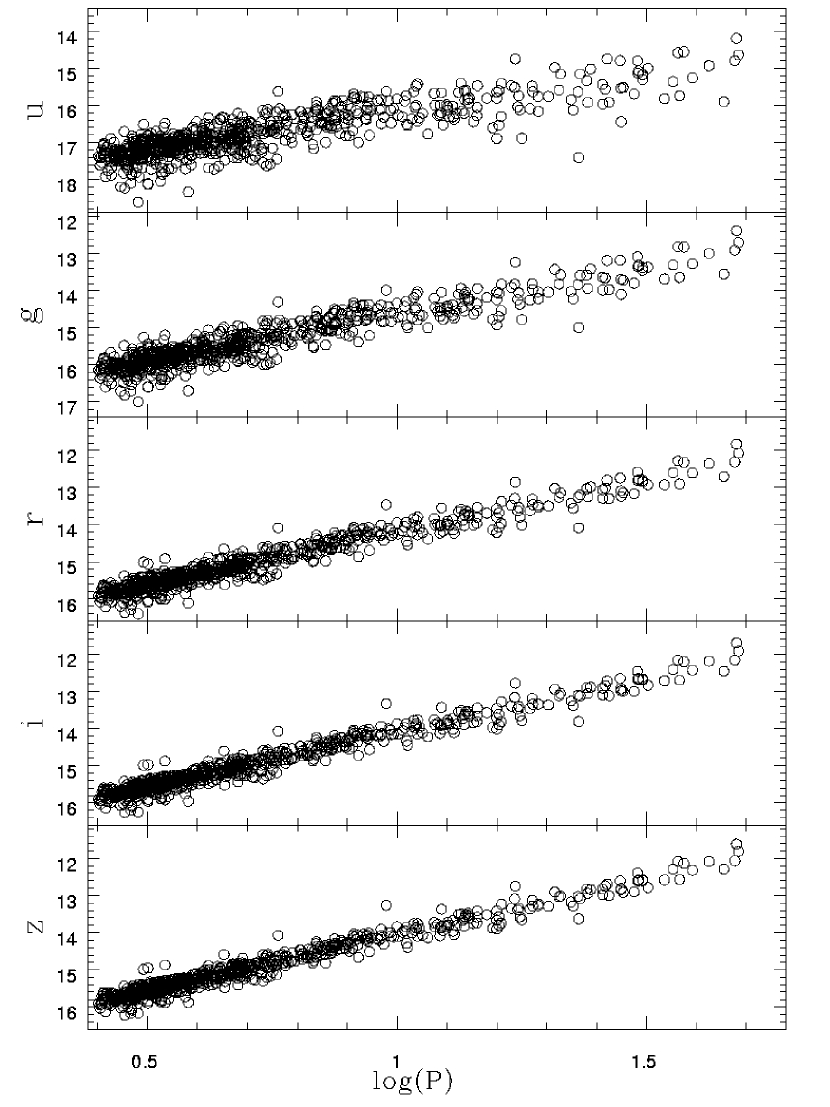
To test the above semi-empirical approach, we assume that only the LMC band data are available for the Cepheids and derive the semi-empirical band P-L relation. Using , the resulting semi-empirical band P-L relation is: with a dispersion of . Doing the same for the band data, the semi-empirical band P-L relation is: with a dispersion of . Both of the semi-empirical P-L relations are in good agreement with equation (1) & (2): the difference in the slope is less than mag. and the zero-points are almost identical in both passbands. For testing the semi-empirical band P-L relation, we use both of the and band mean magnitudes and for the common Cepheids to derive equation (3), and the resulted semi-empirical band P-L relation is: with a dispersion of , which is still in good agreement with equation (3). Therefore, the above semi-empirical approach can be used to derive P-L relations in Sloan magnitudes, which we summarize in Table 2. The plots of these P-L relations are presented in Figure 1. Note that the dispersion of the P-L relation decreases from to passbands. This reduction of the dispersion as wavelength increases is well-known in the Cepheid community (see, for example, Madore & Freedman, 1991).
| Slope | Zero-Point | ||
|---|---|---|---|
| 0.338 | |||
| 0.262 | |||
| 0.193 | |||
| 0.171 | |||
| 0.160 |
Note. — is the dispersion of the P-L relation.
3. A Sanity Check: Empirical P-L Relations from Photometric Transformations
The Johnson-Sloan photometric transformations that are available in the literature can be used to transform the mean magnitudes for our LMC Cepheids to the Sloan magnitudes. The transformation for magnitudes (from the United States Naval Observatory 40-inch telescope) are availale, for example, in Fukugita et al. (1996), Smith et al. (2002) and Rodgers et al. (2006); while the transformation for magnitudes (from the SDSS 2.5-meter telescope) are given in Bilir et al. (2005), Jester et al. (2005) and Jordi et al. (2006). These transformations in general take the form of , where , for the color. Therefore the observed band mean magnitudes and colors for the LMC Cepheids can be transformed to the Sloan magnitudes, and the P-L relations can be fitted in these passbands. This serves as an independent check to our results presented in the previous section. In this paper we apply the transformation from Jester et al. (2005) only, but the resulting P-L relations from other transformations are available upon request. Using Jester et al. (2005) transformation, we obtain: with a dispersion of and with a dispersion of , which are in good agreement to the P-L relations given in Table 2.
However, there is a major drawback to using the Johnson-Sloan photometric transformation to obtain the empirical P-L relations. The empirical Johnson-Sloan photometric transformations available in the literature are mostly derived from the standard stars, which could span a wide range of luminosity class (Smith et al., 2002; Rodgers et al., 2006), effective temperature and/or metallicity (which could be close to the Solar value, Jordi et al., 2006). On the other hand, Cepheids are cool supergiants with spectral type from to . Therefore the photometric transformations may not be applicable to the LMC Cepheids555We thank J. Hartman & D. Bersier for pointing this out.. To test this, we use the same theoretical bolometric corrections in Section 2 to obtain the theoretical Johnson-Sloan transformation for two “extreme” cases:

-
Case 1: We use the grids of with and , which are appropriate for Cepheids at mean light with metallicity , to represent the LMC Cepheids.
-
Case 2: We use the grids of with and , to represent the standard stars that cover a wide range of effective temperature and surface gravity, and metallicity of and which roughly bracket the Solar metallicity and LMC-type metallicity. Figure 2 compares the grids of theoretical colors with the colors of standard stars, which shows that the theoretical colors are well covered by the observation of standard stars.
The Johnson-Sloan transformations are then derived from these grids of theoretical colors. After obtaining the transformations for the two cases as mentioned, we transform our LMC Cepheid data to the Sloan magnitudes and fit the linear P-L relations. The differences () of the slope from the fitted P-L relations for these two cases are: and ; while the difference for the zero-point are: and . The small differences between the P-L relations of Case 1 and Case 2 implies that the derived P-L relation in the Sloan magnitudes, at least in the passbands, will be insensitive to the adopted transformations. Therefore, we believe the adopted transformations from the literature should not significantly affect the empirical P-L relations. The work for verifying the transformations for Cepheids in a more proper and rigorous way is currently underway with Cepheids in M33 by Bersier et al. (in preparation – private communication).
4. Conclusion
Using the observed mean magnitudes from LMC Cepheids and the theoretical bolometric corrections from Padova group, we derive semi-empirical Cepheid P-L relations in the Sloan magnitudes that can be used in the current and future distance scale and Cepheid works. For a sanity check, we compare the band P-L relations derived from adopting the available Johnson-Sloan photometric transformation in the literature to our semi-empirical P-L relations. The resulting comparison finds that these two sets of P-L relation are generally consistent with each other.
References
- Beaulieu et al. (2001) Beaulieu, J. P., Buchler, J. R. & Kolláth, Z., 2001, A&A, 373, 164
- Bilir et al. (2005) Bilir, S., Karaali, S.& Tuncel, S., 2005, Astron. Nachr., 326, 321
- DES Collaboration (2005) The Dark Energy Survey Collaboration, 2005, astro-ph/0510346
- Fukugita et al. (1996) Fukugita, M., Ichikawa, T., Gunn, J. E., Doi, M., Shimasaku, K. & Schneider, D. P., 1996, PASP, 111, 1748
- Girardi et al. (2002) Girardi, L., Bertelli, G., Bressan, A., Chiosi, C., Groenewegen, M. A. T., Marigo, P., Salasnich, B. & Weiss, A., 2002, A&A, 391, 195
- Girardi et al. (2004) Girardi, L., Grebel, E. K., Odenkirchen, M. & Chiosi, C., 2004, A&A, 422, 205
- Hartman et al. (2006) Hartman, J. D., Bersier, D., Stanek, K. Z., et al., 2006, MNRAS, 371, 1405
- Jester et al. (2005) Jester, S., Schneider, D. P., Richards, G., et al., 2005, AJ, 130, 873
- Jordi et al. (2006) Jordi, K., Grebel, E. K. & Ammon, K., 2006, A&A, 460, 339
- Kaiser (2004) Kaiser, N., 2004, in Ground-based Telescopes, Edited by Oschmann, Jacobus M., Jr., Proceedings of the SPIE, Volume 5489, pp. 11
- Kanbur & Ngeow (2006) Kanbur, S. & Ngeow, C., 2006, MNRAS, 369, 705
- Kovács (2000) Kovács, G., 2000, A&A, 360, L1
- Madore & Freedman (1991) Madore, B. & Freedman, W., 1991, PASP, 103, 933
- Rodgers et al. (2006) Rodgers, C. T., Canterna, R., Smith, J. A., Pierce, M. J. & Tucker, D., 2006, AJ, 132, 989
- Sandage et al. (2004) Sandage, A., Tammann, G. A. & Reindl, B., 2004, A&A, 424, 43
- Smith et al. (2002) Smith, J. Allyn, Tucker, D. L., Kent, S., et al., 2002, AJ, 123, 2121
- Tyson (2002) Tyson, J. A., 2002, in Survey and Other Telescope Technologies and Discoveries, Edited by Tyson, J. Anthony., Proceedings of the SPIE, Volume 4836, pp. 10
- Udalski et al. (1999) Udaski, A., Soszynski, I., Szymanski, M., Kubiak, M., Pietrzynski, G., Wozniak, P. & Zebrun, K., 1999, Acta Astron., 49, 223