Weather induced effects on extensive air showers observed with the surface detector of the Pierre Auger Observatory
Abstract
The rate of events measured with the surface detector of the Pierre Auger Observatory is found to be modulated by the weather conditions. This effect is due to the increasing amount of matter traversed by a shower as the ground pressure increases and to the inverse proportionality of the Molière radius to the air density near ground. Air-shower simulations with different realistic profiles of the atmosphere support this interpretation of the observed effects.
1 Introduction
The surface detector (SD) of the Auger Southern Observatory, located in
Malargüe, Argentina, is designed for the detection of ultra high energy
cosmic rays through the measurement of the signal induced by the shower
particles reaching the observation level ( 880 g cm-2) in an array
of water-Cherenkov tanks arranged in a triangular grid with 1500 m spacing.
The regular data taking of the SD started in January 2004, with the array
continuosly growing from 100 stations up to the current 1200. To check the
detector stability we monitored the shower counting rate, finding that it is
modulated by weather effects. This dependence is expected since changes in the
atmospheric density profile due to weather variations influence the development
of the air shower and in turn the amplitude of the signal measured at ground.
As a consequence, a study of the detector stability has to account for the rate
dependence on the atmospheric conditions.
Moreover, since the SD estimate of the energy of the primary particle is based
on , the signal measured at 1000 m from the shower axis, we are
interested in the dependence of on the atmospheric conditions.
This requires a continuous monitoring of the weather and a good knowledge of
the relationship between and the measured weather parameters. The
former is provided by a meteorological station, at the centre of the SD array,
that records the weather parameters every 5 min, allowing the correlation of
the modulation of observed quantities, such as the rate of events, with the
measured ground temperature and pressure .
2 Weather effects on EAS
The expected effects related to the change of weather conditions are essentially two:
(i) an increase in the ground pressure corresponds to an increased slant depth and implies that the shower is older when it reaches the ground level.
The longitudinal development of the electromagnetic component of the shower at 1 km from the core can be parameterised as a Gaisser-Hillas profile, , where is the average maximum of the shower at 1 km from the core ( 200 g cm-2 deeper than at the core) and g cm-2 is an effective hadronic attenuation length. Then, under a pressure change, the electromagnetic component of changes by
| (1) |
where d was used. Since for the energies of
interest, eV, the maximum of vertical showers is close to ground,
this effect is expected to be more pronounced for inclined showers.
(ii) an increase in the air density reduces the Molière radius
(proportional to ) and hence the lateral extent of the electromagnetic
component of the shower. The lateral distribution of the electromagnetic
component can be approximately described with an NKG profile, which for large
radius from the core behaves as
, where and
.
Hence, under a density change
| (2) |
The effective value of is that corresponding to the air density two cascade units above ground [6] ( at the Auger site, with being the zenith angle). Since the ground , are the only available observables, we have to express in terms of the density measured at ground.
On time scales of one day or more, the temperature gradient in the lowest layers of the atmosphere (the planetary boundary layer) can be described by an average value of C km-1; therefore the variation of is the same as that of . An additional effect is related to the diurnal variations of the gradient that is smaller before sunrise, at which time even inversions are common, and larger in the early afternoon hours. As a result, the amplitude of diurnal variations in (and ) is smaller at 2 cu than at ground level by a factor . We define the average daily densities and and the reference values (averaged over 2 years of measurements) kg m-3 and hPa, denotes the reference density at 2 cu above ground. The energy reconstructed with no correction for weather effects is , where [1]. Hence we can parameterise the relation between the shower energy at the reference weather conditions and the reconstructed one as:
| (3) | |||||
where the coefficients and depend on the zenith
angle .
Assuming that the cosmic ray spectrum is a pure power law d, it is easy to show that the rate of events at
a given zenith angle can be expressed as:
| (4) | |||||
with and coefficients and , the latter describing the diurnal modulation of the rate with the density.
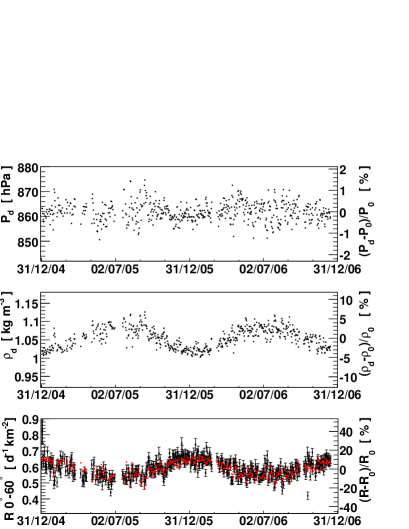
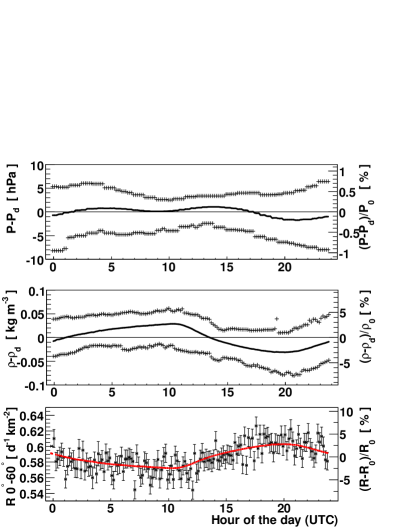
3 Modulation of the measured rates of events
To study the modulation of the event rate with the ground weather parameters, we use the data taken from 1 January 2005 to 31 December 2006 that have a zenith angle . The data selection criterion is the same as applied for the SD spectrum [1]. The value of the air density at ground is deduced from and measured at the central meteorological station. Rather than using the raw number of triggering events, we compute the rates, as a function of time, to account for the temporal variation of the active detection area due mainly to the deployment of new stations and occasionally to stations experiencing a temporary failure [3]. The modulation of the rate during the year, and as a function of the hour of the day, follows the changes in density and pressure (Figs. 1 and 2). A characteristic of the Malargüe site is the stability of pressure (less than 2% variation), while changes up to a maximum of 6% during the year with an additional diurnal variation of density of 2% on average, with maximum values of % during the two years considered. Assuming that the rates computed each hour follow a Poisson distribution, a maximum likelihood fit gives the estimated values of the coefficients in eq. (4) averaged over the event distribution in the zenith range :
| (5) | |||||
4 Comparison of the experimental results with model and simulations
To test the validity of our interpretation, we compare the coefficients
obtained from the fit of data with results from full shower simulations and
the predictions on theoretical grounds.
The Corsika code [5] with the QGSjetII model
[7] for high energy hadronic interactions, was used to
simulate a set of proton showers at eV in 5 different atmospheres and
at various zenith angles.
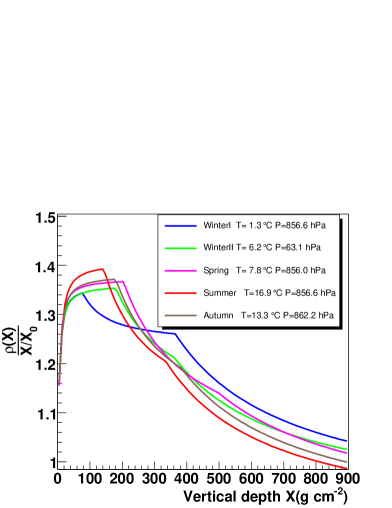
The atmospheric profiles used (Fig. 3) are a
parameterisation of the seasonal averages of several radio soundings carried
out at the detector site [4] and provide a sample of
realistic conditions above the Auger SD array, but, being averages on large
time scales, do not account for the diurnal variation of the temperature in
the lower atmosphere.
The expected signal is estimated through the simplified assumptions
that , and photons deposit all their energy in the surface
detector, while for muons we take the minimum between the kinetic energy and
240 MeV (the energy deposited by a vertical muon crossing a SD tank). As
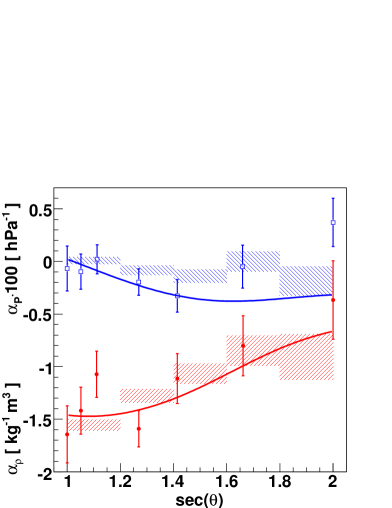
expected, the simulated signal depends on the ground density and pressure
according to the expression in eq. (3) (with )
with coefficients and shown in
Fig. 4 for all zenith angles between 0∘ and
60∘. The large uncertainties are due to the limited number of
atmospheric profiles used.
For the theoretical expectations, we consider the variation of the total
signal, given by the sum of the electromagnetic and muonic component. The
coefficients in (3) result from the variation
of both components: , where is
the electromagnetic fraction at 1 km.
The dependence of on and is discussed in section 2. For a
quantitative prediction we adopt in eq. (1) g cm-2, typical of 10 EeV proton showers, and g cm-2. For the electromagnetic fraction we use a
fit to the results of shower simulations with 10 EeV protons ( near the vertical and decreasing with to reach at ).
We assume a negligible correlation of with pressure and a
constant value kg-1 m3 for the dependence
on density (suggested by the results of simulations).
In Fig. 4 we compare the coefficients obtained by fitting
the data in five zenith ranges. The procedure to obtain is the
same described in section 3, then we derive the signal coefficients
dividing by . Their values are in good
agreement with both the model predictions and the results from
simulations.
5 Conclusions
The modulation of the event rates measured by the Auger SD can be explained by known effects on the shower development, both on seasonal and diurnal scales. At the Auger site the dominant effect is related to the density (temperature) variation. The systematic error, when determining the energy of a single shower in the zenith range , amounts to a maximum of (for extreme values of ground pressure and temperature). The quantitative agreement of the theoretical model with simulations and data, suggests that it can be used to correct the SD energy reconstruction for weather induced effects.
References
- [1] M. Roth [Pierre Auger Collaboration], these proceedings (#313).
- [2] M. Unger [Pierre Auger Collaboration], these proceedings (#594).
- [3] T. Suomijarvi [Pierre Auger Collaboration], these proceedings (#299).
- [4] B. Keilhauer et al., Astropart. Phys. 22 (2004), 249.
- [5] D. Heck et al., Report FZKA 6019 (1998).
- [6] K. Greisen, Progress in Cosmic Ray Physics III (1956), 3.
- [7] S. S. Ostapchenko, Nucl. Phys. B (Proc. Suppl.) 151 (2006), 143 and 147.