11email: bonnetbidaud@cea.fr 22institutetext: INAF–Osservatorio Astronomico di Capodimonte, Via Moiariello 16, I-80131 Napoli, Italy
22email: demartino@na.astro.it 33institutetext: APC, UMR 7164, University Denis Diderot, 2 place Jussieu, F-75005 and LUTH, Observatoire de Paris, F-92195 Meudon Cedex, France
33email: martine.mouchet@obspm.fr 44institutetext: INAF–Istituto di Astrofisica Spaziale di Bologna, Via Gobetti 101, I-40129 Bologna, Italy
44email: masetti@iasfbo.inaf.it
IGR J00234+6141 : a new INTEGRAL source identified as an Intermediate polar ††thanks: Based on observations obtained at the Haute-Provence Observatory (France) and at the Loiano Observatory (Italy) operated by the Istituto Nazionale di Astrofisica.
Abstract
Context. Following an extensive survey of the galactic plane by the INTEGRAL satellite, new hard X-ray sources are discovered with a significant fraction of Cataclysmic Variables (CVs) among them.
Aims. We report here the identification of one of these hard X-ray sources, IGR J00234+6141, as an accreting magnetic white dwarf of intermediate polar type.
Methods. We analyse the high energy emission of the INTEGRAL source using all available data and provide complementary optical photometric and spectroscopic data obtained respectively in August and October 2006.
Results. Based on a refined INTEGRAL position, we confirm the proposed optical identification. We clearly detect the presence of a 564 s periodic optical modulation that we identify as the rotation of the white dwarf. The analysis of the optical spectrum also demonstrates that the emission lines show a modulation in radial velocity with an orbital period of hr.
Conclusions. The two periodicities indicate that IGR J00234+6141 is a magnetic CV of the intermediate polar type. This is one of the faintest and hardest sources of this type detected by INTEGRAL. This confirms earlier conclusions that IPs contribute significantly to the population of galactic X-ray sources and represent a significant fraction of the high energy background.
Key Words.:
stars:binaries:close – stars:individual:IGR J00234+6141 – stars:white dwarf, cataclysmic variables1 Introduction
The first complete galactic plane scan by the INTEGRAL satellite at energy above 20 keV has shown that Cataclysmic Variables (CVs) constitute a significant fraction of the galactic high energy emission.
The 2nd INTEGRAL source catalogue, from a 10 Ms dataset (Bird et al. 2006), lists 8 confirmed CVs out of a total of 209 detected sources, amounting therefore to 4% of the catalogue. The last more sensitive survey, based on a 40 Ms exposure time (Bird et al. 2007), has increased the catalog to 421 sources and more than doubled the total number of CVs (21), increasing their fraction to 5%.
Most of the identified high energy CVs are Intermediate Polars (IPs) i.e. accreting magnetic white dwarfs with intermediate (-G) magnetic fields.
Though the standard accretion column model predicts high energy emission of magnetic CVs (mCVs) (Aizu 1973) , only few sources have been studied above 20 keV (Matt et al. 2000; de Martino et al. 2001, 2004; Falanga et al. 2005).
In the strongly magnetized (BG) polar systems, cyclotron cooling is an important mechanism to suppress the bremsstrahlung high temperature emission whilst it should be negligible among IPs. This could explain why most hard X-ray CVs are IPs. However there is so far no clear explanation of the high temperature achieved in some cases and this remains an open problem until a detailed characterization of each of these high energy CVs is obtained. Here we report on the identification of one of the very few CVs discovered by its high energy emission.
IGR J00234+6141 was first discovered from the INTEGRAL deep survey
in the Cas-A region (den Hartog et al. 2006).
From a 1.6 Ms exposure, a weak ( mCrab) source was detected in the (20-50 keV) band with
significant flux detected up to 100 keV. The best source position was provided with an estimated
3′ accuracy, marginally consistent with a ROSAT soft X-ray counterpart,
1RXS J002258.3+614111, suggesting an X-ray binary (den Hartog et al. 2006).
Optical investigation of the much smaller (10″) ROSAT error box led to the identification of a (R 16.5) object showing strong emission lines of the Balmer series typical of cataclysmic variables (Halpern & Mirabal 2006; Bikmaev et al. 2006; Masetti et al. 2006).
From a preliminary short 2 hr photometric R-band observation, the presence of a possible 570 s periodic modulation was also reported suggesting a rotating white dwarf (Bikmaev et al. 2006).
We present here the first detailed photometric and spectroscopic observations leading to the secure identification of the source as an Intermediate polar.
2 INTEGRAL analysis
The INTEGRAL (Winkler et al. 2003) high energy emission (20–100 keV) of IGR J00234+6141 was analyzed using all publicly-available IBIS/ISGRI (Ubertini et al. 2003; Lebrun et al. 2003) data from March 2003 to October 2006. The data were collected for all ISGRI pointings within for a total effective exposure Ms. To study the weak persistent X-ray emission, the ISGRI (20–100 keV) spectrum has been extracted from the mosaic images in four energy bands (20-28 keV), (28-40 keV), (40-57 keV) and (57-80 keV). The data reduction was performed using the standard Offline Science Analysis (OSA) software version 5.1.
2.1 Source position
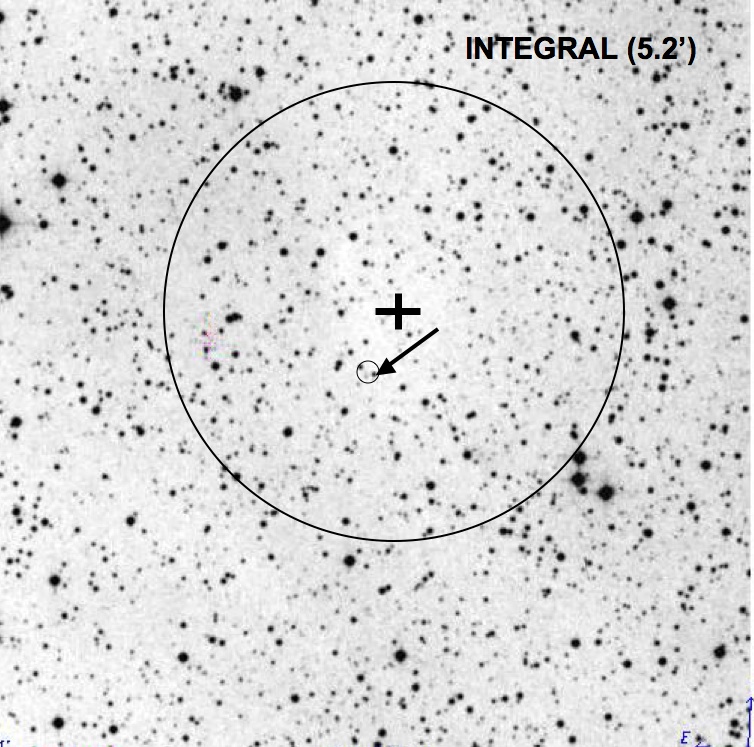
The source is clearly detected in all energy bands with a maximum significance of 6.8 in the (28-40 keV) band and a total (20-80 keV) significance of 8.9 . Based on the total exposure of Ms, the best position is determined to be (J2000) with a 90% accuracy of 5.2′. This is consistent with the position derived in the third INTEGRAL catalogue from a lower 1.8 Ms exposure (Bird et al. 2007). The INTEGRAL position is now in better agreement with the proposed optical counterpart than the first determination by den Hartog et al. (2006), reducing the separation from 3.2′ to 1.3′ (see Fig. 1).
We also note that contrary to what was reported by Bikmaev et al. (2006, see their Fig. 6) the position of the ROSAT source, 1RXS J002258.3+614111, is fully consistent with the optical counterpart with an error circle much smaller than shown by the authors and an X-optical separation less than 6.1″. The identification of IGR J00234+6141with both the soft X-ray source and the optical star is therefore quite secure.

2.2 Source spectrum
Spectral analysis was performed with XSPEC version 12.0 (Arnaud 1996; Dorman et al. 2003). A systematic error of 2% was applied to the ISGRI spectrum, which corresponds to the current uncertainties in the response matrix. All uncertainties in the spectral parameters are given at a 90% confidence level for single parameters. We first fit the spectrum using a simple power-law model which gives a fit with , and the power-law index is determined to be . A better fit was found with a bremsstrahlung model more commonly used for CVs, this gave a , with a bremsstrahlung temperature keV. The flux in the (20–100 keV) range is erg cm-2 s-1. In Fig. 2, we show the unfolded spectrum and the residuals of the data to the bremsstrahlung model.
We find significant differences with the source parameters published from a smaller dataset by Barlow et al. (2006), with a factor 2 higher bremsstrahlung temperature and with a factor 1.3 lower flux. But our reduced is much more consistent than the one quoted by these authors (). For the energy band (20-40 keV), we also have a higher significance of ( for Barlow et al. 2006) that can be explained since we used only the pointings where the source was within , therefore increasing the S/N.
3 Photometric observations
IGR J00234+6141 was observed on August 26 and 27, 2006
at the 1.5 m Loiano telescope (Bologna, Italy) equipped with the BFOSC
detector operated with the Gunn g filter (Gualandi & Merighi 2001). The integration time was set
to 30 s in all observations. The CCD was windowed to a size of
5′ in order to reduce read-out time,
giving a temporal resolution of 40 s. On August 26, the sky
conditions were very poor, with winds and clouds and a seeing
3″ so that the source was observed for only 40 min. On August 27, the
sky conditions were photometric with a seeing of 1.5-2″,
although some cirrus were present during the night. We here then present
the observations obtained on August 27.
A total of 455 frames were acquired in 5.3 hr with the log of the observations
reported in Table 1.
The photometric data were reduced using iraf package with
standard procedures including bias, flat-field and sky subtraction.
Aperture 3 photometry was obtained for the target and several comparison
stars. The flux ratios were obtained by dividing the counts of the target
by the best combination (weighted mean) of three reference stars.
These ratios were converted to fractional intensities by dividing by the
mean flux ratio and heliocentric correction was also applied.
The resulting light curve, shown in Fig. 3 (top panel), displays clear short term periodic variations superposed on a longer term variability.
| Observations | Range | Res. | Date | UT(start) | Exposure (min) |
|---|---|---|---|---|---|
| Photometry | g filter | 40 s | 2006 Aug. 27 | 21:45 | 320 |
| Spectroscopy | 3600-7200 | 5.7 Å | 2006 Oct. 21 | 18:56 | 244 |
| 3600-7200 | 5.7 Å | 2006 Oct. 24 | 22:34 | 134 | |
| 3600-7200 | 5.7 Å | 2006 Oct. 25 | 18:24 | 538 |

A Discrete Fourier Transform
(DFT) on the photometric time series shows a strong peak at 153 day-1
(see Fig. 3, bottom panel).
The low frequency part also shows some additional power at 44 day-1 and
below 10 day-1. This latter
could be due to a mixture of residual atmospheric extinction and sky transparency
fluctuations as well as possible contribution from variability at the orbital period 0.168 day (see below).
We have simulated the long term variability using a third order polynomial
function and two sinusoids at the fixed orbital
frequency and another left free to vary. This latter is then found at
43.880.23 day-1 (32.820.17 min).

The DFT of the detrended light curve is shown in the middle panel of Fig. 3. From a sinusoidal fit to the detrended curve, the main peak is found at 153.3190.167 day-1. A periodic 563.530.62 s modulation is then clearly and safely detected with an ephemeris as:
| (1) |
where is the heliocentric arrival time of the sine curve maximum. There is no indication of beat periods or harmonics. The light curve folded with this period is indeed very sinusoidal with an amplitude of () mag (see Fig. 4). This periodicity, typical of a spin period, indicates that the system is an intermediate polar. Though there appears to be an indication of a possible variability at 32.8 min, the identification of this type of longer period variations obviously requires a longer coverage.
4 Spectroscopic Observations
IGR J00234+6141 was observed at the Observatoire de Haute Provence (France) in October 2006 (see Table 1). Long slit spectra were obtained with the Carelec spectrograph (Lemaitre et al. 1990), attached to the Cassegrain focus of the 193 cm telescope and using a CCD EEV (2048x1024 pixels) detector of 13.5 m pixel size. A 133 Å/mm grating was used, with a slit width of 2″ , leading to a wavelength coverage of 3600-7200 Å at a FWHM resolution of 5.7 Å. Exposure times were set at 1128 s, twice the 564 s modulation, to smear any effect from the spin variability. The observations were obtained in nearly photometric conditions with only partial thin clouds during one night (21 Oct.). Seeing was typically of 2.5″ to 3″ .
Standard reduction was performed in the ESO-MIDAS package, including cosmic rays removal, bias subtraction, flat-field correction and wavelength calibration. The wavelength calibration was checked on sky lines which were found within 0.6 Å from their expected wavelengths. All radial velocity measurements have been corrected from the Earth motion and from the small instrumental shifts measured on the OI 5577 Å line and times have been converted in the heliocentric system. Flux calibration has been performed using the standards BD+28 4211 and EG 247.
The mean optical spectrum of IGR J00234+6141 is typical of magnetic CVs with strong emission lines of the Balmer series, HeII (4686Å), HeI (4471, 5875, 6678 and 7065Å) and CIII-NIII (4655Å), superimposed on a relatively blue continuum. The mean V flux is estimated at , which corresponds to a V magnitude of 16.7, consistent to that reported by Bikmaev et al. (2006) and Masetti et al. (2006).
The radial velocities for the main lines were measured using a single Gaussian least square fit procedure and were analysed to constrain the orbital period. Periodicities were searched using a Discrete Fourier Transform (DFT). The power spectrum for the strongest Hα line gives the most accurate period determination (see Fig 5). The maximum power is seen at 5.940.14 day-1 (4.030.10 hr) with secondary peaks which are 1 d and 4 d harmonics, corresponding to the night separations. The characteristics of the line modulation were further determined from a sine fit. The minimum corresponds to a period of =4.0330.005 hr, where the error bar is at a 99% level, computed for two independent parameters. The orbital ephemeris for IGR J00234+6141 is determined as :
| (2) |
where is the predicted heliocentric time of the blue-to-red radial velocity transition.
| Lines | ( ) | K ( ) | Phase (*) |
| Hγ | - 24.5 (5.2) | 47.1 (6.9) | - 0.07 (0.07) |
| HeII( 4686 Å) | - 60.1 (8.7) | 71.3 (11.7) | +0.08 (0.09) |
| Hβ | - 30.6 (4.5) | 53.9 (6.1) | - 0.07 (0.06) |
| Hα | - 31.6 (3.0) | 60.0.(4.0) | 0.0 (fixed) |
| * Phase of the blue-to-red zero crossing | |||
| 1- error bars into parentheses | |||
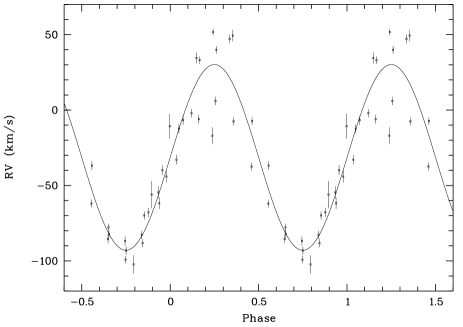
The radial velocities of the Hα line, folded at the above best orbital ephemeris, are shown in Fig. 6 and the parameters of the corresponding best sine fits for the strongest emission lines are given in Table 2. It should be noted that a significant velocity scatter is present around 0.25, at maximum red velocity. We carefully checked by using different sky lines that the effect is not due to a faulty wavelength calibration. In fact, the difference in velocity appears in the two consecutive cycles obtained in the same night (Oct. 25) when negligible wavelength shifts were observed. Inspection of the line profiles shows some distortions but an attempt to fit with two gaussians failed to give significant results. The Balmer lines show a 50-60 range in velocity amplitudes while the HeII lines display a slightly higher value with no significant phase shift.
5 Discussion
Out of the 21 sources identified as CVs in the 3rd INTEGRAL catalogue, IGR J00234+6141 is so far the unique confirmed IP that was discovered by its hard (E 20 keV) X-ray emission.
Apart for the close-by dwarf nova SS Cygni and the three polars (V834 Cen and the two asynchronous V1432Aql and BY Cam), all other sources are already known IPs with however five additional suspected CVs remaining to be identified from their period determinations (Bird et al. 2007; Barlow et al. 2006; Stephen et al. 2006).
Besides its INTEGRAL high energy emission, IGR J00234+6141 has only one known low energy counterpart, the weak (0.1-2.4 keV) ROSAT source, 1RXS J002258.3+614111 (Voges et al. 1999). From a search in the X-ray databases, a flux is also reported from the RXTE ALL Sky Monitor instrument, in the time interval from February 1996 to March 2007 (Levine et al. 1996).
We extracted and analysed the (2-10 keV) light curve obtained at a 90 s resolution. The source is not significantly detected with a mean countrate of (0.0501.65) c/s and a power spectrum of the light curve does not show any significant peak.
Without any knowledge of the absorption, no attempt was made to fit jointly the ROSAT and INTEGRAL data. From the reported ROSAT hardness ratios, HR1=1.000.09 and HR2=0.510.16 (Voges et al. 1999), and using the HR-NH distributions for CVs (see Motch et al. 1998, Fig. 4 and 5),
a very rough estimate of the absorption can be obtained as
NH , significantly less than the total line-of-sight interstellar value (NH ).
With this NH value, the extrapolation of the best INTEGRAL fit yields a (0.1-2.4 keV) flux of
(with nearly a factor 2 uncertainty) .
Using the count conversion given in Voges et al. (1999), the estimated (0.1-2.4 keV) ROSAT flux is significantly lower at which may indicate that a more significant absorption is present.
IGR J00234+6141 is up to now the faintest CV detected by INTEGRAL. There is no good indication of the distance
though a useful lower limit can be set using the infrared magnitudes from the 2MASS survey and the CV donors sequence recently computed by Knigge (2006). For an orbital period of 4.03 hr, the donor is expected to be an M3 star with an absolute magnitude of MK 6.2. If attributed solely to the secondary, the observed K magnitude (K=14.770.12) (Skrutskie et al. 2006) would then yield a minimum distance of 520 pc.
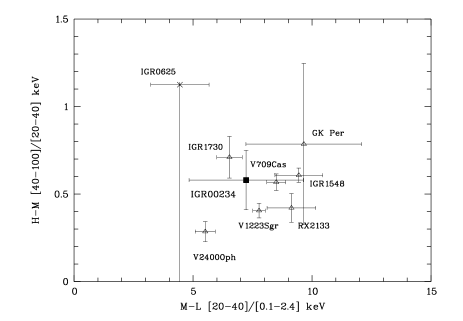
To compare with the other high energy IPs detected by INTEGRAL, a distance independent colour-colour diagram was built by comparing the flux ratios in the ROSAT (L=0.1-2.4 keV), and the low (M=20-40 keV) and high (H=40-100 keV) INTEGRAL energy ranges (see Fig. 7).
Flux ratios are derived from the ROSAT (Voges et al. 1999) and INTEGRAL (Bird et al. 2007) catalogues for uniformity reasons though fluxes derived from the actual spectral fits may slightly differ for IGR J00234+6141(this analysis), V709 Cas (Falanga et al. 2005) and IGR J15479-4529 (Bonnet-Bidaud & Falanga 2007) for which a more detailed analysis exists. The sources shown in Fig. 7 are the confirmed IPs with known spin and orbital periods.
With H-M= () and M-L= (), IGR J00234+6141 has characteristics comparable to the hardest sources.
The high observed temperature ( keV) is a lower limit to the maximum shock temperature and therefore indicative of a white dwarf (WD) mass higher than M☉ (see Aizu 1973).
Assuming that the Balmer lines trace the WD orbital motion, the radial velocity amplitude gives a system mass function of
fm = (3.70.7) M☉. Together with the WD minimum mass, this yields an estimate of the system inclination i for a companion mass in the range (0.3-0.7)M☉ comptatible with the orbit and a maximum inclination of 37 for a 1.4 M☉ WD mass.
If a distance of 500 pc is assumed, the unabsorbed luminosity will be Lx(0.1-100 keV) (d/500pc)2 , corresponding to a rather low accretion rate of for a M☉ WD.
IGR J00234+6141 , with a ratio Pω/PΩ=0.04, is also in a relatively high degree of asynchronism.
For the above WD mass and accretion rate, the condition for accretion to take place, corresponding to a magnetospheric radius lower than the corotation one, will imply a magnetic moment lower than G cm3, corresponding to a surface magnetic field of G. Unless the white dwarf is significantly less massive than indicated by the shock temperature, IGR J00234+6141 could therefore be a particular case of a low accreting IP with a low magnetic field.
6 Conclusions
The analysis of INTEGRAL data has shown that IGR00234+6141 is among the hardest X-ray emitting CVs with a probable low magnetic field. We have identified an orbital variability in the radial velocities of emission lines at a 4.033 hr period. We have also found a pulsation with a period of 563.5 s and an optical amplitude of 0.10 mag which is a clear sign of accretion onto a magnetic white dwarf. This period is identified as the rotational period of the compact object and should reveal itself as strong X-ray pulsations. The pure sinusoidal modulation and the absence of any harmonics is an indication of a one-pole accretion. Due to the faintness of the source, the INTEGRAL data do not allow a detailed study of the variability so that further X-ray observations are clearly needed to confirm these characteristics.
Acknowledgements.
We thank Maria Magri (Obs. Napoli) for her help in collecting photometric data. DDM and NM acknowledge the ASI and INAF financial support via grant No. 1/023/05/0.References
- Aizu (1973) Aizu, K., 1973, Prog Theoret. Phys., 49, 1184
- Arnaud (1996) Arnaud, K. A., 1996, in Astronomical Data Analysis Software and Systems V. ed. G. H. Jacoby, & J. Barnes, ASP Conf. Series 101 (San Francisco: ASP), 17
- Barlow et al. (2006) Barlow, E. J., Knigge, C., Bird, A. J., 2006, MNRAS 372, 224
- Bikmaev et al. (2006) Bikmaev, I. F., Revnivtsev, M. G., Burenin, R. A., et al., 2006, Astronomy Letters, vol. 32, Issue 9, p.588-593
- Bird et al. (2006) Bird, A., Barlow, E., Bassani, L., et al., 2006, ApJ, 636, 765
- Bird et al. (2007) Bird, A., Malizia, A., Bazzano, A., et al., 2007, ApJS, (in press, astro-ph 0611493)
- Bonnet-Bidaud & Falanga (2007) Bonnet-Bidaud, J. M., Falanga, M., 2007, in preparation
- de Martino et al. (2001) de Martino, D., Matt, G., Mukai, K., et al., 2001, A&A, 377, 499
- de Martino et al. (2004) de Martino, D., Matt, G., Belloni, T., et al., 2004, A&A, 415, 1009
- den Hartog et al. (2006) den Hartog, P. R., Hermsen, W., Kuiper, L., et al., 2006, A&A, 451, 587
- Dorman et al. (2003) Dorman, B., Arnaud, K. A., Gordon, C., et al., 2003, Bull. Am. Astron. Soc., vol. 35, p.641
- Falanga et al. (2005) Falanga, M., Bonnet-Bidaud, J. M., Suleimanov, V., 2005, A&A, 444, 561
- Gualandi & Merighi (2001) Gualandi, R., Merighi, R., 2001, Osservatorio Astronomico di Bologna, Rapporto Tecnico v2.
- Halpern & Mirabal (2006) Halpern, J.P., Mirabal, N., 2006, ATel, 709
- Lebrun et al. (2003) Lebrun, F., Leray, J.-P., Lavocat, Ph., et al., 2003, A&A, 411, L141
- Knigge (2006) Knigge C., 2006, MNRAS, 373, 484
- Lemaitre et al. (1990) Lemaitre, G., Kohler, P., Lacroix, D., Meunier, J.P., Vin, A., 1990, A&A, 228, 546L
- Levine et al. (1996) Levine, A. M., Bradt, H., Cui, W., et al., 1996, ApJ, 469, L33
- Matt et al. (2000) Matt, G., de Martino, D., Gaensicke, B. T., 2000, A&A, 358, 177
- Masetti et al. (2006) Masetti, N., Bassani, L., Bazzano, A. ,et al., 2006, A&A, 455, 11
- Motch et al. (1998) Motch, C., Guillout, P, Haberl, F., et al., 1998, A&AS, 132, 341
- Stephen et al. (2006) Stephen, J., Bassani, L., Molina, M., 2006, A&A, 445, 869
- Skrutskie et al. (2006) Skrutskie, M. F., Cutri, R. M., Stiening, R., 2006, AJ, 131, 1163
- Ubertini et al. (2003) Ubertini, P., Lebrun, F., Di Cocco, G., et al. 2003, A&A, 411, L131
- Voges et al. (1999) Voges, W., Aschenbach, B, Boller, Th., et al., 1999, A&A, 349, 389
- Warner (1995) Warner, B., 1995, in Cataclysmic Variables Stars (Camb Univ. Press)
- Winkler et al. (2003) Winkler, C.,Courvoisier, T. , Di Cocco, G., et al., 2003, A&A, 411, L1