Electronic structure of NaWO3: Role of the impurity potential
Abstract
We have performed ab-initio electronic structure calculations to determine the evolution of the electronic structure of WO3 with Na doping. Na doping introduces an additional electron when introduced into WO3. The ensuing electronic structure of Na doped WO3, we find, is very similar to the electronic structure of an electron introduced into WO3, thus clarifying the role of the impurity potential due to Na. While the electronic structure of NaWO3 allows a rigid band like description over a certain energy range, modifications introduced in the electronic structure can be related back to the electron due to Na and not the impurity potential that one generally believes to be responsible.
I. Introduction
Transition metal oxides, especially the 3 oxides have been intensively studied in recent times transt-met-oxides , because of the wide spectrum of physical properties they exhibit. The theoretical description of these materials, however, is difficult because electron correlation effects, electron-phonon effects have to be treated at the same footing fujimori-imada . Moving from the 3 transition-metal containing oxides to the 5 transition-metal containing oxides, the wider bands that one encounters here make the latter class of materials less correlated. In this work we have considered a set of technologically important 5 oxides - Na doped WO3 ref-nawo3 , and we examine the theoretical standpoint that one must adopt in describing the electronic structure of these systems. Na ions are almost completely ionized when Na is introduced into the lattice. Hence the electron contributed by the Na atoms is found to occupy the conduction band of WO3. Therefore this class of materials seems to promise an extremely facile description of the electronic structure merely by tuning the number of doped Na atoms.
Tungsten oxides, especially the alkali metal doped compounds, have received a lot of attention as a result of the varied physical properties these materials exhibit. The parent compound is electrochromic ref-nawo3 . Doping with electrons in WO3 provides tunability of the optical properties. While WO3 is yellow-green, Na doped tungsten bronzes show varied colours as a function of Na concentration, going all the way from yellowish green to golden yellow. It is found that the incorporation of donors strongly modifies the crystal structure of the underlying lattice. While the Cs, K doped compounds are found to favor a hexagonal structure cs-k , Na doped compounds show complex structural phase transitions na . These studies suggest that a complex interplay of electron and lattice effects is at play in this class of materials also.
Several earlier first principle studies have looked at various aspects of the electronic structure of WO3 as well as Na doped WO3. The electronic band structure of NaWO3 was calculated first by Christensen and Mackintosh Christensen-Mackintosh for cubic NaWO3 they found significant charge transfer from the Na 3 band that lies above fermi level to the other sites (W and O). In contrast to their findings of substantial admixture of Na states in the valence band of WO3 (O states), we find that Na acts as a perfect donor. More recent work cora have compared the electronic structures of similar class of oxides - ReO3, WO3 and NaWO3 specifically with respect to the issue of off-centric distortions. More extensive work by Walkingshaw et. al walkingshaw has examined the role of charge doping in WO3 in driving structural distortions. Our focus has been on testing the validity of a rigid band approach to describe the electronic structure of these systems.Recent angle-resolved photoemission experiments have established that a rigid-band description seems to be adequate to describe the electronic structure of Na doped WO3 for large Na concentrations photoemission-expt .
II. Methodology
We have carried out first principle electronic structure calculations within a plane-wave pseudopotential method as implemented in VASP code vasp to determine the role of Na doping in this class of materials. We use PAW potentials paw in our calculations, treating the semi-core 2 states on Na as a part of the valence. 2x2x2 supercells of cubic WO3 were constructed with lattice constant 3.835 and Na was introduced at the cube centre position in a lattice in which W atoms occupy the cube corners and the oxygen atoms occupy the edge centre positions. In this case there are no internal positions to optimize. We also considered the tetragonal structure, here the lattice constants were fixed at the values a = 5.36 and c = 3.98 kresse . The internal positions were optimized. The Kohn-Sham equations for the system were solved using the generalised gradient approximation ggapw91 for the exchange using a k-points mesh of 4x4x4. The plane wave basis states used were truncated at a cutoff energy of 400 eV. The tetrahedron method was used for the evaluation of the density of states. Atomic spheres of radii 1.2 were constructed around Na, W and O for the evaluation of the angular momentum decomposed partial density of states. Similar calculations with geometry optimization of the internal positions were carried out as a function of only electron doping in the WO3 lattice. The results with Na doping were contrasted with the results obtained for an additional electron, and the role of the impurity potential due to a Na atom has been clarified for the first time.
III. Results and discussion
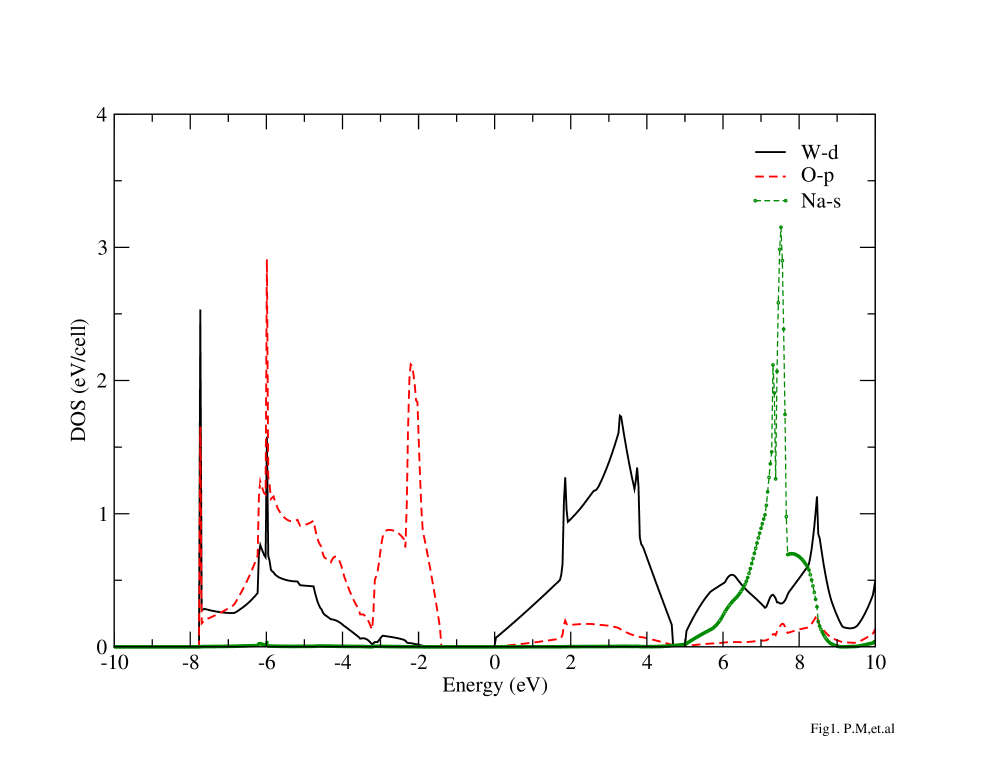
In order to clarify what is happening by the introduction of Na, we examined the electronic structure of NaWO3. The O , W and Na contributions to the density of states in the energy window -10 to 10 eV are shown in Fig. 1. In the present figure, the zero of energy has been chosen to be the onset of the W states. The O states dominate in the states shown between -1.5 eV and -8 eV, with substantial admixture of W states. The states in the energy window 0 to 5 eV have primarily W contribution, with non-zero O admixture. At higher energies, above 5 eV, we have primarily W states overlapping with Na states. These states also have some admixture of O states. The basic electronic structure of NaWO3 is similar to that of other perovskite oxides cotton . The basic electronic structure in the energy window 5-10 eV either side of the fermi energy are dominated by W and O states. Na states which contribute at much higher energies than the fermi energy merely contribute electrons to the system which change the fermi energy. The five-fold degenerate levels on the W atom are split into triply degenerate levels and doubly degenerate levels in the octahedral crystal field generated by the nearest neighbor oxygen atoms. These levels interact with those with the same symmetry on the oxygen, forming bonding and antibonding combinations. Since the W levels are above the O levels energetically, the bonding states have dominant O contribution, while the antibonding states have primarily W character. The splitting into and levels in the point ion limit, with above remains in the solid and is responsible for the two features with primarily W character in the energy window 0-10 eV. The lower energy features between 0-5 eV are the antibonding states with symmetry, while the higher energy states are the antibonding states with symmetry. WO3 is an insulator, with the gap generated between the bonding and antibonding states. Na doping pushes the fermi energy into the antibonding states. Another aspect of the electronic structure that we would like to point out is the dispersional width of the antibonding states which is almost 5 eV in contrast to the dispersional width of 1 eV found in 3 transition metal oxides with the same structure.
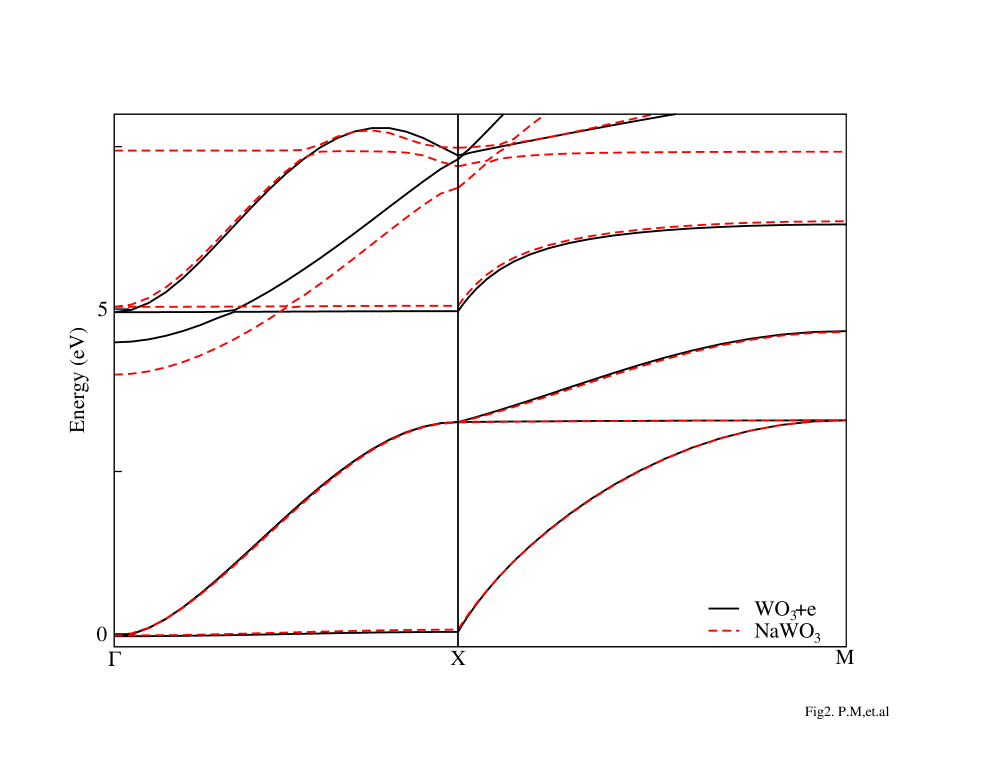
Since the Na states are located 6-8 eV above the conduction band bottom, it seems natural to make a comparison of the electronic structure of NaWO3 with that of WO3 with an additional electron. The corresponding band dispersion are plotted in Fig. 2 along GX and XM directions. The bottom of the W bands has been aligned. It is not suprising that we find that the bands overlap upto almost 6 eV above the band bottom, indicating clearly that the effect of the Na doping is identical to introducing additional electrons in the system. The ionic potential due to Na is too weak to capture the electrons.
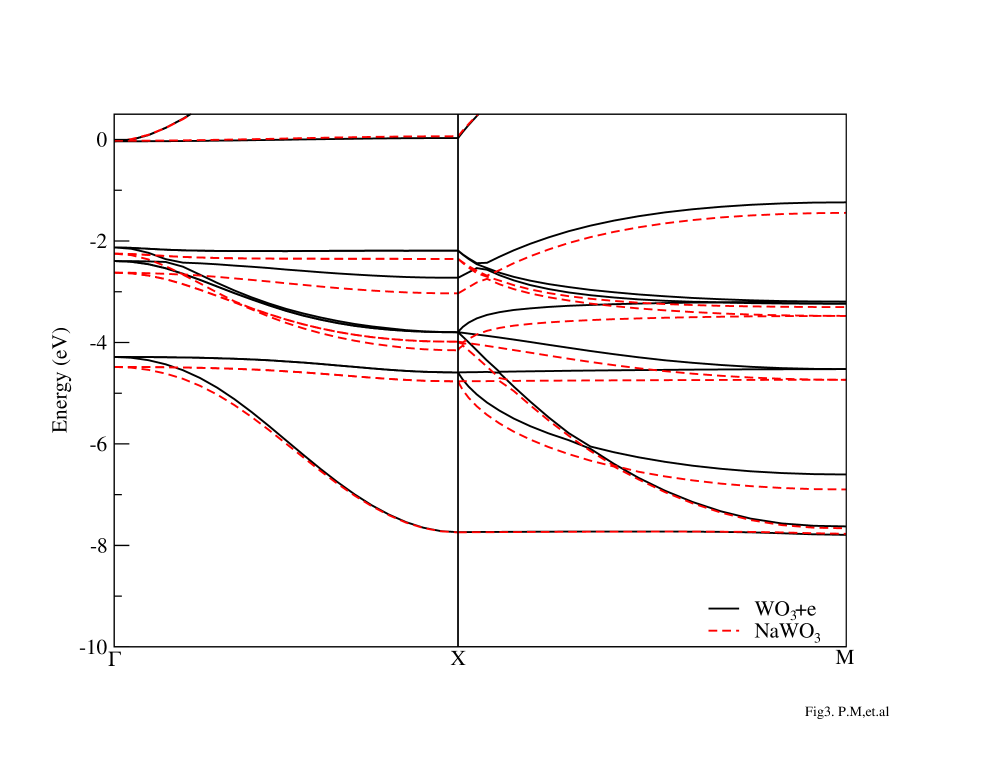
Having examined the conduction bandwidth for the two cases, we then went on to see if the agreement was similar in the valence band region also. The zero of energy in this case is the bottom of the conduction band. The band dispersion are superimposed along the X and XM directions in Fig. 3. The near match we found in the earlier case is not present here and the bands in the case of NaWO3 are narrower by 0.2 eV.
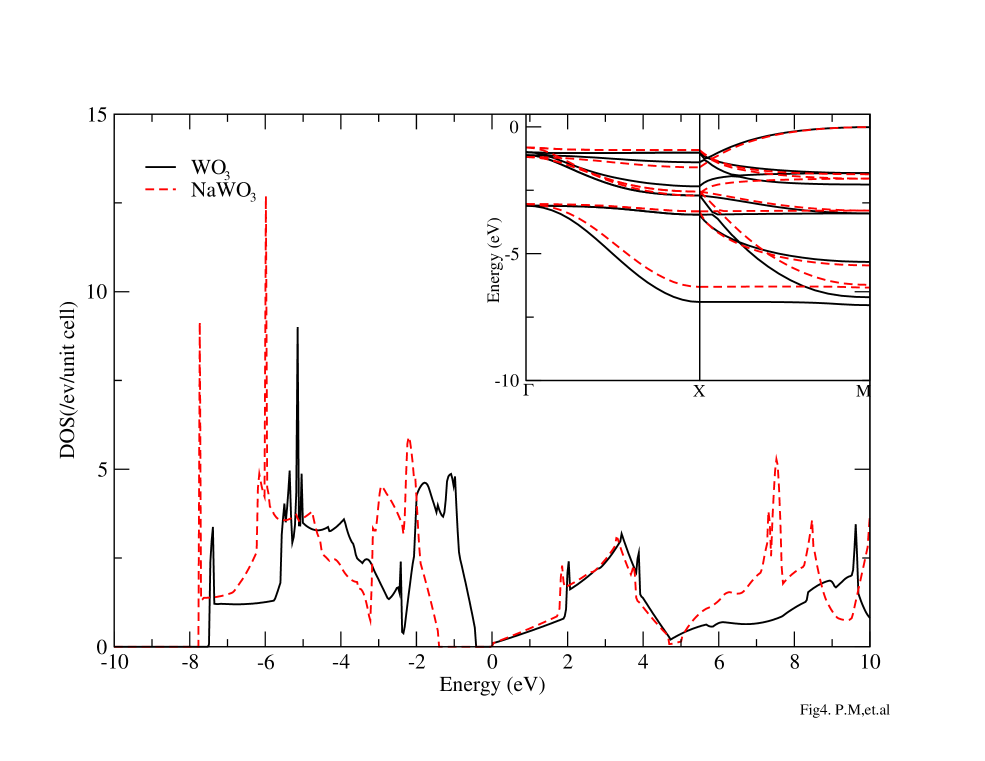
Having established that the basic electronic structure of NaWO3 is very similar to that of WO3 with an additional electron, we then examined what was the modification in the electronic structure induced by the extra electron. A comparison of the calculated density of states is given in Fig. 4 with the zero of the energy corresponding to the bottom of the conduction band ( primarily Wd states). An increase is observed in the - gap. In addition the valence band comprising of primarily O states is narrower in NaWO3 than in WO3. The conduction band features in the two systems almost overlap in an energy window about 5 eV energy. These results suggest that a rigid band model description is valid depending on the energy window being probed in experiment. There are modifications in the electronic structure of WO3 induced by an additional electron. Since the density of states provides with a picture of the electronic structure integrated over all directions in the Brillouin zone, we show the band dispersion along the symmetry directions X and XM in the inset of Fig. 4. The conclusions are similar from the analysis of the density of states.
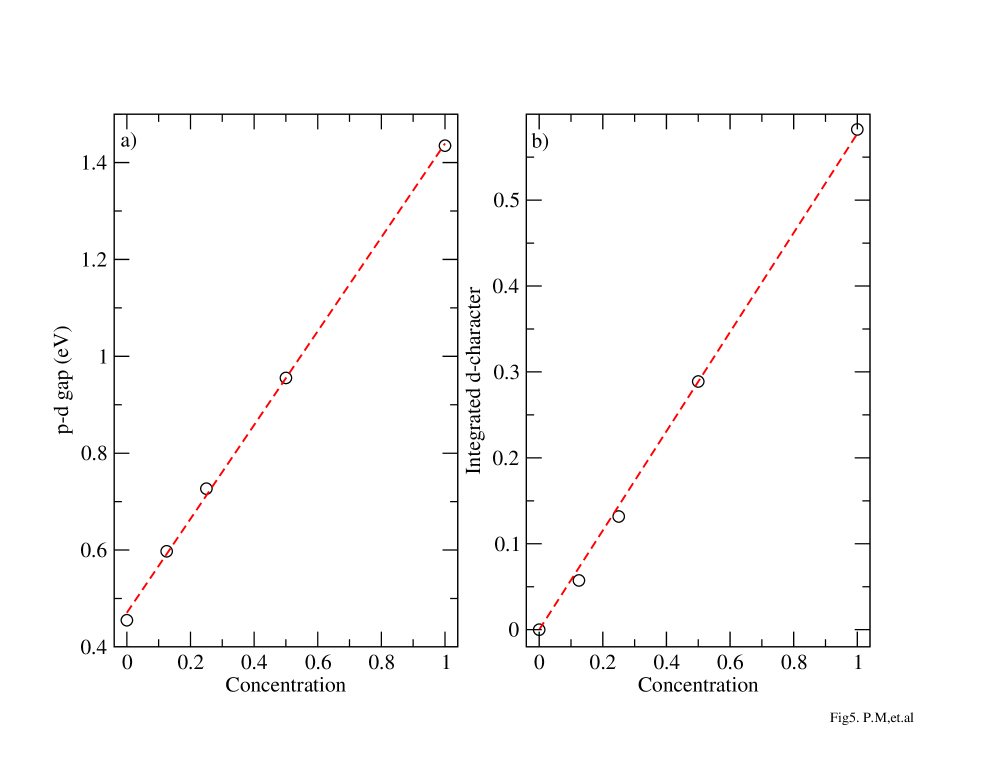
Supercells of NaxWO3 were constructed and the sodium concentration was varied from 0 to 100. The corresponding variations in the - gap was determined and was found to be a linear function of the concentration as shown in Fig. 5. Since the added electrons go into the W states, we examined the variation of the character with Na concentration (right panel of Fig. 5). This again is found to be linear function of the concentration. These results suggest that the variation of the - gap is a consequence of the electron-electron interaction effects within the W manifold. Normalizing the change in the - gap by the change in the character of the added electron we obtain an esitimate for the coulomb interaction on the W states to be 1.6 eV. This analysis therefore provides us with an estimate of in the t manifold for these uncorrelated 5 oxides and clearly indicates that these systems are in the regime of 1.
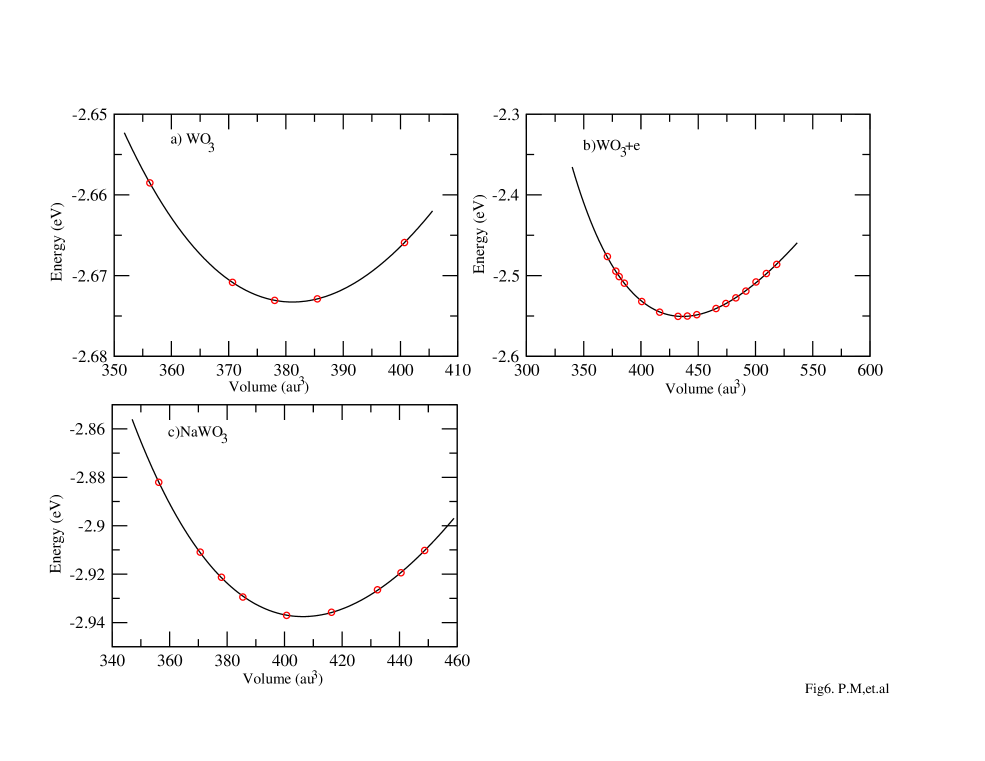
Having established the fact that Na ion merely donates electrons, what then is the role of the Na in the lattice ? Usually the success of doping a particular element in a host material is gauged by the fact that there is a modification in the lattice constant of the doped material in contrast to the host. We first computed the equilibrium volume for NaWO3 and contrasted that with WO3. For determining the role of Na, the equilibrium volume of WO3 with an additional electron was determined. The computed energy versus the volume curves are given in Fig. 6. Interestingly both NaWO3 and the unit cell with WO3 with an extra electron both have expanded volumes compared to that of the parent compound WO3, with that of NaWO3 being smaller than that of WO3 with an added electron. These results clearly indicate that the role of Na can be clarified by separating out the part due to the electron that it contributes and that due to the ionic potential of Na. The effect of the added electron is to expand the lattice and therefore reduce the effect of the electron-electron interactions that it experiences. The Na ion, a positively charged entity on the other hand, is closest to the oxygen atoms which are negatively charged in the point ion limit. Hence they attract each other trying to reduce the volume that they enclose. This has the cumulative effect of reducing the unit cell volume.
While the discussion till now has been for cubic structures of NaxWO3, a proper comparison should consider the experimentally observed structures of NaxWO3. Experimentally NaxWO3 is found to favor monoclinic structures upto 2.5 Na doping and for doping in between 2.5 and 10 orthorhombic structures are favoured. For larger Na dopings upto 40 , different tetragonal polymorphs are favored, while the cubic unit cell is favored for x 40 . In order to examine whether our conclusions derived for cubic NaxWO3 are valid in general, we considered the tetragonal structure with lattice constants fixed at earlier optimised GGA values kresse , and examined the validity of our conclusions obtained earlier for the cubic case. The doping concentrations that we considered were 12.5%, 25% and 37.5%. An earlier work nicola found that merely considering charge doping in WO3 stabilized the correct structure type. We assume the structure type while allowing for changes in the atom positions in both cases - with and without the Na impurity potential. Strong modifications are found in the W-O network due to the presence of the Na atom/atoms as well as the extra electrons (Table I), and the structural distortions are similar in the two cases.
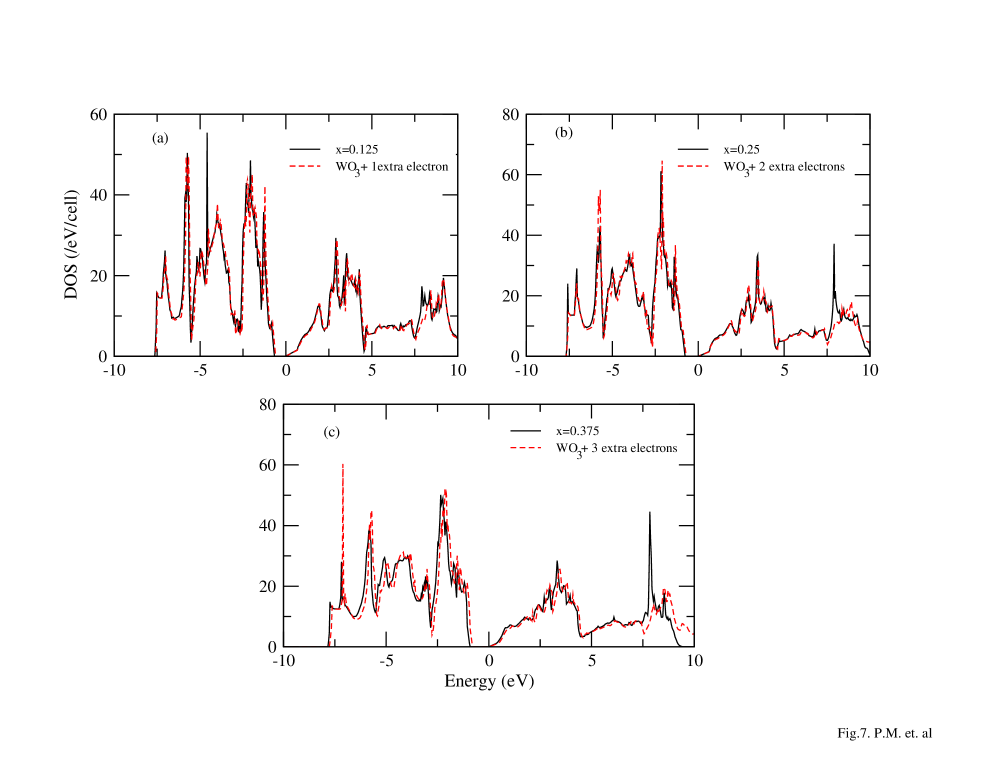
We went on to examine the modifications in the electronic structure. As found earlier by us for the cubic unit cells, the role of the impurity potential is found to be extremely weak in the two cases. The calculated total density of states (Fig. 7) for the same concentration with and without the Na impurity potential being explicitly considered are very similar. There are concentration dependent changes in the electronic structure, but these are not a consequence of the Na impurity potential, but are due to the extra electron introduced by each doped Na atom. The - gap is found to increase with doping (Table II), but the values are similar in both cases. An approximately linear dependence is found in the two cases as has already discussed in the context of cubic NaxWO3.
IV. Conclusion
In conclusion, we have determined the electronic structure of Na doping in WO3. The role of the impurity potential due to Na has been clarified for the first time. We find that the role of Na is to behave as a perfect donor, leading to a rigid band-like description of the electronic structure over a wide range. Subtle modifications of the electronic structure can be related directly to the introduced electron and not the impurity potentail. These effects enable us to determine the regime of to place WO3.
References
- (1) See for example Colossal Magnetoresistive Oxides, (Gordon and Breach Science, New York, 2000), Ed. Y. Tokura; Solid State Science, Vol. 119, edited by Y. Tokura and A. Fujimori (Springer-Verlag, Berlin, 1995), p. 126.
- (2) M. Imada, A. Fujimori and Y. Tokura, Rev. Mod. Phys 70, 1039 (1998).
- (3) C.G. Granqvist, Handbook of Inorganic Electrochromic Materials (Elsevier, Amsterdam, 1995).
- (4) L. Kihlborg and A. Hussain, Materials Research Bulletin 14, 667 (1979).
- (5) A. S. Ribnick, B. Post and E. Banks, Adv. Chem. Ser. 39, 246 (1963).
- (6) N.E. Christensen and A.R. Mackintosh, Phys. Rev B 35, 8246 (1987).
- (7) M.G. Stachiotti, F. Cora, C.R.A. Catlow and C.O. Rodriguez, Phys. Rev. B 55, 7508 (1997); F. Cora, M.G. Stachiotti, C.R.A. Catlow and C.O. Rodriguez, J. Phys. Chem. B 101 3945 (1997).
- (8) A.D. Walkingshaw, N.A. Spaldin and E. Artacho, Phys. Rev. B 70, 165110 (2004).
- (9) S. Raj, D. Hashimoto, H. Matsui, S. Souma, T. Sato, T. Takahashi, S. Ray, A. Chakraborty, D.D. Sarma, P. Mahadevan, W.H. McCarroll and M. Greenblatt, Phys. Rev. B 72 125125 (2005).
- (10) G. A. de Wijs, P. K. de Boer, R. A. de Groot and G. Kresse, Phys. Rev. B 59, 2684 (1999).
- (11) A. D. Walkingshaw, N. A. Spaldin and E. Artacho, Phys. Rev. B 70, 165110 (2004).
- (12) G. Kresse and J. Furthmller, Phys. Rev. B. 54, 11169 (1996); G. Kresse and J. Furthmller, Comput. Mat. Sci. 6, 15 (1996).
- (13) G. Kresse, and J. Joubert,Phys. Rev. B 59, 1758 (1999).
- (14) J.P. Perdew and Y. Wang, Phys. Rev. B 45, 13244 (1992).
- (15) Cotton, F. A. The Ligand Field Theory: Chemical Applications of Group Theory 3rd ed. New York: Wiley, pp. 287-288, 1990.
| W-W distance | W-O distance | W-O-W angle | |
|---|---|---|---|
| WO3 | |||
| 3.825*2, 3.98 | 1.9127*4, 2.2155, 1.7645 | 179.999*2, 180 | |
| Na0.125WO3 | |||
| 3.8084*2, 3.9505 | 1.8805*2, 1.9280*2, 1.765, 2.1853 | 179.035*2, 178.947 | |
| (Na) | 3.8424*2, 4.0115 | 1.8974*2, 1.9460*2, 1.7805, 2.2319 | 177.3409*2, 177.465 |
| Na0.25WO3 | |||
| 3.8183, 3.7852 | 1.9127, 1.9069, 1.8689, 1.9167 | 176.869, 178.066 | |
| 3.92276 | 1.786, 2.1359 | 179.485 | |
| (Na) | 3.8474, 4.0387 | 1.8991, 1.9498, 1.8207, 2.2203 | 176.6788, 176.1216 |
| Na0.375WO3 | |||
| 3.7909, 3.76075 | 1.8895, 1.9020, 1.872, 1.8886 | 178.009, 179.2295 | |
| 3.92276 | 1.835, 2.1192 | 176.2237 | |
| (Na) | 3.8207, 3.8511 | 1.9033, 1.9194, 1.9209, 1.9308 | 176.238, 177.864 |
| (Na) | 4.0094 | 1.8547, 2.1567 | 176.3448 |
| WO3+ 1 extra electron | |||
| 3.8252*2, 3.98 | 1.9126*4, 2.2102, 1.7697 | 179.999*2, 180.0 | |
| WO3+ 2 extra electron | |||
| 3.8176*2, 3.98 | 1.908*4, 2.1830, 1.7969 | 179.999*2, 180.0 | |
| WO3+ 3 extra electron | |||
| 3.8087*2, 3.98 | 1.9043*4, 2.1475, 1.83249 | 179.999*2, 180.0 |
| p-d gap (eV) | d-character | |
|---|---|---|
| WO3 | 0.49 | 0.0 |
| Na0.125WO3 | 0.70 | 0.07634 |
| Na0.25WO3 | 0.77 | 0.14553 |
| Na0.375WO3 | 0.945 | 0.2275 |
| WO3+ 1 extra electron | 0.63 | 0.07113 |
| WO3+ 2 extra electron | 0.70 | 0.14979 |
| WO3+ 3 extra electron | 0.80 | 0.2145 |