Correlated radio–X-ray variability of Galactic Black Holes: A radio–X-ray flare in Cygnus X-1
Abstract
We report on the first detection of a quasi-simultaneous radio–X-ray flare of Cygnus X-1. The detection was made on 2005 April 16 with pointed observations by the Rossi X-ray Timing Explorer and the Ryle telescope, during a phase where the black hole candidate was close to a transition from the its soft into its hard state. The radio flare lagged the X-rays by 7 minutes, peaking at 3:20 hours barycentric time (TDB 2453476.63864). We discuss this lag in the context of models explaining such flaring events as the ejection of electron bubbles emitting synchrotron radiation.
Subject headings:
X-rays: stars – X-rays: binaries – Black Hole Physics – accretion, accretion disks1. Introduction
With the increased availability of simultaneous radio and observations in the last decade, there is now a large amount of evidence available pointing towards a very close interaction between the accretion disk and the jet in black hole X-ray binaries and active galactic nuclei (AGN). Most convincingly, this disk-jet interaction has been shown for microquasars, i.e., black hole binaries with strongly relativistic jets such as GRS 1915+105 (catalog ) or GRO J165540 (catalog ). In these systems, the correlated flaring in the X-rays, optical/infra-red, and radio seen at certain times is generally interpreted as the evidence for (ballistic) ejection events of synchrotron radiation-emitting electron bubbles (Rothstein et al., 2005; Fender & Belloni, 2004; Klein-Wolt et al., 2002; Eikenberry et al., 1998, and therein). In this model, the X-ray flare represents the ejection of the synchrotron radiation emitting bubble, which then adiabatically expands within the jet flow and cools down, resulting in the peak of the emission shifting downwards in frequency with time (van der Laan, 1966; Hjellming & Johnston, 1988). Simultaneous broadband observations of such events, which show minute-long delays between the different wave bands, are consistent with this picture (Mirabel & Rodríguez, 1994; Mirabel et al., 1998; Pooley & Fender, 1997; Eikenberry et al., 1998). The model has also been confirmed by proper motion measurements in the radio, which reveal intrinsic jet speeds of for GRS 1915+105 (Miller-Jones et al., 2005). Comparable behavior was also detected in 3C 120 (catalog ), suggesting that similar ejections also occur in active galactic nuclei, on correspondingly longer timescales (Marscher et al., 2002).
For black hole binaries with weakly relativistic jets, the evidence for jet-disk-interaction is less direct. This evidence includes the correlation between X-ray states and radio emission in black hole transients (e.g., in GX 3394 (catalog ) Corbel et al., 2003; Belloni et al., 2005) and the success of modeling the radio to X-ray broad band spectrum of black hole candidates with outflow-dominated models (Markoff et al., 2005; Markoff & Nowak, 2004, and therein). Furthermore, at least for Cygnus X-1 (catalog ), there is also evidence for the presence of an energetically significant, strong outflow (Stirling et al., 1998, 2001; Gallo et al., 2005; Miller-Jones et al., 2006). A relativistic jet with has been associated with radio flares in this system (Fender et al., 2006).
Apart from GRS 1915+105, however, none of these observations shows direct evidence for a causal connection between the X-rays and jet on time scales of minutes. Prompted by this lack of quasi-simultaneous short-term radio–X-ray correlations, in 1998 we initiated a long term monitoring campaign of Cyg X-1 with the Rossi X-ray Timing Explorer (RXTE) and the Ryle telescope. Biweekly 3–10 ksec long simultaneous observations started in 1999. Previous searches for flares in campaign data taken between 1999 and mid-2003 did not reveal evidence for coherent short term activity in both bands, although a significant correlation on time scales of weeks was found, especially above 10 keV (Gleissner et al., 2004; Wilms et al., 2006). In this Letter, we report on the observation made on 2005 April 16, in which the first clear quasi-simultaneous radio–X-ray flare was detected in Cyg X-1. The remainder of this Letter is structured as follows. In §2 we describe the observations, followed by the analysis of the flare in §3. We discuss the physics of the flare in the context of emission models for the radio and X-ray emission in §4.
2. Observations and Data Reduction
We use data from both instruments on-board the RXTE, the low energy Proportional Counter Array (PCA; Jahoda et al., 2005) and the High Energy X-ray Timing Experiment (HEXTE; Rothschild et al., 1998). The data analysis was performed using the standard RXTE data analysis software, HEASOFT 6.1.2. Spectral fitting was performed with XSPEC 11.3.2aa (Arnaud, 1996).
A crucial part of the observation happened during the early phase of the RXTE observation, shortly after the source rose above the Earth’s horizon. Due to auroral emission in the far ultra-violet and soft X-rays and due to cosmic ray reprocessing in the hard X-rays, the Earth’s atmosphere is not completely X-ray dark. The typical 2.5–20 keV X-ray flux at the typical magnetic latitude of the RXTE orbit is too low, however, to influence our measurements (Petrinec et al., 2000; Sazonov et al., 2007). We therefore use all data taken whilst the source was above the Earth’s horizon and had a source offset of . We use PCA data from the standard1 mode, which gives the full 2.5–128 keV PCA count rate with a time resolution of 0.125 s and no energy information, and from the standard2f mode, a binned data mode with a 128 channel energy resolution and a time resolution of 16 s. X-ray light curves were extracted with the intrinsic time resolution of each mode and then barycentered and rebinned.
The Ryle telescope data were taken at 15 GHz with a time resolution of 8 s. The typical uncertainty of the radio measurements is 9 mJy. The observations are interrupted every 1600 s for phase calibration observations of J2007+4029. The amplitude calibration of the Ryle data corresponds to the flux scale of Baars et al. (1977) and is performed using nearby observations of 3C48 and 3C286. See Pooley & Fender (1997) for further information on the Ryle telescope.
3. A Quasi-Simultaneous Radio–X-ray Flare

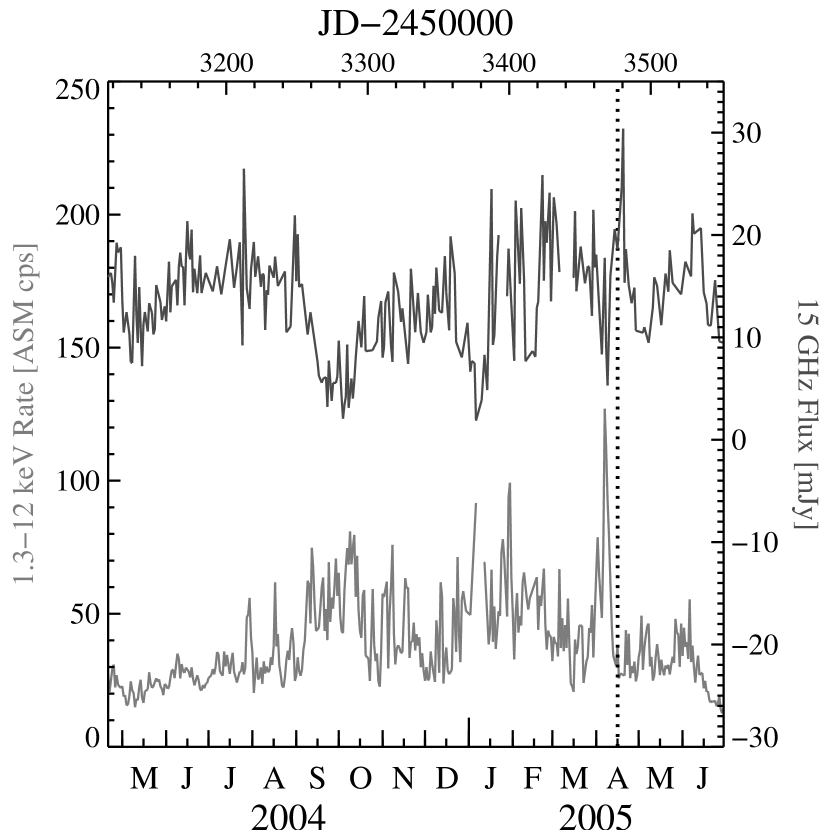
As shown in Fig. 1, 2005 April marks the possible end of a longer X-ray flaring episode of Cyg X-1 that started in early 2004 (Wilms et al., 2006). While clearly defined radio flares are not uncommon in Cyg X-1 (e.g., Hjellming, 1973), increased radio emission and radio flaring are generally seen when the source is in the intermediate state between the hard and the soft states, while the radio is weak once the X-ray source approaches the soft state (Wilms et al., 2006, and therein). At the time of our pointed observations, the soft X-ray flux had just come down from a large flare. Shortly after the observation, the 1 d averaged 15 GHz flux peaked, reaching a maximum of 30 mJy, close to the brightest radio flux of Cyg X-1 during 2004/2005.
Figure 2 shows the 15 GHz radio flux and the RXTE PCA count rate lightcurve measured on 2005 April 16. Close to the start of the observation, a radio flare is readily apparent. The total duration of the flare is 15 minutes. During this interval the 15 GHz flux increased by a factor of 3 to a peak radio flux of 70 mJy. This radio flux is among the highest seen during the Ryle monitoring111The most exceptional radio flare was that of 2004 February 20, which reached a peak flux of 140 mJy at 15 GHz, the largest flux ever seen for this source with the Ryle telescope (Fender et al., 2006).. Previous radio flares, however, did not occur during pointed RXTE observations (Gleissner et al., 2004; Fender et al., 2006), and the source monitoring provided by the RXTE-ASM is too coarse to pick up such short lived X-ray events.
RXTE started observing Cyg X-1 about 10 minutes before the peak radio flux. The X-ray lightcurve shown in Fig. 2 shows a similar shape to the radio one, although with more substructure. The earlier maximum of the X-ray flare did not allow RXTE to catch the start of the X-ray flare, or determine whether the maximum X-ray flux seen is indeed the peak of the X-ray flare. A cross correlation (CCF) analysis using the algorithm of Scargle (1989) reveals a s time lag of the radio with respect to the X-rays, where the uncertainty was determined using a standard bootstrapping method with 1000 realizations. Other approaches to calculate the CCF for non-uniformly sampled data (Alexander, 1997; Edelson & Krolik, 1988) give essentially the same result. With a maximum Scargle (1989)-CCF of 0.38, this analysis formally confirms the general similarity of the X-ray and radio lightcurves (Fig. 3). Since the substructure of the X-ray lightcurve, i.e., the two smaller flares after the main flare, is clearly different from that in the radio flare and since the start of the X-ray flare is not covered by our observations, the peak CCF value is not higher. For the same reasons, the formal uncertainty of the lag measurement is rather large.

To characterize the shape of the radio flare, we fit the radio data (rebinned to a resolution of 8 s) with the sum of a linear flux trend and a Gaussian representing the flare,
| (1) |
where is a reference time, taken as the center of the time interval analyzed (). The barycentric time of maximum flux occured at with an uncertainty of 15 s (uncertainties are at the level for one interesting parameter). The peak flux of the flare component is mJy and the width of the component is s. The flare is superimposed to a continuum with mJy, decreasing linearly with . The high quality of the fit is indicated by its low reduced ( for 233 degrees of freedom). The radio flare is therefore symmetric around its maximum. This symmetry is a marked difference compared to the asymmetric flare of 2004 February 20 (Fender et al., 2006).
Modeling the RXTE-PCA light curve is complicated by the flare already being in progress when the measurements started. Furthermore, contrary to the radio data, where the scatter in the lightcurve is mainly due to the measurement uncertainty, the X-ray data are dominated by strong low-frequency noise onto which the X-ray flare is superimposed. Consequently, the empirical model of Eq. (1) does not result in a good description of the X-ray data.
To study the spectral evolution of Cyg X-1 during the flare, we perform a spectral analysis of the 2.5–20 keV PCA standard2f data at 16 s time resolution using a simple photoabsorbed powerlaw, which proves sufficient to describe the spectrum at this lower signal to noise level. For spectra taken during the flare, at PCA count rates above , the mean power law index . The spectrum hardens outside of the flare to (errors given are the standard deviation of the individual power law fits to the standard2f spectra), a value typical for the intermediate state of this source (Wilms et al., 2006).
That Cyg X-1 was in the intermediate state on the day of the flare can also be confirmed by modeling the 2.5–150 keV PCA and HEXTE spectrum of an RXTE observation performed 4 h after the flare (to avoid possible “contamination” by the flaring activity) with the sum of a photoabsorbed (, held fixed), exponentially cut-off broken power law model. This empirical model has been shown to give a good characterization of the spectral shape of Cyg X-1 (Wilms et al., 2006). The spectral parameters are a lower photon index , breaking at into a power law with . At the exponential cutoff starts with a folding energy of (all uncertainties are at the 90% level). In addition, a Fe K line from neutral iron is present with an equivalent width of 135 eV. The 3–10 keV source flux is . The parameters of the continuum are again consistent with an intermediate state and fits well with the empirical picture that radio flaring in black hole candidates occurs most frequently in this state (Fender et al., 2004; Wilms et al., 2006).
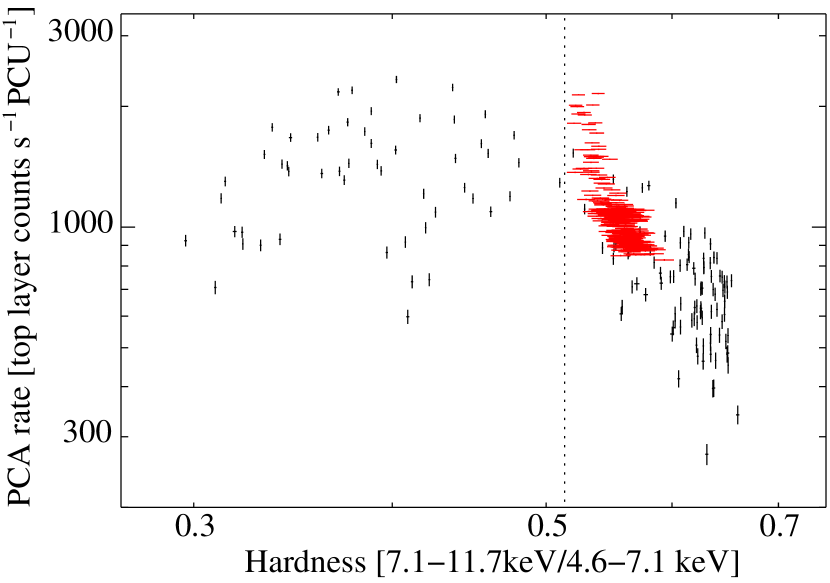
To allow the interpretation of the observed softening during the flare with the general behavior of Cyg X-1, Fig. 4 shows the X-ray hardness intensity diagram for the PCA top layer standard2f 16 s spectra in the context of the pointed RXTE observations of the monitoring campaign. For black hole transients this diagram is seen to have an approximate q-shape (Belloni et al., 2006, and therein). As a persistent hard state source, Cyg X-1 is typically found in the top right corner of the diagram. Outside of the flare, the source is situated at a hardness of 0.55 with a typical 1–128 keV PCA count rate of . During the flare the source softens and brightens. It leaves the region of the diagram where Cyg X-1 is usually found during our monitoring campaign, by moving to higher count rates, for this hardness, than usually observed.
Flaring behavior in Cyg X-1 is usually observed whenever the source is close to the “jet line” in its hardness intensity diagram, while the radio flux gets quenched once the source moves away from the jet line to the left of the diagram (Gallo et al., 2003; Fender et al., 2004). In spectral fits based on the eqpair-model of Coppi (1999), the radio fluxes of Cyg X-1 are at their maximum when the compactness ratio (Fig. 16 of Wilms et al., 2006, ; the compactness ratio is a measure for the relative importance of the energy dumped into the Comptonizing plasma and that dissipated in the accretion disk), corresponding to a soft power law index of . From our database of spectra of Cyg X-1, we find that these observations have a hardness ratio of 0.52, indicated by the dotted line in Fig. 4. During the 2005 April 16 observation, the source was therefore close to this line of maximum radio flux and approached it asymptotically during the flare.
4. Discussion
In this Letter we have presented the first evidence for a direct relationship of the X-ray and radio emission in Cyg X-1 on timescales of minutes. The data show the radio to lag the X-rays by s and the X-ray spectral shape to approach the X-ray hardness ratio where the source is typically found at its largest radio flux in our long term monitoring, hinting towards a general similarity of the physics of individual flare events and the overall radio–X-ray connection. Although the X-ray data do not cover the start of the X-ray flare, explaining the rather large uncertainty of the lag determination, the morphological similarities between the X-ray and radio lightcurves also suggest that the same event is observed in both wavebands.
Similar events in microquasars show that lags with timescales of several 100 s are typical for the coherent behavior of these systems, such as a lag of 31020 s between the soft X-rays and the IR (Eikenberry et al., 1998) and 800 s between the X-rays and the radio (Pooley & Fender, 1997) in GRS 1915+105. The timescale observed in Cyg X-1 allows us to place an upper limit to the physical separation of the X-ray and radio emitting regions of the accretion/ejection flow. We assume that the emission coincides with the imaged jet and that the jet is perpendicular to the orbital plane of the HDE 226868/Cyg X-1 system (although this is not a priori certain; Maccarone, 2002), which has an inclination of (Gies & Bolton, 1982; Dolan, 1992). Taking light travel time effects into account, for jet speeds of , the lower limit implied by observations of the transient jet ejection discussed by Fender et al. (2006), the measured delay implies a separation of AU between the location of X-ray and radio emission. If the jet is relativistic instead, with a speed of , the distance increases to AU. Note that similar values for the length of the jet are obtained by considering that the 10 minute duration of the radio flare is roughly equal to the dynamical timescale of the jet. Assuming a distance of 2.5 kpc, these values imply to a maximum projected angular separation between the X-ray and radio emitting region of mas.
What is the physics of the observed event? In the model of Fender et al. (2004) for transient radio events, the inner edge of a thin accretion disk is posited to move rapidly towards the black hole. The temperature at the inner edge therefore increases, leading to a softening of the source in the RXTE-PCA as more disk photons enter the instrument’s band pass. This X-ray flare is then followed by the ejection of an electron bubble, which rapidly expands, producing the observed radio emission. At least qualitatively, this behavior and also the time scales deduced above seem to agree with our observations, although the model was originally invented for the large scale variability of black hole candidates and not for such short events as the one discussed here. Note that while the main flare dominates the measured time lag and therefore the sizes estimated above, it is followed by two short spikes, which are both present in the radio and the X-ray lightcurves, but at different time delays. These spikes could indicate that more than one blob of material was ejected at different speeds but cannot be separated once the blobs have expanded and their radiation peaks in the radio. Such a behavior could be typical for flares in Cyg X-1, since the large radio flare of Cyg X-1 from 2005 Feb 20 also shows very little substructure (Fender et al., 2006).
The lack of further detections of radio–X-ray flares in over 1.5 Msec of simultaneous radio–X-ray data precludes a more detailed discussion of the properties of the ejected material from comparing the source behavior during different flares. The observation of the flare itself, however, stresses the importance of long-term multi-wavelength campaigns to detect such rare events which are necessary to further our insight into the physics of the emission from black holes.
References
- Alexander (1997) Alexander, T. 1997, in Astronomical Time Series, ed. D. Maoz, A. Sternberg, & E. M. Leibowitz (Dordrecht: Kluwer), 163
- Arnaud (1996) Arnaud, K. A. 1996, in Astronomical Data Analysis Software and Systems V, ed. J. H. Jacoby & J. Barnes, Astron. Soc. Pacific Conf. Ser. 101 (San Francisco: Astron. Soc. Pacific), 17
- Baars et al. (1977) Baars, J. W. M., Genzel, R., Pauliny-Toth, I. I. K., & Witzel, A. 1977, A&A, 61, 99
- Belloni et al. (2005) Belloni, T., Homan, J., Casella, P., van der Klis, M., Nespoli, E., Lewin, W. H. G., Miller, J. M., & Méndez, M. 2005, A&A, 440, 207
- Belloni et al. (2006) Belloni, T., Parolin, I., Del Santo, M., Homan, J., Casella, P., Fender, R. P., Lewin, W. H. G., Méndez, M., Miller, J. M., & van der Klis, M. 2006, MNRAS, 367, 1113
- Coppi (1999) Coppi, P. 1999, in High Energy Processes in Accreting Black Holes, ed. J. Poutanen & R. Svensson, Astron. Soc. Pacific Conf. Ser. 161 (San Francisco: Astron. Soc. Pacific), 375
- Corbel et al. (2003) Corbel, S., Nowak, M. A., Fender, R. P., Tzioumis, A. K., & Markoff, S. 2003, A&A, 400, 1007
- Dolan (1992) Dolan, J. F. 1992, ApJ, 384, 249
- Edelson & Krolik (1988) Edelson, R. A., & Krolik, J. H. 1988, ApJ, 333, 646
- Eikenberry et al. (1998) Eikenberry, S. S., Matthews, K., Morgan, E. H., Remillard, R. A., & Nelson, R. W. 1998, ApJ, 494, L61
- Fender & Belloni (2004) Fender, R., & Belloni, T. 2004, ARA&A, 42, 317
- Fender et al. (2004) Fender, R. P., Belloni, T. M., & Gallo, E. 2004, MNRAS, 355, 1105
- Fender et al. (2006) Fender, R. P., Stirling, A. M., Spencer, R. E., Brown, I., Pooley, G. G., Muxlow, T. W. B., & Miller-Jones, J. C. A. 2006, MNRAS, 369, 603
- Gallo et al. (2005) Gallo, E., Fender, R., Kaiser, C., Russell, D., Morganti, R., Oosterloo, T., & Heinz, S. 2005, Nature, 436, 819
- Gallo et al. (2003) Gallo, E., Fender, R. P., & Pooley, G. G. 2003, MNRAS, 344, 60
- Gies & Bolton (1982) Gies, D. R., & Bolton, C. T. 1982, ApJ, 260, 240
- Gleissner et al. (2004) Gleissner, T., Wilms, J., Pooley, G. G., Nowak, M. A., Pottschmidt, K., Markoff, S., Heinz, S., Klein-Wolt, M., Fender, R. P., & Staubert, R. 2004, A&A, 425, 1061
- Hjellming (1973) Hjellming, R. M. 1973, ApJ, 182, L29
- Hjellming & Johnston (1988) Hjellming, R. M., & Johnston, K. J. 1988, ApJ, 328, 600
- Jahoda et al. (2005) Jahoda, K., Markwardt, C. B., Radeva, Y., Rots, A. H., Stark, M. J., Swank, J. H., Strohmayer, T. E., & Zhang, W. 2005, ApJS, 163, 401
- Klein-Wolt et al. (2002) Klein-Wolt, M., Fender, R. P., Pooley, G. G., Belloni, T., Migliari, S., Morgan, E. H., & van der Klis, M. 2002, MNRAS, 331, 745
- Maccarone (2002) Maccarone, T. J. 2002, MNRAS, 336, 1371
- Markoff & Nowak (2004) Markoff, S., & Nowak, M. A. 2004, ApJ, 609, 972
- Markoff et al. (2005) Markoff, S., Nowak, M. A., & Wilms, J. 2005, ApJ, 635, 1203
- Marscher et al. (2002) Marscher, A. P., Jorstad, S. G., Gómez, J.-L., Aller, M. F., Teräsranta, H., Lister, M. L., & Stirling, A. M. 2002, Nature, 417, 625
- Miller-Jones et al. (2006) Miller-Jones, J. C. A., Fender, R. P., & Nakar, E. 2006, MNRAS, 367, 1432
- Miller-Jones et al. (2005) Miller-Jones, J. C. A., McCormick, D. G., Fender, R. P., Spencer, R. E., Muxlow, T. W. B., & Pooley, G. G. 2005, MNRAS, 363, 867
- Mirabel et al. (1998) Mirabel, I. F., Dhawan, V., Chaty, S., Rodríguez, L. F., Martí, J., Robinson, C. R., Swank, J., & Geballe, T. R. 1998, A&A, 330, L9
- Mirabel & Rodríguez (1994) Mirabel, I. F., & Rodríguez, L. F. 1994, Nature, 371, 46
- Petrinec et al. (2000) Petrinec, S. M., McKenzie, D. L., Imhof, W. L., Mobilia, J., & Chenette, D. L. 2000, J. Atmos. Solar Terr. Phys., 62, 875
- Pooley & Fender (1997) Pooley, G. G., & Fender, R. P. 1997, MNRAS, 292, 925
- Rothschild et al. (1998) Rothschild, R. E., Blanco, P. R., Gruber, D. E., Heindl, W. A., MacDonald, D. R., Marsden, D. C., Pelling, M. R., Wayne, L. R., & Hink, P. L. 1998, ApJ, 496, 538
- Rothstein et al. (2005) Rothstein, D. M., Eikenberry, S. S., & Matthews, K. 2005, ApJ, 626, 991
- Sazonov et al. (2007) Sazonov, S., Churazov, E., Sunyaev, R., & Revnivtsev, M. 2007, MNRAS, 377, 1726
- Scargle (1989) Scargle, J. D. 1989, ApJ, 343, 874
- Stirling et al. (1998) Stirling, A., Spencer, R., & Garrett, M. 1998, New Astronomy Review, 42, 657
- Stirling et al. (2001) Stirling, A. M., Spencer, R. E., de la Force, C. J., Garrett, M. A., Fender, R. P., & Ogley, R. N. 2001, MNRAS, 327, 1273
- van der Laan (1966) van der Laan, H. 1966, Nature, 211, 1131
- Wilms et al. (2006) Wilms, J., Nowak, M. A., Pottschmidt, K., et al. 2006, A&A, 447, 245