The richest superclusters
Abstract
Aims. We study the morphology of galaxy populations of the richest superclusters from the catalogue of superclusters of galaxies in the 2dF Galaxy Redshift Survey.
Methods. We use the luminosity density distribution and Minkowski functional to study substructures in superclusters as formed by different populations of galaxies. We compare the properties of grouped and isolated galaxies in regions of different density in superclusters.
Results. In high-density cores of rich superclusters there is an excess of early type, passive galaxies, among galaxies in groups and clusters, as well as among those which do not belong to groups, while in lower density outer regions there are more blue, star-forming galaxies both in groups and among those galaxies which do not belong to groups. This also shows that the galaxy content of groups depends on the environment where the groups reside in. The density distributions and the behaviour of the Minkowski functional for different superclusters show that substructures in superclusters as traced by different populations of galaxies are very different.
Conclusions. We show how the Minkowski functional can be used to study substructures in superclusters. Both local (group/cluster) and global (supercluster) environments are important in forming galaxy morphologies and star formation activity. Our study shows large differences between individual very rich superclusters, which cannot be solely due to selection effects. They indicate that there are differences in their formation times and evolution stages. The presence of a high density core with X-ray clusters and a relatively small fraction of star-forming galaxies in the supercluster SCL126 may be an indication that this supercluster has started its evolution earlier than the supercluster SCL9.
Key Words.:
cosmology: large-scale structure of the Universe – clusters of galaxies; cosmology: large-scale structure of the Universe – Galaxies; clusters: general1 Introduction
| ID | R.A. | Dec | Dist | |||||||||
|---|---|---|---|---|---|---|---|---|---|---|---|---|
| deg | deg | Mpc | ||||||||||
| SCL126 (152) | 194.71 | -1.74 | 251.2 | 3591 | -19.25 | 1308 | 18 | 40,2 | 9 | 4 | 7.7 | 0.378E+14 |
| SCL10 (5) | 1.85 | -28.06 | 177.4 | 952 | -17.50 | 757 | 5 | 5 | 1 (19) | (5) | 6.2 | 0.482E+13 |
| SCL9 (34) | 9.85 | -28.94 | 326.3 | 3175 | -19.50 | 1176 | 24 | 26,9 | 12 (25) | 2(6) | 8.1 | 0.497E+14 |
Note: Identity ID after Einasto et al. (2001) with the name of Paper I in parenthesis; with sky coordinates and distance for our cosmology; the galaxy number for the whole superclusters, and magnitude limit and the galaxy number for volume limited superclusters; and are density field cluster and group numbers according to paper I; gives the number of Abell clusters in this part of the supercluster that is covered by 2dF survey; the number inside parenthesis is the total number of Abell clusters in this supercluster, by Einasto et al. (2001) list; – number of X-ray clusters; – the mean values of the luminosity density field in superclusters, in units of mean density; – supercluster total luminosity in Solar units.
The present series of papers is devoted to the detailed study of rich superclusters. In the first paper (Einasto et al., 2007d , hereafter RI) we studied the morphology of rich superclusters using Minkowski functionals, and showed that typically, the shapes of rich superclusters can be characterized by a multi-branching filament. In the present paper we shall study galaxy populations in individual rich superclusters. This study continues our studies of the properties of superclusters of galaxies from the 2dF Galaxy Redshift Survey (Einasto et al. 2007a , hereafter Paper I; Einasto et al. 2007b , Paper II; Einasto et al. (2007c , Paper III).
Already early studies of superclusters showed that the properties of galaxies depend on the environment where they reside in (Giovanelli, Haynes and Chincarini gio86 (1986); Einasto and Einasto e87 (1987)). Recently, galaxy populations have been studied in some very rich superclusters (Haines et al. hai06 (2006) – in the Shapley supercluster, Porter and Raychaudhury pr05 (2005) – in the Pisces-Cetus supercluster). However, in these studies the properties of galaxies in rich clusters were studied in the core regions of superclusters only. These studies showed that rich clusters contain a large fraction of passive galaxies, while actively star forming galaxies are located between the clusters.
Our main goal in the present paper is the study of substructures and galaxy populations in the whole superclusters, not in the core regions only. Also we shall compare galaxy populations in different superclusters. We study the density distribution in superclusters. As in the first paper, we shall calculate the Minkowski functionals, but now we apply this method for galaxies from different populations with the aim to compare substructures in superclusters as delineated by galaxies with these populations. This analysis shows whether we can use the Minkowski functionals in studies of galaxy populations. We compare galaxy populations in different superclusters – the overall galaxy content and the distribution of galaxies of different luminosity, colour and spectral type in regions of different density. We also compare the richness and the galaxy content of groups in regions of different density.
The paper is composed as follows. In Section 2 we describe the galaxy data, the supercluster catalogue and the data on the richest superclusters. In Section 3 we study the distribution of environmental densities in superclusters, describe the use of the Minkowski functionals to study the morphology of superclusters, and present the results on supercluster morphology. In Section 4 we compare the properties of galaxies in rich and poor groups, in regions of different global density. We also compare the populations of galaxies in different superclusters. In the last sections we discuss our results and give the conclusions.
2 Data
2.1 Rich supercluster data
As in the previous paper, we used the 2dFGRS final release (Colless et al. col01 (2001); col03 (2003)), and the catalogue of superclusters of galaxies from the 2dF survey (Paper I), applying a redshift limit . When calculating (comoving) distances we used a flat cosmological model with the standard parameters, matter density , and dark energy density (both in units of the critical cosmological density). Galaxies were included in the 2dF GRS, if their corrected apparent magnitude lied in the interval from to . We used weighted luminosities to calculate the luminosity density field on a grid with a cell size of 1 Mpc smoothed with an Epanechnikov kernel of the radius 8 Mpc; this density field was used to find superclusters of galaxies. We defined superclusters as connected non-percolating systems with densities above a certain threshold density; the actual threshold density used was 4.6 in units of the mean luminosity density. A detailed description of the supercluster finding algorithm can be found in Paper I.
In our analysis we also used the data about groups of galaxies from the 2dFGRS (Tago et al. tago06 (2006), hereafter T06). Groups of galaxies were determined using identical FoF parameters independently of the global environment, fixing a certain local number density threshold. Later we will use this division as a local density indicator, to compare the properties of galaxies in various local and global environments. The catalogues of groups and isolated galaxies can be found at http://www.aai.ee/maret/2dfgr.html, the catalogues of observed and model superclusters – at http://www.aai.ee/maret/2dfscl.html.
For the present analysis we select three rich superclusters from the catalogue of 2dF superclusters. Two of them are the richest superclusters in our catalogue: the supercluster SCL126 in the Northern Sky, and the supercluster SCL9 (the Sculptor supercluster) in the Southern Sky, according to the catalogue by Einasto et al. (e2001 (2001), hereafter E01). The third supercluster, SCL10 (the Pisces-Cetus supercluster) in the Southern Sky is relatively nearby. This supercluster was recently studied by Porter and Raychaudhury (pr05 (2005)).
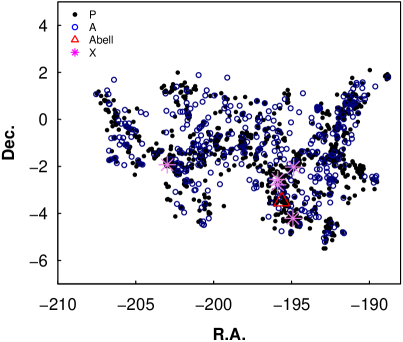
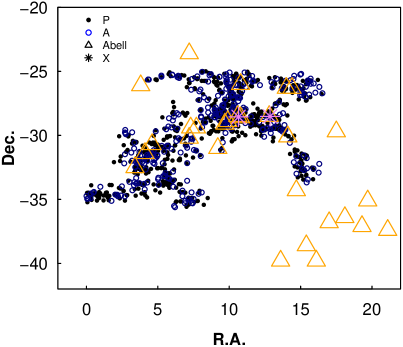
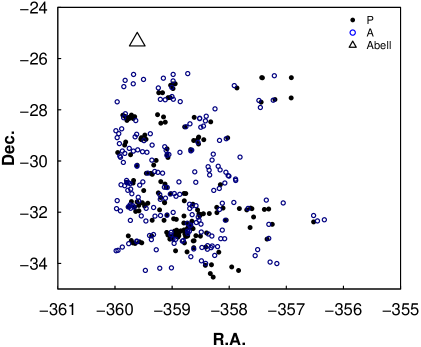

The general data on these superclusters are given in Table LABEL:tab:1. In this Table we give the coordinates and distances of superclusters, the numbers of galaxies, groups and Abell and X-ray clusters in superclusters, the mean values of the luminosity density field in superclusters and their total luminosities (from Paper II). In our morphological analysis we use volume-limited samples of galaxies from these superclusters. The luminosity limits for each supercluster sample are also given in Table LABEL:tab:1. We plot the distribution of galaxies, and Abell and X-ray clusters in Fig. 1
The most prominent Abell supercluster in the Northern 2dF survey is the supercluster SCL126 (in E01, N152 in Paper I) that lies in the direction to the Virgo constellation. This supercluster has been also called the Sloan Great Wall (Vogeley et al. vogeley04 (2004), Gott et al. gott05 (2005), Nichol et al. nichol06 (2006)). In E01 this supercluster contains 7 Abell clusters: A1620, A1650, A1651, A1658, A1663, A1692, A1750. Of these clusters, A1650, A1651, A1663, and A1750 are X-ray clusters.
The richest supercluster in the Southern Sky is the Sculptor supercluster (SCL9 in E01, S34). This supercluster contains also several X-ray clusters, and the largest number of Abell clusters in our supercluster sample, 25. However, only 12 of them are located in the region covered by the 2dF redshift survey. These are: A88, A122, A2751, A2759, A2778, A2780, A2794, A2798, A2801, and A2844, and two X-ray clusters, A2811 and A2829.
Another nearby prominent supercluster in the Southern sky is the Pisces-Cetus supercluster (SCL10 in E01, SCL S5), which contains the rich X-ray cluster, Abell 2734. Only one of 19 Abell clusters from this supercluster, A2683, is located within the 2dF survey boundaries. This supercluster was recently described as a rich filament of Abell clusters by Porter and Raychaudhury (pr05 (2005)).
2.2 Properties of galaxies used in the present analysis
To study the properties of galaxies in superclusters we used the galaxy data as given in the 2dF redshift survey. We characterize galaxies by their luminosity, the spectral parameter and by the colour index (Madgwick et al. ma02 (2002) and 2003a , de Propris et al. depr03 (2003), Cole et al. cole05 (2005)) as follows (see also Paper III). In order to divide galaxies into populations of bright and faint galaxies (B/F) we used a limit . In order to divide galaxies into populations of early and late type galaxies (E/S), we used the spectral parameter limit , for E, for S. More detailed morphological types were defined as follows: Type 1: ; Type 2: ; Type 3: ; Type 4: . Moreover, the spectral parameter is correlated with the equivalent width of the emission line, thus being an indicator of the star formation rate in galaxies. The value corresponds to the population of quiescent galaxies (q) and to star-forming galaxies (SFR). We also used information about colours of galaxies (the rest-frame colour index, to divide galaxies into populations of passive galaxies (P) and actively star forming galaxies (A); for passive (red) galaxies .
3 Substructure in rich superclusters
3.1 Density distribution
We start our study of substructure in superclusters with the analysis of the environmental densities of galaxies in superclusters (defined as the normalised value of the density field at the location of galaxies). This density field was calculated using the Epanechnikov kernel of a radius 8 Mpc (Sec. 2 and Paper I).
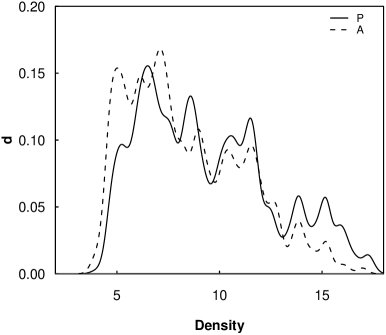
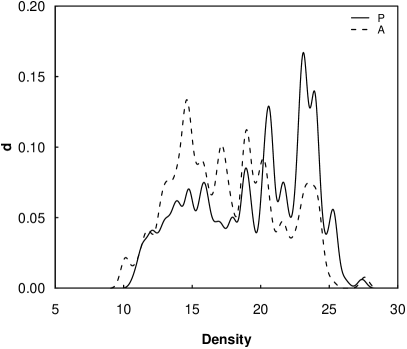
We plot the distribution of environmental densities for observed superclusters in Fig. 2 for passive and actively star forming galaxies (discriminated by the colour index ).
Fig. 2 shows that environmental densities in rich superclusters are rather different: the maximum of densities in the superclusters SCL9 and especially in SCL10 are much larger than in SCL126. The distribution of densities have several maxima and minima – this shows the presence of substructures with different characteristic density in superclusters. The number of substructures in SCL126 is smaller than in SCL9 – an indication that the supercluster SCL126 may be more homogeneous and less clumpy than SCL9. In Sect. 3.2 we shall study this in more detail.
The distribution of environmental densities in the supercluster SCL10 shows, in accordance with Fig. 1, that there is only one high density region in this supercluster (within the 2dF survey region). There is an excess of passive galaxies in this clump or cluster.
Fig. 2 also shows how the maxima and minima in the density distribution are traced by galaxies of different properties. We see that although the overall density distributions for passive and active galaxies are rather similar, there exist several differences between these density distributions. At higher environmental densities there is an excess of passive galaxies, at lower densities – an excess of active galaxies. In the supercluster SCL126 the differences between the density distributions of passive and active galaxies in both high density and the lowest density regions (the core of the supercluster and the outer parts of the supercluster, correspondingly) are larger than in other two superclusters. This is an indication of large-scale morphological segregation in superclusters, which in SCL126 is stronger than in SCL9 and SCL10. Such a segregation can be also found, if we study environmental densities around red and blue galaxies (classified by the spectral parameter ); red galaxies have higher densities around them.
For the analysis of galaxy populations in regions of different density in superclusters we divide superclusters into three regions of different density, according to the location of minima in the density distribution, which separate regions of different environmental densities. The density limits for each region are given in Table LABEL:tab:5.
In the supercluster SCL126 the regions of highest density form two main spatially separate regions. One of them is the main core of the supercluster, containing four Abell clusters (three of them are also X-ray sources). This region has a diameter of about 10 Mpc (Einasto et al. 2003d ). One X-ray cluster in this supercluster, Abell 1750, is located in another region of high density. This cluster is a merging binary cluster (Donelly et al. don (2001); Belsole et al. bel (2004)).
In the supercluster SCL9 the regions of highest density form three main separate concentrations of galaxies. One of them, the main center of SCL9, contains 5 Abell clusters and one X-ray cluster. There are Abell clusters also in two other regions of highest density. However, some Abell clusters are located in regions of lower density, , and one X-ray cluster is located in a region of relatively low density, . In this supercluster the total number of Abell clusters is larger than in the supercluster SCL126, but they do not form such a high concentration of Abell and X-ray clusters that is observed in the core region of SCL126. Most of X-ray clusters in SCL9 are located outside the region covered by the 2dF redshift survey.
In the supercluster SCL10 most Abell clusters remain outside the region covered by the 2dF survey (see also Porter and Raychaudhury pr05 (2005)). The environmental densities of galaxies in this supercluster are rather high.
In general the properties of individual superclusters, including the distribution of environmental densities, vary strongly.
3.2 Minkowski Functionals
Next we study the substructure in the distribution of galaxies from different populations in superclusters using Minkowski functionals This study is of exploratory nature since this is the first time when these functionals are used for studies of galaxy populations. Using Minkowski functionals, we can see in detail how the morphology of superclusters is traced by galaxies of different type.


The supercluster geometry (morphology) is given by their outer (limiting) isodensity surface, and its enclosed volume. When increasing the density level over the threshold overdensity (sect. 2.1), the isodensity surfaces move into the central parts of the supercluster. The morphology and topology of the isodensity contours is (in the sense of global geometry) completely characterized by the four Minkowski functionals – .
For a given surface the four Minkowski functionals are as follows:
-
•
The first, , is the enclosed volume .
-
•
The second, , is proportional to the area of the surface , .
-
•
The third, , is proportional to the integrated mean curvature ,
where and are the two local principal radii of curvature.
-
•
The fourth, , is proportional to the integrated Gaussian curvature (or Euler characteristic) ,
At high (low) densities this functional gives us the number of isolated clumps (voids) in the sample (Martinez et al. 2005; Saar et al. saar06 (2007)).
To obtain the density field for estimating the Minkowski functionals, we used a kernel estimator with a box spline as the smoothing kernel, with the total extent of 16 Mpc (for a detailed description see Saar et al. saar06 (2007) and Paper RI). For the argument labeling the isodensity surfaces, we chose the mass fraction – the ratio of the mass in regions with density lower than the density on the surface, to the total mass of the supercluster. When this ratio runs from 0 to 1, the isosurfaces move from the outside into the center of the supercluster.
In Paper RI we calculated the Minkowski functionals for full superclusters and showed that the fourth Minkowski functional describes well the clumpiness of superclusters. The region of the highest density, , approximately corresponds to the region where the Minkowski functional has a maximum (see Paper RI for details). The morphology of superclusters is characteristic to multibranching filaments.
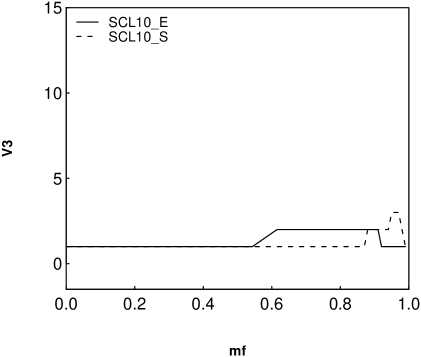
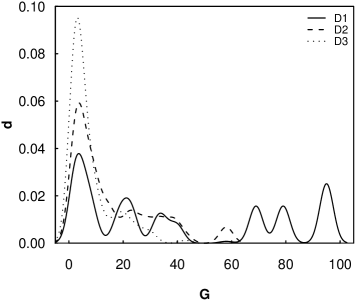
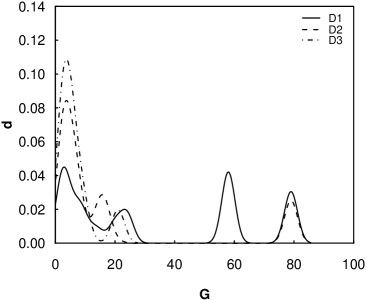
Now we shall find the Minkowski functional for rich superclusters separately for galaxies from different populations, as marked by their luminosity, the spectral parameter and the colour index (Fig. 3).
At small mass fractions the isosurface includes the whole supercluster. As we move to higher mass fractions, the isosurfaces include only the higher density parts of superclusters. Individual high density regions in a supercluster, which at low mass fractions are joined together into one system, begin to separate from each other, and the value of the fourth Minkowski functional () increases. At a certain density contrast (mass fraction) has a maximum, showing the largest number of isolated clumps in a given supercluster. At still higher density contrasts only the high density peaks contribute to the supercluster and the value of decreases again.
Fig. 3 (upper left panel) shows the curves for bright and faint galaxies in the supercluster SCL126. At small values of the mass fraction the values of are small. At a mass fraction the values of of both bright and faint galaxies increase rapidly; for bright galaxies it reaches the value of about 10, while for faint galaxies the value of remains about 5. For the mass fraction interval of about 0.4–0.9 the values of remain almost unchanged. This indicates that the overall morphology of the supercluster SCL126 is rather homogeneous, which is characteristic to a rich filament with several branches (see Paper RI for details). In this supercluster, the distribution of bright galaxies is more clumpy than the distribution of faint galaxies. In other words, bright galaxies are located in rich groups while fainter galaxies form a less clumpy population around them (a population of poor groups and of galaxies not belonging to groups; we shall discuss their distribution in Sect. 4). The peaks of values at very high mass fractions are due to high- density cores in this supercluster.
The values of the fourth Minkowski functional, , for galaxies of different type (Fig. 3, upper middle panel) show that the clumpiness of early type galaxies starts to increase at lower values of the mass fraction . During the mass fraction interval 0.4–0.9 this value changes only a little, and has a peak value at the mass fraction of about 0.9. The distribution of late-type galaxies in this supercluster is much more homogeneous (less clumpy), as show the values of . The number of isolated clumps of these galaxies grows only at rather high mass fraction values, , and has a peak at .
The behaviour of the fourth Minkowski functional for passive (red) galaxies is rather similar to that of early type galaxies. In the case of actively star forming (blue) galaxies we see that these galaxies form some isolated clumps of star forming galaxies already at relatively low mass fraction values, at higher mass fractions some of them do not to contribute to the supercluster any more; the value of decreases and then increases again. At very high values of the mass fraction, , these galaxies again do not to contribute to the supercluster, and the value of decreases rapidly. The value of for passive galaxies is larger than for active galaxies at almost all density levels (mass fraction values). Passive galaxies are typically more strongly clustered than active galaxies, thus their larger clumpiness is expected.
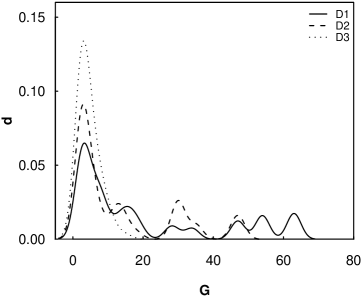
Next let us study the values of for galaxies from different populations in the supercluster SCL9 (Fig. 3, middle panels). Here we see that the curve is rather different from that for SCL126: at small mass fractions, the values of for bright and faint galaxies (left panel) are small, but at a mass fraction value of about 0.4, the values of increase. This increase is more rapid for bright galaxies than for faint galaxies. The values of reach maximum at a mass fraction value of about 0.6, the maximum values of are larger than in the supercluster SCL126. This indicates that the overall morphology of the supercluster SCL9 is more clumpy than that of the supercluster SCL126.
In Paper RI we showed that according to Minkowski functionals, the supercluster SCL9 can be described as a multispider rather than a rich filament, i.e. this supercluster consists of a large number of relatively isolated clumps or cores connected by relatively thin filaments, in which the density of galaxies is too low to contribute to the higher density parts of this supercluster. For the curve this means that the value of increases, reaches a maximum and decreases again.
In the middle panel of Fig. 3 ( for early and late type galaxies) we see, in consistency with the above picture, a continuous increase of the number of isolated clumps as delineated by galaxies of different type, and then a rapid decrease of the number of the clumps. Surprisingly, the distribution of late type galaxies is even more clumpy than the distribution of early type galaxies: at all density levels the value of for early type galaxies (and also for passive galaxies, right panel) is smaller than for late type galaxies (and for active galaxies). This indicates that late type, star-forming galaxies are located in numerous clumps around early type, passive, red galaxies.
Thus what we see here is that differences in the distribution of galaxies from different populations in individual superclusters are related to a different overall morphology of these superclusters.
The values for different galaxy populations in supercluster SCL10 (Fig. 3, lower panels) are consistent with the expectations of a supercluster with one core region (we remind that a bigger part of this supercluster remains outside of our sample boundaries).
3.3 The richness of groups in regions of different density
Groups of galaxies are additional indicators of substructure in superclusters. We divide groups by their richness as follows: rich () groups and clusters (we denote this sample as ) and poor groups (, ). In Table LABEL:tab:5 we give the fractions of galaxies in these groups. To study where the groups of different richness reside inside superclusters we plot the richness of groups, , (see T06) in regions of different density in superclusters (Fig. 4). This figure shows that in regions of high density one can find groups of all richness; the richest groups in superclusters are located mostly in these regions. There are no very rich groups in regions of lower densities, and the richest groups in lower density regions are relatively poor.
| SCL126 | SCL9 | SCL10 | |||||||||||
| (1) | (2) | (3) | (4) | (5) | (6) | (7) | (8) | (9) | (10) | (11) | (12) | (13) | (14) |
| Region | -19.50 | ||||||||||||
| Dlim | 12.0 | 8.0 | 12.0 | 9.0 | 21.0 | 16.0 | |||||||
| Ngal | 234 | 501 | 573 | 342 | 264 | 570 | 239 | 271 | 247 | ||||
| F | 0.29 | 0.41 | 0.53 | 0.40 | 0.41 | 0.59 | 0.24 | 0.19 | 0.43 | ||||
| F | 0.57 | 0.34 | 0.17 | 0.40 | 0.29 | 0.05 | 0.54 | 0.30 | 0.11 | ||||
| 1.65 | 2.77 | 1.81 | 1.28 | 1.87 | 1.96 | 2.35 | 2.81 | 1.54 | 0.84 | 1.22 | 0.83 | 0.59 | |
| 3.54 | 4.54 | 3.28 | 3.00 | 4.02 | 3.65 | 4.07 | 5.42 | 1.15 | 1.75 | 1.76 | 1.87 | 1.45 | |
| 1.48 | 1.87 | 1.61 | 1.33 | 1.74 | 2.03 | 2.05 | 2.72 | 1.85 | 0.71 | 1.00 | 0.73 | 0.58 | |
| 0.89 | 1.21 | 1.08 | 0.71 | 0.91 | 1.30 | 1.11 | 1.79 | 1.20 | 0.45 | 0.50 | 0.44 | 0.44 | |
| 3.43 | 4.82 | 3.69 | 2.87 | 4.25 | 4.29 | 5.26 | 6.11 | 3.37 | 1.60 | 3.06 | 1.73 | 1.09 | |
| 7.98 | 8.50 | 7.55 | 8.09 | 10.14 | 7.64 | 10.42 | 10.01 | 2.11 | 3.58 | 4.29 | 3.13 | 2.37 | |
| 3.11 | 3.93 | 3.19 | 2.92 | 3.78 | 4.24 | 4.83 | 5.75 | 3.07 | 1.33 | 2.72 | 1.28 | 1.06 | |
| 1.95 | 1.59 | 2.29 | 1.81 | 2.35 | 3.23 | 2.53 | 4.57 | 3.12 | 0.98 | 2.00 | 0.76 | 0.88 | |
| 2.53 | 3.98 | 2.85 | 1.95 | 2.77 | 2.45 | 2.76 | 3.63 | 1.95 | 1.25 | 2.46 | 1.05 | 0.83 | |
| 5.44 | 7.37 | 6.17 | 3.35 | 6.21 | 4.46 | 5.00 | 6.00 | 1.55 | 3.55 | 4.65 | 2.67 | 2.38 | |
| 2.39 | 2.63 | 2.69 | 2.18 | 2.58 | 2.54 | 2.34 | 3.36 | 2.42 | 0.98 | 1.32 | 0.99 | 0.83 | |
| 1.35 | 1.58 | 1.47 | 1.23 | 1.43 | 1.67 | 1.48 | 2.71 | 1.46 | 0.68 | 1.47 | 0.52 | 0.59 | |
| 0.44 | 0.38 | 0.44 | 0.46 | 0.75 | 0.90 | 0.98 | 0.76 | 0.93 | 0.07 | 0.09 | 0.04 | 0.09 | |
| 0.52 | 0.48 | 0.50 | 0.61 | 0.85 | 0.96 | 1.00 | 0.97 | 0.75 | 0.06 | 0.06 | 0.06 | 0.08 | |
| 0.41 | 0.32 | 0.45 | 0.49 | 0.71 | 0.88 | 1.01 | 0.82 | 0.99 | 0.07 | 0.16 | 0.04 | 0.11 | |
| 0.33 | 0.14 | 0.35 | 0.34 | 0.56 | 0.76 | 0.81 | 0.53 | 0.84 | 0.04 | 0.06 | 0.01 | 0.05 |
The columns in the Table are as follows: column 1: Population ID and number ratio type. Dlim – the density limit, Ngal – the number of galaxies in a given density region, F – the fraction of galaxies in poor groups with 2–9 member galaxies, F – the fraction of galaxies in rich groups with at least 10 member galaxies. – the ratio of the numbers of early and late type galaxies, the number of quiesent and star-forming galaxies, – the ratio of the numbers of passive and active galaxies, – the ratio of the numbers of bright () and faint () galaxies. The subheaders are: – all galaxies, – rich groups, – poor groups, – isolated galaxies.
Columns 2–6: the ratio of the numbers of galaxies in given populations in the supercluster SCL126. – all galaxies, – – galaxies in these density regions, – all galaxies brighter than . Columns 7–10 and 11–14: the same ratios in similar populations in the superclusters SCL9 and SCL10 (without the column ).
4 Populations of galaxies in rich superclusters


Next we compare the statistical properties of populations of galaxies in superclusters. We plot in Fig. 5 the values of the spectral parameter and the colour index of all supercluster galaxies. In this figure we also plot the values of and used to divide galaxies into populations of early and late type galaxies, and into passive and actively star forming galaxies. Fig. 5 shows that galaxies from different superclusters populate the – diagram in a somewhat different manner. In the supercluster SCL126 red and passive galaxies dominate (the lower right part of the figure). The fraction of blue galaxies with the colour index and the fraction of galaxies of type 4 (the spectral parameter , Sec. 2.3) in this supercluster is very small. In the supercluster SCL9 the most red galaxies have larger colour indices and smaller spectral parameters than in the supercluster SCL126 – the reddest galaxies in our sample reside in the supercluster SCL9. Furthermore, the fraction of blue galaxies with the colour index and the fraction of galaxies of type 4 (the spectral parameter ) in this supercluster is even smaller than in the supercluster SCL126.
In the supercluster SCL10 the populations of galaxies are different: there are only a few very red, early type galaxies in this supercluster. The fraction of blue, late type, star forming galaxies in this supercluster is larger than the fraction of these galaxies in the superclusters SCL126 and SCL9.
Now let us study in more detail where galaxies of different populations reside within superclusters. For that, we compare the galaxy populations in rich and poor groups and those not in any group. We divide the groups by their richness as follows: rich groups (, ), poor groups (, ), and isolated galaxies (those galaxies in rich superclusters which do not belong to any group, ). We shall use the group richness as a local density indicator, to compare the properties of galaxies in various local environments (Paper III). To see whether the galaxy populations depend also on the global density in superclusters, we further divide groups by their environmental density , and .
We plot the differential luminosity functions and the distributions of the spectral parameter and the colour index for galaxies in groups of different richness in Fig. 6. In Table LABEL:tab:5 we present the ratios of the numbers of bright and faint galaxies in superclusters, and the ratios of early and late type galaxies , as classified by the spectral parameter . We also calculate the ratio of the numbers of passive galaxies and actively star forming galaxies , using the spectral parameter , and the ratio , classified by the color index . In this Table we also give the ratios of the numbers of galaxies of different type in the supercluster SCL126 for the magnitude limit , for comparison with SCL9.

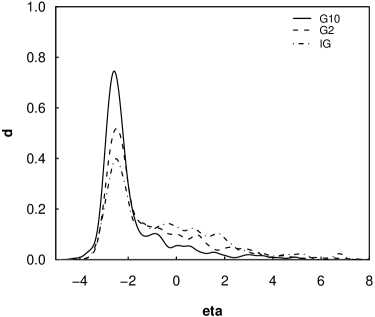
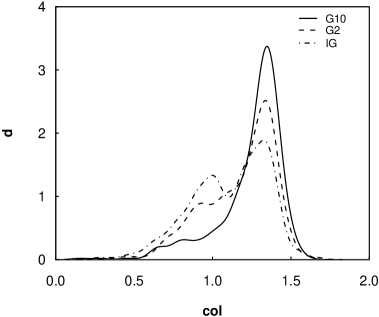

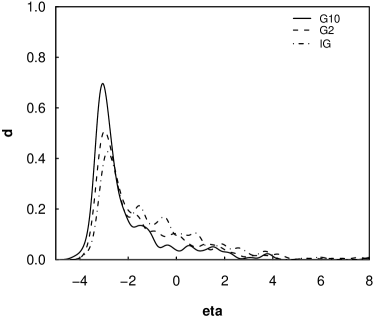
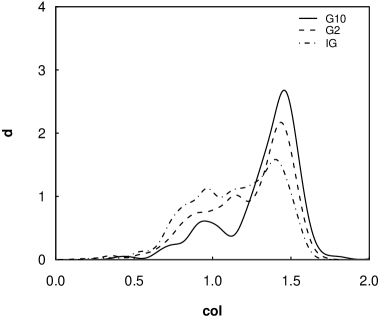

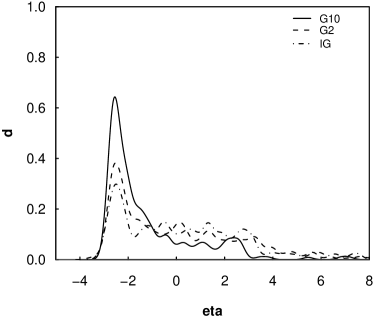
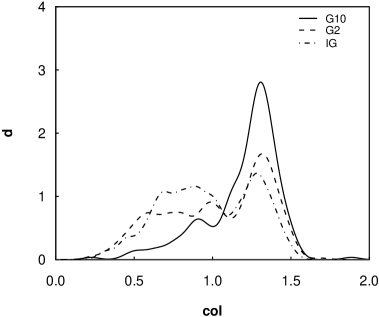
Fig. 6 (upper row) shows the galaxy populations in groups of different richness in the supercluster SCL126. We see that the brightest galaxies reside in rich groups. Also, there are relatively more early type, red galaxies in rich groups than in poor groups or among isolated galaxies. Both the spectral parameter and the colour index indicate that the fraction of star-forming galaxies increases, as we move from higher local densities (rich groups) to lower local densities (poor groups and those galaxies which do not belong to groups). In addition, Table LABEL:tab:5 shows that the fraction of early type, red, passive galaxies in rich groups is the largest in the highest density region, , and the lowest in rich groups of the lowest density region, . In the high density region among those galaxies which do not belong to groups, there is a larger percentage of passive, non-star-forming, red galaxies, than among isolated galaxies in the lower density regions.
In other words, the whole high-density core of this supercluster contains relatively more passive, red, early-type galaxies than the lower-density region, where there are more blue, star-forming galaxies. This shows that both the local (group/cluster) and the global (supercluster) environments are important in influencing types, colours and star formation rates of galaxies.
Earlier studies (Davis & Geller dg76 (1976); Dressler d80 (1980); Phillips et al. phill98 (1998); Norberg et al. n01 (2001), n02 (2002); Zehavi et al. zehavi02 (2002); Goto et al. go03 (2003); Hogg et al. hogg03 (2003), hogg04 (2004); Balogh et al. balogh04 (2004); De Propris et al. depr03 (2003); De Propris et al. depr04 (2004); Madgwick et al. 2003b ; Croton et al. cr05 (2005); Blanton et al. blant04 (2004), blant06 (2006) among others) have shown the difference between galaxy populations in clusters and in the field. Our calculations show that this difference exists also between the core regions and the outer regions of rich superclusters (see also Paper III).
Now let us study the distribution of galaxies from different populations in the supercluster SCL9 (Fig. 6, middle row). We see, in accordance with the data about SCL126, that the fraction of the brightest galaxies, as well as the fraction of early type, red galaxies is the largest in rich groups and the smallest among those galaxies which do not belong to groups. However, when we compare the galaxy content of groups from this supercluster in regions of different density, – (Table LABEL:tab:5), we see that in this supercluster the fraction of early type, red galaxies is the largest in the region of intermediate density, . This may be due to the presence of X-ray clusters in this region, which affect the galaxy content (see also Hilton et al. hil05 (2005) and Paper III). Also, since the 2dF survey covers only a part of this supercluster, the density in this region may be underestimated.
However, the most interesting feature seen in this Figure and in Table LABEL:tab:5 is the striking difference between the galaxy properties in the superclusters SCL126 and SCL9. In Table LABEL:tab:5 we gave the ratios of the numbers of galaxies of different type in the supercluster SCL126 also for the magnitude limit , in order to compare these ratios with those calculated for the supercluster SCL9. Our calculations show that in the supercluster SCL126 the ratio of the numbers of red and blue galaxies for the magnitude limit is 2.77, while for the same magnitude limit in SCL 9 this value is 2.45. The fraction of red galaxies in SCL126 is the largest in rich groups – 7.37 in the region , while in the region of SCL9 this value is 6.00, which is the largest value in SCL9. The differences between the fractions of the numbers of early and late type galaxies, as well as between the fractions of quiescent and actively star forming galaxies (classified by the spectral parameter ) in the superclusters SCL126 and SCL9 are smaller; these fractions are even slightly larger in SCL9 than in SCL126, but in the rich groups of SCL126 the fraction of both early type galaxies and quiescent galaxies is much larger than in the rich groups of SCL9.
Fig. 6 demonstrates that differences between galaxy populations of the superclusters SCL126 and SCL9 are even larger than the ratios in Table LABEL:tab:5 show. In SCL9 there are more blue galaxies than in SCL126. This difference in seen among the galaxies in groups and among those galaxies which do not belong to groups. Furthermore, in SCL9 there is a small fraction of extremely red galaxies which are absent in SCL126. It is difficult to ascribe these differences between galaxy populations to selection effects due to the different distances of these superclusters – in that case we should expect that in the supercluster SCL126 the fraction of early type, passive galaxies should be smaller than in SCL9, which is opposite to our results.
The brightest galaxies in SCL126 have larger luminosities than those in SCL9. Also, in SCL126 there is a large difference between the luminosities of the brightest galaxies in rich and poor groups, this difference in SCL9 is much smaller.
The populations of galaxies in the supercluster SCL10 are again somewhat different. There are more late type spiral and irregular galaxies here (with large values of ), and more blue galaxies (with small values of ), both among the galaxies in groups and among isolated galaxies (especially in regions of lower global density) in this supercluster than in the other two rich superclusters studied in this paper. In this supercluster, the luminosity of the brightest galaxies in rich and poor groups is similar, but, overall, the luminosities of the brightest galaxies in this supercluster are lower than the luminosities of the brightest galaxies in SCL126 and SCL9.
One reason of the differences between the galaxy populations of the supercluster SCL10 and other superclusters is, of course, the influence of the lower luminosity limit used for this supercluster in our study. However, this does not explain why there are no very luminous galaxies, and also no very red galaxies in this supercluster (Fig. 5). The reason for this may be the following: in the case of SCL10 most of its rich (Abell) clusters lie outside of the 2dF survey volume (Table 1). As the reddest, early type, very bright galaxies reside in rich clusters, the reason why we do not see these galaxies may be that these rich clusters lie outside the survey limits. Thus, in the case of this supercluster, we actually study the populations of galaxies located in the outer parts of the supercluster. These galaxies are fainter, thus due to the luminosity limits, we see in other superclusters a smaller fraction of these galaxies.
Our data show that galaxy populations in superclusters depend both on the local and global densities. For example, even in rich groups the fraction of blue, star-forming galaxies in the region is larger than in the region . The same can be said for the spectral parameter – the fraction of late-type galaxies (types 2–4) in the region is larger than in the region . The Kolmogorov-Smirnov test shows that the differences between the distributions of colour indices of galaxies from regions of different density in all superclusters (with two exceptions) are statistically significant at least at the 99% confidence level. In the supercluster SCL9 these differences between the galaxies from the density regions and , and in the supercluster SCL10 from the density regions and are statistically significant at least at the 87% confidence level.
5 Discussion
5.1 Comparison with other very rich superclusters
The richest relatively nearby superclusters are the Shapley Supercluster (Proust et al. proust06 (2006), Bardelli et al. bar00 (2000), Quintana, Carraso and Reisenegger qui00 (2000) and references therein) and the Horologium–Reticulum Supercluster (Rose et al. rose02 (2002), Fleenor et al. fleenor05 (2005), Einasto et al. 2003d ).
The Shapley Supercluster contains 28 Abell clusters, 8 X-ray clusters among them, and one non-Abell X-ray cluster according to the catalogue by Einasto et al. (e2001 (2001)). Proust et al. (proust06 (2006)) list over 40 rich clusters of galaxies in the redshift range of the Shapley supercluster, and an overdensity of about 5.4. The spatial extent of this supercluster is over 100 Mpc and Proust et al. estimate that the total mass of the Shapley supercluster is at least . The main core of this supercluster contains at least two Abell clusters and two X-ray groups, and the overdensity of galaxies in the central region is at least 11 (Bardelli et al. bar00 (2000)). The differences between the various density estimates are due to different methods used, and to different scales at which overdensities are estimated.
Haines et al. (hai06 (2006)) demonstrated that the colours of galaxies in the core region of the Shapley supercluster depend on their environment, with redder galaxies being located in clusters. They also found a large amount of faint blue galaxies between the clusters.
Another prominent supercluster is the Horologium–Reticulum supercluster in the Southern Sky. This supercluster contains 35 Abell clusters, 10 X-ray clusters among them, and one non-Abell X-ray cluster (Einasto et al. e2001 (2001)). This supercluster is a dominant structure in all the Southern slices of the Las Campanas Redshift Survey (Einasto et al. 2003d ). The Horologium–Reticulum supercluster has been studied in detail by Rose et al. (rose02 (2002)) and Fleenor et al. (fleenor05 (2005)). This supercluster contains three concentrations of clusters, groups and galaxies, which are connected by filaments of galaxies and groups. The spatial extent of this supercluster is over 100 Mpc, and the mean overdensity of galaxies is about 3 (Fleenor et al. (fleenor05 (2005)). Fleenor et al. estimated that the total mass of the Horologium–Reticulum supercluster may be of the same order as the total mass of the Shapley supercluster.
The richest superclusters in our sample are the superclusters SCL126 and SCL9. Of these two, the supercluster SCL9 (the Sculptor supercluster) is comparable to the Shapley and the Horologium-Reticulum superclusters, both by their size and by the number of rich clusters in it. In the Sculptor supercluster there are 6 X-ray clusters. In addition, Zappacosta et al. (zap04 (2005)) cross-correlated ROSAT observations with the galaxy density map in this supercluster and found evidence about the presence of warm-hot diffuse gas which is associated with the intercluster galaxy distribution.
If we assume that the mean mass-to-light ratio is about 400 (in solar units), then we can estimate the masses of the richest superclusters of our sample, using estimates of the total luminosity of the superclusters (Table LABEL:tab:1): , . These estimates are lower limits only, since the 2dF survey does not fully cover these superclusters.
The supercluster SCL10 was recently studied by Porter and Raychaudhury (pr05 (2005)), using data about Abell clusters, galaxy groups (by Eke et al. eke04 (2004)) and galaxies in this supercluster. They estimate that the total mass of the Pisces-Cetus supercluster is at least ; the spatial extent of this supercluster is more than 100 Mpc (Jaaniste et al. ja98 (1998)). Porter and Raychaudhury determined also the star formation rates for galaxies in groups in this supercluster, according to the spectral index . They concluded that galaxies in rich clusters have lower star formation rates than galaxies in poor groups in agreement with our results. In another paper Porter and Raychaudhury demonstrated that in the filament between the clusters in this supercluster the fraction of star forming galaxies is higher at larger distance from clusters than close to clusters (Porter and Raychaudhury pr06 (2007)). At the same time our analysis shows that in the regions and of this supercluster the fraction of actively star forming galaxies among those galaxies which do not belong to groups is the highest among the superclusters studied in this paper. This is probably a reflection of the same result as obtained by Porter and Raychaudhury.
Gray et al. (gray04 (2004)) studied the supercluster A901/902 and detected strong evidence that the highest density regions in clusters are populated mostly with quiescent galaxies, while star forming galaxies dominate in outer/lower density regions of clusters.
Our present data reveals the dependency of the properties of galaxies in superclusters on both the local density (as shown also by the 2DF team) and on the global density (see also Paper III and references therein).
5.2 Properties of groups in superclusters
We showed that groups in high-density cores of superclusters are richer than groups in low-density regions of superclusters. In high-density cores of superclusters, groups contain relatively more passive, red, early-type galaxies than the groups in lower-density regions in superclusters, where there are relatively more blue, star-forming galaxies. Therefore, both the richness of a group and its galaxy content depend on the large scale environment where it resides.
Plionis (pl04 (2004) and references therein) showed that the dynamical status of groups and clusters of galaxies depends on their large-scale environment. Here we show that also the richness of a group and its galaxy content depend on the large-scale environment. The first of these effects was described as an environmental enhancement of group’s richness in Einasto et al. (2003c ) and (2003d ).
5.3 Substructures and galaxy populations in superclusters – evidence about differences of their formation and evolution?
We showed that there exist several differences between the properties of individual rich superclusters, which cannot be explained by selection effects only. The overall structure of the supercluster SCL126 resembles a rich filament with several branches and a smaller number of substructures than in the supercluster SCL9, which resembles a multispider having a number of clumps connected by relatively thin filaments.
The supercluster SCL126 has a very high density core with several Abell and X-ray clusters in a region with dimensions less than 10 Mpc (see also Einasto et al. 2003d ). Such very high densities of galaxies have been observed so far only in a very few superclusters. Among them are the Shapley supercluster (Bardelli et al. bar00 (2000)), the Aquarius supercluster (Caretta et al. car02 (2002)), and the Corona Borealis supercluster (Small et al. small98 (1998)). A very small number of such a high density cores of superclusters is consistent with the results of N-body simulations which show that such high density regions (the cores of superclusters that may have started the collapse very early) are rare (Gramann & Suhhonenko gra02 (2002)). The fraction of early type, passive, non-star-forming galaxies in the core region of the supercluster SCL126 is very high, both in groups and among those galaxies which do not belong to groups. This indicates that the properties of galaxies and their evolution history have been affected by both local and global densities in superclusters.
In the supercluster SCL126 the fraction of blue, actively star forming galaxies is smaller than in the supercluster SCL9, especially in its high density core. This, together with the presence of a high density core and overall more homogeneous structure than in the supercluster SCL9 may be an indication that the supercluster SCL126 has formed earlier (is more evolved dynamically by the present epoch) than the supercluster SCL9.
6 Conclusions
We used a catalogue of superclusters of galaxies for the 2dF Galaxy Redshift Survey to study the internal structure and galaxy populations of the richest superclusters. Our main conclusions are the following.
-
•
We study substructures in superclusters using their detailed density distributions and the fourth Minkowski functional, . We show that substructures in different superclusters differ strongly. Large differences are seen also in a way how substructures are delineated by galaxies from different populations.
-
•
The values of the fourth Minkowski Functional , which contain information about both local and global morphology, show the clumpiness of superclusters as determined by galaxies from different populations.
-
•
In the supercluster SCL126 the number of clumps in the distribution of red, passive galaxies is larger than the number of clumps determined by blue, star-forming galaxies – such galaxies surround the high-density regions rather uniformly. In the supercluster SCL9 the values of are different, indicating that star-forming galaxies are located in numerous small clumps around passive galaxies, which are located preferentially in rich groups and clusters.
-
•
Groups in high-density cores of superclusters are richer than in lower-density (outer) regions of superclusters. In high-density cores, groups contain relatively more passive, red, early-type galaxies than the groups in lower-density regions in superclusters, where there are more blue, star-forming galaxies. Therefore, both the richness of a group and its galaxy content depend on the large scale environment where it resides.
-
•
In the high density cores of all rich superclusters, even among those galaxies which do not belong to galaxy clusters, there is a large fraction of passive, non-star-forming, red galaxies. Among the isolated galaxies in the lower density supercluster regions, the red galaxy fraction is much lower.
-
•
Unexpectedly, we found that there are several differences between the galaxy populations of different superclusters, which cannot be explained by selection effects only. In particular, the supercluster SCL126 contains a larger fraction of early type, red, passive galaxies than the supercluster SCL9, especially in its high density core region.
-
•
In the supercluster SCL9 there is a population of very red and early type galaxies, which reside in the richest groups of region of high (but not the highest) global density. Such very red galaxies are absent in SCL 126.
-
•
In SCL126, the most luminous galaxies in rich groups have much larger luminosities than most luminous galaxies in poor groups, while in SCL9 and SCL10 the luminosity of the brightest galaxies in rich and poor groups is comparable.
-
•
The presence of a high density core with X-ray clusters and a relatively small fraction of star-forming galaxies in the supercluster SCL126 may be an indication that this supercluster has been formed earlier (is more advanced dynamically) than SCL9.
-
•
In SCL10 there are no very bright galaxies, as well as no very red and very early type galaxies. Also, there are relatively more star-forming, late type, blue galaxies than in the larger superclusters SCL126 and SCL9. This may be partly due to selection effects, but partly it may be due to the fact that the 2dF survey, our base data sample, does not cover this supercluster in full.
Our study indicates the importance of the role of superclusters as a high density environment, which affects the properties of their member galaxies and the groups/clusters of galaxies that constitute the supercluster.
The forthcoming Planck satellite observations will determine the anisotropy of the cosmic background radiation with unprecedented accuracy and angular resolution. As a by-product, Planck measurements will provide an all-sky survey of massive clusters via the Sunyaev-Zeldovich (SZ) effect. For the Planck project, detailed information of supercluster properties is important, helping to minimize anomalies in CMB maps at low multipoles. These anomalies are partly caused by imprints of local superclusters, especially of their cores, on the SZ-signals. As continuation of the present work, we are preparing supercluster catalogues for the Planck community.
Acknowledgements.
We are pleased to thank the 2dFGRS Team for the publicly available data releases. We thank Tõnu Viik for helpful suggestions. The present study was supported by the Estonian Science Foundation grants No. 6104 and 7146, and by the Estonian Ministry for Education and Science research project TO 0060058S98. This work has also been supported by the University of Valencia through a visiting professorship for Enn Saar and by the Spanish MCyT project AYA2003- 08739-C02-01 (including FEDER). J.E. thanks Astrophysikalisches Institut Potsdam (using DFG-grant 436 EST 17/4/06), and the Aspen Center for Physics for hospitality, where part of this study was performed. PH and PN were supported by Planck science in Metsähovi, Academy of Finland. In this paper we have used R, a language for data analysis and graphics (Ihaka & Gentleman ig96 (1996)).References
- (1) Balogh, M., Eke, V., Miller, C., et al. 2004, MNRAS, 348, 1355
- (2) Bardelli, S., Zucca, E., Zamorani, G., Moscardini, L., Scaramella, R., 2000, MNRAS, 312, 540
- (3) Caretta, C.A., Maia, A.G., Kawasaki, W., & Willmer, C.N.A. 2002, AJ, 123, 1200
- (4) Belsole, E., Pratt, G.W., Sauvageot, J.-L-., Bourdin, H. 2004, AA, 415, 821
- (5) Blanton, M.R., Eisenstein, D., Hogg, D.W., et al. 2004a, ApJ, 629, 143
- (6) Blanton, M.R., Eisenstein, D., Hogg, D.W., et al. 2006, ApJ, 645, 977
- (7) Cole, S., Percival, W.J., Peacock, J.A., et al. 2005, MNRAS,362, 505
- (8) Colless, M.M., Dalton, G.B., Maddox, S.J., et al. 2001, MNRAS, 328, 1039
- (9) Colless, M.M., Peterson, B.A., Jackson, C.A., et al. 2003, (astro-ph/0306581)
- (10) Croton, D.J., Farrar, G.R., Norberg, P., et al. 2005, MNRAS, 356, 1155
- (11) Davis, M., & Geller, M.J. 1976, ApJ, 208, 13
- (12) De Propris, R., et al. (2dF GRS Team) 2003, MNRAS, 342, 725
- (13) De Propris, R., et al. (2dF GRS Team) 2004, MNRAS, 351, 125
- (14) Donelly, R. H., Forman, W., Jones, C., et al. 2001, ApJ, 562, 254
- (15) Dressler, A., 1980, ApJ 236, 351
- (16) Einasto, J., Einasto, M., Tago, E. et al. 2007a, A&A, 462, 811 (Paper I)
- (17) Einasto, J., Einasto, M., Saar, E. et al. 2007b, A&A, 462, 397 (Paper II)
- (18) Einasto, M., Einasto, J., Tago, E. et al. 2007c, A&A, 464, 815 (Paper III)
- (19) Einasto, M., & Einasto, J., 1987, MNRAS, 226, 543 (E87)
- (20) Einasto, M., Einasto, J., Müller, V., Heinämäki, P., Tucker, D.L. 2003c, AA 401, 851
- (21) Einasto, M., Einasto, J., Tago, E., Müller, V. & Andernach, H., 2001, AJ, 122, 2222 (E01)
- (22) Einasto, M., Jaaniste, J., Einasto, J., et al. . 2003d, AA 405, 821
- (23) Einasto, M., Saar, E., Liivamäg, L. J. et al., 2007d, A&A, (submitted) (RI)
- (24) Eke, V. R., Baugh, C. M., Cole, S., et al. 2004, MNRAS, 348, 866
- (25) Fleenor, M.C., Rose, J.A., Christiansen, W.A. et al. 2005, AJ, 130, 957
- (26) Giovanelli, R., Haynes, M.P., Chincarini, G. L., 1986, ApJ, 300, 77
- (27) Goto, T, Okamura, S., Sekiguchi, M., et al. 2003, PASJ, 55, 757
- (28) Gott, J.R., Juric, M., Schleger, D. et al. 2005, ApJ, 624, 463
- (29) Gramann, M. & Suhhonenko, I. 2002, MNRAS, 337, 1417
- (30) Gray, M.E., Wolf, C., Meisenheimer, K. et al. 2004, MNRAS,347, L73
- (31) Haines, C.P., Merluzzi, P., Mercurio, A., et al. 2006, MN, 371, 55
- (32) Hilton, M., Collins, C., De Propris, R. et al., MNRAS 363, 661
- (33) Hogg, D.W., Blanton, M.R., Brinchmann, J., et al. 2004, ApJ, 601, L29
- (34) Hogg, D.W., Blanton, M.R., Eisenstein, D.J. et al. 2003, ApJ, 585, L5
- (35) Ihaka, R., & Gentleman, R., 1996, J. of Computational and Graphical Statistics, 5, 299
- (36) Jaaniste, J., Tago, E., Einasto, M. et al. 1998, A&A, 336, 35
- (37) Madgwick, D.S., et al. (the 2dFGRS Team), 2002, MNRAS, 333, 133
- (38) Madgwick, D.S., Somerville, R., Lahav, O., Ellis, R., 2003a, MNRAS, 343, 871
- (39) Madgwick, D.S., Hawkins, E., Lahav, O., et al., 2003b, MNRAS, 344, 847
- (40) Martínez, V.J., Starck, J.-L., Saar, E., et al., 2005, ApJ, 634, 744
- (41) Nichol, R.C., Sheth, R.K., Suto, Y., et al. 2006, MNRAS, 368, 150
- (42) Norberg, P., Baugh, C.M., Hawkins, E., et al. 2001, MNRAS, 328, 64
- (43) Norberg, P., Baugh, C.M., Hawkins, E., et al. 2002, MNRAS, 332, 827
- (44) Phillipps, S., Driver, S.P., Couch, W.J., Smith, R.M. 1998, ApJL, 498, L119
- (45) Plionis, M, 2004, In ”Outskirts of galaxy clusters: intense life in the suburbs”. Proceedings IAU Colloquium No. 195, 2004, ed. A. Diaferio
- (46) Porter, S.C. & Raychaudhury, S. 2005, MNRAS, 364, 1387
- (47) Porter, S.C. & Raychaudhury, S. 2007, MNRAS, 375, 1409
- (48) Proust, D., Quintana, H., Carrasco, E.R. et al. 2006, A&A, 447, 133
- (49) Quintana, H., Carrasco, E.R., Reisenegger, A., 2000, AJ, 120, 511
- (50) Rose, J.A., Gaba, A.E., Christiansen, W.A., et al., 2002, AJ, 123, 1216
- (51) Saar, E., Martínez, V.J., Starck, J.-L., Donoho, D.L., 2007, MN, 374, 1030
- (52) Small, T.A., Ma, C.-P., Sargent, W.L.W., and Hamilton, D., 1998, ApJ, 492, 45
- (53) Tago, E., Einasto, J., Saar, E. et al. 2006, AN, 327, 365 (T06)
- (54) Vogeley, M.S., Hoyle, F., Rojas, R.R. et al. 2004, In ”Outskirts of galaxy clusters: intense life in the suburbs”. Proceedings IAU Colloquium No. 195, 2004, ed. A. Diaferio
- (55) Zappacosta, L., Maiolino, R., Mannucci, F., Gilli, R., Schuecker, P., 2005, MN, 357, 929
- (56) Zehavi, I., Blanton, M. R., Frieman, J. A., et al. 2002, ApJ, 571, 172