Calculation of the Underground Muon Intensity Crouch Curve
from a Parameterization of the Flux at Surface
Abstract
Utilizing only the vertical muon intensity of the Gaisser parameterization of the muon flux at the surface and propagating this energy spectrum underground according to statistical ionization and radiative energy losses, it is possible to calculate the underground muon intensity Crouch curve. In addition, the primary spectral index of the Gaisser parameterization can be adjusted from to simply by minimizing the deviation from the Crouch curve. For chemical compositions other than standard rock, the propagation of the spectrum underground can be repeated with a different muon energy loss in the material. The resulting underground muon intensity curve represents a consistent conversion of the Crouch curve to the local rock, fully accounting for the energy dependence of the muon .
1 Gaisser Parameterization of Muon Flux at Surface
The Gaisser parameterization of the cosmic induced muon flux at surface is an approximate extrapolation formula valid when muon decay is negligible ( GeV) and the underground detector zenith angle can be assumed identical to the production angle in the upper atmosphere (). Not including small contributions from charm and heavier flavors, which are negligible for energies below TeV, the Gaisser parameterization is [1][2],
where the two terms give the contribution of pions and charged kaons. The energy spectrum steepens gradually to reflect the primary spectrum in the GeV range, and steepens further at higher energies because pions with critical energy GeV tend to interact in the atmosphere before they decay. Asymptotically (TeV), the energy spectrum of atmospheric muons is one power steeper () than the primary spectrum (). For the following calculations we only consider the vertical muon intensity for which .
2 Muon Range Underground
The statistical energy loss of muons, traversing an amount of matter, with energies far above the Bethe-Bloch minimum is given as
| (2) |
where is the collisional term (i.e. ionization mostly due to delta-ray production) and the second term accounts for the three radiative muon energy loss processes: 1. Bremsstrahlung, 2. pair production and 3. photonuclear interactions. In Table 1 these energy loss parameters are listed for standard rock. The critical energy where ionization losses equal radiative losses in standard rock is approximately TeV. As the energy dependencies of the and parameters are relative mild, they are often assumed to be constant and the then resulting simplified differential equation can be easily solved by using an exponential function [2]. However, for our purpose of precisely determining the average muon range underground for each value of surface energy, the and values are parameterized with the following functions
| (3) | |||||
| (4) | |||||
Table 2 lists the fitted coefficients for standard rock. In
addition, a Geant4 [4] based simulation is performed, tracking muons through a
block of standard rock, defined as a mixture of and
(with a density of and mass fractions of O, Ca,
C and Mg). The comparison for the simulated
parameter as a function of energy and the parameterization in Eq. 4 validates
that the fractional difference is less than over the entire energy
range.
We used Eq. 2 to numerically compute
the propagation of the muon
by stepping ()
through standard rock. Thus, for each initial value of muon energy,
we
determined, at what value of depth in meter-water-equivalent the
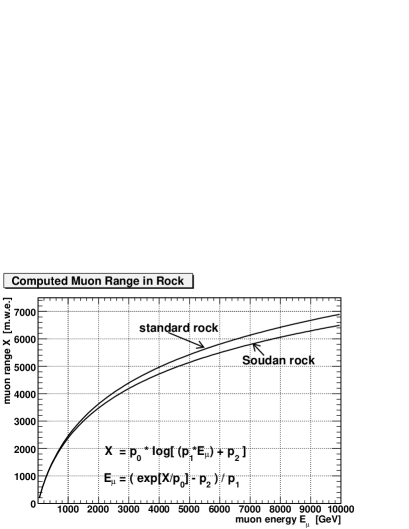
muon ranges out. Fig. 1 shows the computed muon range in
of standard rock as a function of muon surface energy from GeV to
TeV. Finally, the muon range in standard rock can be simply
parameterized as
| (5) |
with the fitted parameters listed in Table 3.
The same computation can be done for overburdens made up of other rock compositions like e.g. for more dense rock () at the Soudan iron mine in northern Minnesota, US (c.f. again Fig. 1 and Table 3). In order to easily transform the muon energy loss parameters and in standard rock (average nuclear properties , [2]) to and in other rock (e.g. Soudan , [5]), the and total parameter at a given muon energy can be scaled as
| (6) | |||||
| (7) | |||||
The muon energy loss from Bremsstrahlung and pair production can be scaled with to the first order [5], whereas the simulated contribution from photonuclear interactions to has only a very weak dependence on the nuclear properties in rock and is herein assumed constant per . Furthermore, the MC simulation shows that in the region of interest from GeV to TeV the photonuclear interactions account for a constant fraction () of all radiative muon energy losses in standard rock. The scaled and values can be parameterized again with the functions in Eq. 3, 4 and the average muon range underground for each value of surface energy can be computed again in the same procedure as described above (c.f. again Table 2 and 3).
| [] | [] | [] | |||
|---|---|---|---|---|---|
| 2.17 | 0.70 | 0.70 | 0.50 | 1.90 | |
| 2.44 | 1.10 | 1.53 | 0.41 | 3.04 | |
| 2.68 | 1.44 | 2.07 | 0.41 | 3.92 | |
| 2.93 | 1.62 | 2.27 | 0.46 | 4.35 | |
| [] | [] | ||||
|---|---|---|---|---|---|
| standard rock | 1.925 | 0.252 | 0.358 | 1.711 | -0.178 |
| Soudan rock | 1.925 | 0.252 | 0.393 | 1.878 | -0.195 |
| [] | [] | [ ] | |
|---|---|---|---|
| standard rock | 2298.2 | 0.001920 | 0.99809 |
| Soudan rock | 2098.9 | 0.002119 | 0.99789 |
3 Calculating the Muon Intensity Underground
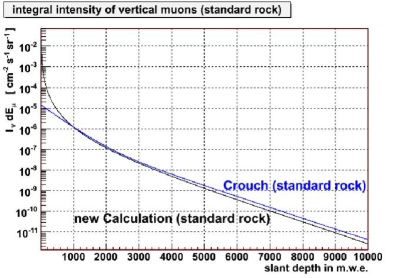
Together with Eq. 1, which is the Gaisser parameterization of the differential intensity of vertical muons at the surface (), and Eq. 5, which relates the average muon range underground to a given value of surface energy, it is now very simple to compute the intensity underground as a function of slant depth in standard rock. For this, the differential intensity of vertical muons at the surface (Eq. 1 with ) is stepwise added () from TeV down to GeV. At each step the average muon range in is calculated with Eq. 5 and assigned to the interim value of the intensity sum. Thus, the integral vertical muon intensity underground as a function of slant depth in standard rock can be efficiently computed from up to the surface. Fig. 2 depicts the result in comparison with the Crouch curve, which is the parameterized ’world average’ of deeply underground measured () vertical muon intensities; compiled by Crouch and referring to standard rock [6]. The result of our calculation for standard rock agrees already well with the underground measured Crouch curve. Both the intensity values and the spectral shape of the exponentially falling off Crouch function are well reproduced. At the small slant depth value of , where underground measurements start to be considered in the Crouch fit, both curves match very well, whereas for larger values of slant depth the new calculation tends to fall off slightly faster.
4 Refining the Gaisser Parameterization by Comparison with Crouch Curve
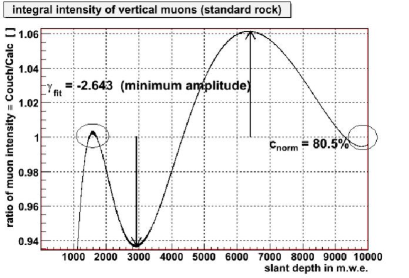
We tried to further improve the agreement between the calculation and the Crouch curve by refining the primary spectral index () and the absolute normalization () of the Gaisser parameterization of the muon flux at the surface (substitute with in Eq. 1). In a Newtonian iteration procedure, the two variables and were varied before each new calculation, such that the new values at and are in optimum agreement with Crouch and the amplitude of the fractional differences for slant depth values in between is minimal (c.f. Fig. 3). The best fit values obtained by this procedure are for the primary spectral index and for the normalization factor (c.f. Fig. 4, 2). We found the maximum fractional difference between the optimized calculation and the Crouch curve to be , which is of the order of the uncertainty on the measured Crouch curve.
5 Discussion
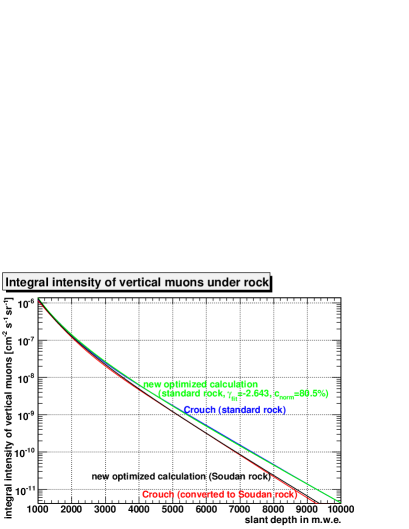
The fact that the parameterized muon flux at the surface in combination with the propagated muon energy loss in the rock reproduces the ’world average’ Crouch curve implies that the underlying physics, as described in this paper, is well understood. Our optimized Gaisser parameterization, with an absolute value of the primary spectral index of slightly less than and a lower muon intensity at surface, is in reasonable agreement with experimental data [2]. Crouch [6] converted the underground muon intensity data to depth values in standard rock utilizing an approximate mathematical solution of the differential Eq. 2 assuming the and parameters to be constant [2], which becomes less valid at increasing depths. It is possible now to perform the herein described calculation in other rock than standard rock, yielding new underground muon intensity curves for the local rock composition.
6 Summary
Taking the vertical muon intensity of the refined Gaisser parameterization of the muon flux at the surface ( instead of ) and propagating this energy spectrum underground according to statistical ionization and radiative energy losses yields a good fit to the underground muon intensity Crouch curve. The obtained agreement is for most part better than the uncertainty of associated with the Crouch function. For chemical compositions other than standard rock, a consistent computation of the underground muon intensity curve can be repeated, fully accounting for the energy dependence of the muon in the local rock. This can yield a better determination of a map of the overburden of an underground muon detector, by normalizing the measured intensity to the computed distribution as a function of slant depth in the local rock. Furthermore, the methods described herein also allow for a more precise extrapolation of the underground muon energy back to the surface.
7 Acknowledgements
This work was supported by the U.S. Department of Energy (DOE) under contract DE-AC02-06CH11357.
References
- [1] T. Gaisser, “Cosmic Rays and Particle Physics”, Cambridge University Press (1990), page 71
- [2] W. Yao et al., J. Phys. G: Nucl. Part. Phys. 33 2006
- [3] D.E.Groom et al., “Muon stopping-power and range tables,” Atomic Data and Nuclear Data Tables, 78, 183 (2001).
- [4] Geant4 is maintained at http://geant4.cern.ch/
- [5] K. Ruddick, Soudan 2 Int. Note, PDK 435, 1990.
- [6] M. Crouch, in Proc. 20th Int. Cosmic Ray Conf., Moscow, 6, 165 (1987).