Measurement of Double Helicity Asymmetry in Multi-Particle Production with Polarized Proton-Proton Collision at PHENIX
Abstract
A goal of the PHENIX experiment is to obtain the polarized gluon distribution function in the proton. Double helicity asymmetry in multi-particle production with polarized proton-proton collision is measured at midrapidity with RHIC Run 2005 data. This result excludes the maximum positive gluon polarization (“GRSV-max”).
Keywords:
Proton Spin Structure, Polarized Gluon Distribution Function:
14.20.Dh, 13.88+e, 13.85.Hd1 INTRODUCTION
Polarized deep inelastic lepton-hadron scattering experiments revealed that the contribution of the quark spin to the proton spin is only 20-30% Ashman:1987hv :2006vy . The remaining component can be carried by the gluon spin and the angular momenta of quarks and gluons. One of the goals of the PHENIX experiment is to obtain the contribution of the gluon spin, namely the polarized gluon distribution function in the proton, . is evaluated by measuring double helicity asymmetry, , of reactions in longitudinally-polarized proton-proton collisions, for example, jet, or direct photon productions. A jet is measured as a cluster of multiple particles. The particle cluster measurement gives higher statistics at high transverse momentum () than single particle measurements such as . is defined as
| (1) |
Here, and are the number of measured particle clusters with same and opposite beam helicities, respectively; is relative luminosity; and and are beam polarizations.
2 EXPERIMENTAL SETUP
We used proton-proton collision data taken in 2005 at GeV with an average beam polarization of 46%. The integrated luminosity of analyzed data is 2.2 pb-1. The PHENIX Central Arm detectors were used. Two arms are positioned almost back to back, and each arm covers the pseudorapidity region and the 90-degree azimuthal angle. Photons with GeV/ were measured with electromagnetic calorimeters, and an electromagnetic-shower-shape cut and an charged-track-matching veto were applied to eliminate clusters made by charged particles. Charged particles with GeV/ were measured with drift chambers and pad chambers. For each event a high- ( GeV/) photon was required to exist so that the efficiency of high--photon trigger becomes independent.
3 METHODS OF PARTICLE CLUSTER MEASUREMENT
Particles that satisfied the experimental selections were clustered by a cone method. Starting from each particle in an event as a seed, an interative procedure was used to define a cone around a cluster of particles. The cone radius () was set to 0.3. The transverse momentum of the cone, , was defined as the vector sum of the transverse momenta of the particles in the cone;
| (2) |
The cone that gives the largest in an event was used in the event.
The relationship between and was evaluated with PYTHIA and GEANT simulations Nakano:2005jps . From two hard-scattered partons in PYTHIA jet event we selected one parton closer in to cone axis, and adopted of the parton as of jet. We used PYTHIA version 6.220 with the “Rick Field MPI tune A” setting Field:2005qt . We have confirmed that the simulation reproduced the event shape, such as particle multiplicity, one-sided thrust in the PHENIX Central Arm acceptance and particle density, reasonably well Nakano:2005jps .
The largest systematic uncertainty in this measurement is an uncertainty on the scale difference between measurement and theory. It originates in the fact that a jet is defined with cone at hadron level in measurement and at parton level in theory. In measurement we assigned the scale uncertainty 10%, by which the scale in theory varies when a theory cone size is changed in a typical range. We could checked the scale uncertainty by measuring cross section or a similar quantity because the difference in scale appears as a shift of cross section curve.
The requirement of a high- photon causes a bias on the fractions of jet production subprocesses (quark-quark, quark-gluon and gluon-gluon reactions). This effect was estimated using PYTHIA. In general, the gluon-gluon reaction is suppressed particularly at low . No systematic uncertainty on it has been assigned because this effect is much smaller than other systematic uncertainties.
4 RESULT
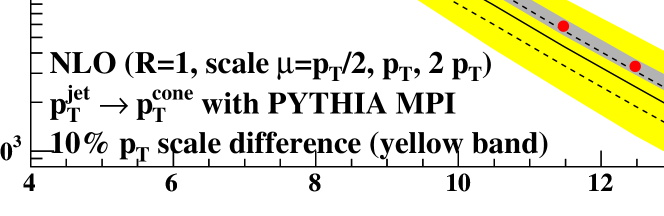
Figure 1 shows yield per luminosity of particle cluster with high- photon trigger in the PHENIX Central Arm acceptance as a function of . The real data is drawn as red points with systematic errors as a gray band. The main systematic errors on real data are luminosity uncertainty (10%) and EMCal energy scale uncertainty (5%). The predicted ones are drawn as three black lines, which are based on the NLO jet cross section with at Jager:2004jh and the - relationship. The yellow band shows the deviation of the black solid line caused by a 10% scale variation. The difference in the yield per luminosity between the real data and the predicted one doesn’t exceed the deviation.
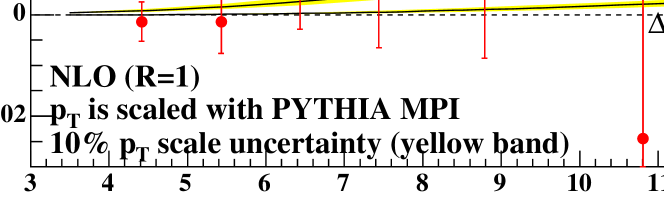
Figure 2 shows the of particle cluster production as a function of . The predicted ’s are drawn as black lines, which are based on the NLO jet with at Jager:2004jh , the three models Gluck:2000dy and the - relationship. The yellow band shows the 10% scale uncertainty. This result excluded the “GRSV-max” case and indicated a similar probability for the “GRSV-std” and “ input” cases.
5 CONCLUSIONS
Double helicity asymmetry in multi-particle production was measured at midrapidity reagion () at GeV. The analyzed data were taken in 2005 with pb-1 and 46%. The relationship between and was evaluated with the PYTHIA and GEANT simulations. The systematic uncertainty on was assigned 10% due to the scale difference between measurement and theory. This result excluded the “GRSV-max” case and indicated a similar probability for the “GRSV-std” and “ input” cases. It will make stronger constraint on with futher statistics.
References
- (1) J. Ashman et al. [European Muon Collaboration], Phys. Lett. B 206, 364 (1988).
- (2) [HERMES Collaboration], arXiv:hep-ex/0609039.
- (3) K. Nakano, Talk at Second Joint Meeting of Nuclear Physics Divisions of APS and JPS, Session BG, 2005.
- (4) R. Field [CDF Collaboration], Acta Phys. Polon. B 36, 167 (2005).
- (5) B. Jager, M. Stratmann and W. Vogelsang, Phys. Rev. D 70, 034010 (2004) [arXiv:hep-ph/0404057].
- (6) M. Gluck, E. Reya, M. Stratmann and W. Vogelsang, Phys. Rev. D 63, 094005 (2001)