Search for Coincidences in Time and Arrival Direction of Auger Data with Astrophysical Transients
Abstract
The data collected by the Pierre Auger Observatory are analyzed to search for coincidences between the arrival directions of high-energy cosmic rays and the positions in the sky of astrophysical transients. Special attention is directed towards gamma ray observations recorded by NASA’s Swift mission, which have an angular resolution similar to that of the Auger surface detectors. In particular, we check our data for evidence of a signal associated with the giant flare that came from the soft gamma repeater 1806-20 on December 27, 2004.
1 Introduction
It has long been known that two of the highest energy cosmic rays came from directions that are within the error boxes of two remarkable gamma ray bursts (GRBs) detected by BATSE, with a delay of roughly 10 months after the bursts [1]. However, all searches for coincidences between the arrival direction of ultra-high energy cosmic rays (UHECRs) and GRBs from the Third BATSE catalogue yield a negative result [2]. These searches, of course, may have been distorted by the poor angular resolution (about 3 degrees) of the GRB measurements. A sensitive anisotropy analysis is now feasible using data collected by the Swift mission [3] and the Pierre Auger Observatory [4]. In the first part of this paper we present the results of such an analysis.
In the second part of the paper, we search for a signal from the direction of the soft gamma repeater (SGR) 1806-20, which on December 27, 2004 emitted a hyperflare that saturated many satellite -ray detectors [5]. This unique flare lasted about 5 minutes (the duration of the initial spike was ), had a peak luminosity of and a total energy emission of erg [6]. The model proposed is that of a “magnetar” (i.e., a neutron star with a huge magnetic field, ) located on the far side of our Galaxy (at a distance kpc [7]). The origin of the flare can be explained as global crustal fractures due to -field rearrangements liberating a high flux of -rays and -rays [8]. The exceptional energetics of this hyperflare makes of SGR 1806-20 an attractive candidate source of UHECRs, high energy neutrinos, and gravitational waves [9]. Given that the source is in our Galaxy, if it were to generate high energy neutrons a significant fraction of them could arrive at Earth before decaying and would point back to the source. Moreover, neutrons that decay in flight would produce antineutrinos that inherit directionality [10]. Searches for neutrino and gravitational wave emission have been reported by the AMANDA [11], AURIGA [12], and LIGO Scientific [13] collaborations. In all these searches the data revealed no significant signals.
2 Cosmic Ray Data Sample
In our analysis we use data collected with the Pierre Auger Observatory, located in Argentina at Southern latitude and Western longitude . We consider events with zenith angle , detected from January 1, 2004 to April 1, 2007. We employ the reconstruction procedure discussed elsewhere [14]. A total of 609,161 CRs have passed the selection criteria.
3 UHECRs and GRBs
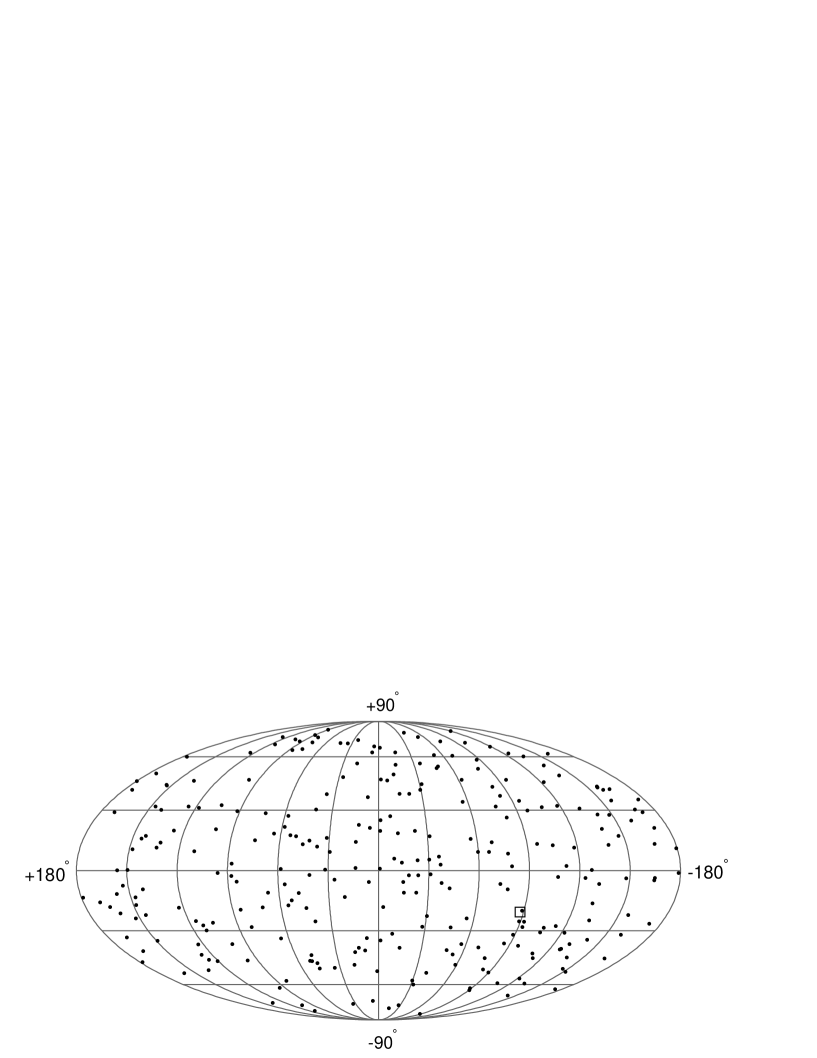
A catalogue of 284 GRBs observed with an accuracy of better than 1∘ (from Januray 1, 2004 to April 1, 2007) was compiled using data primarily from the Swift mission complemented by measurements from additional GRB observing satellites, including HETE, INTEGRAL, and others. Out of the total GRB sample, 192 bursts are within the field of view (f.o.v.) of Auger and only 62 were in the Auger f.o.v. at the time of their bursts, i.e. The GRB sky distribution is given in Fig. 1. As expected [15], they cover the whole sky isotropically.
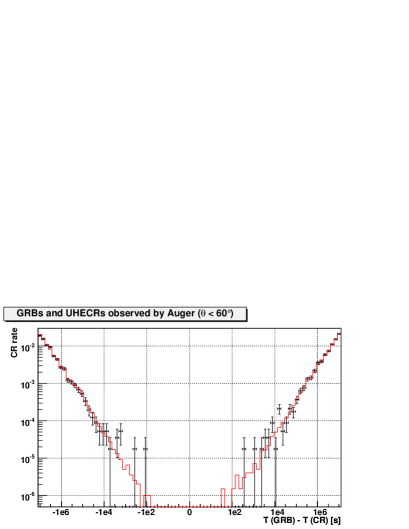
We bin CR events coming from directions defined by spherical caps of radii and around each GRB position. We determine the total number of coincidence candidates by counting the number of CRs found within each of the specified cones. The number of coincidence candidates for is whereas for , . Note that for the number of coincidence candidates is larger than the total number of CRs in the sample, since a given CR may lie within of more than one GRB. Differences between the observation times of the GRBs and the arrival times of CR events in the same angular bin were determined. In Fig. 2, we show the rates of CR events as function of the GRB-CR time difference for the two angular radii around the positions of GRBs. We consider a 100-day period before and after the GRB observation. The histogram corresponds to a cut and the points corresponds to a cone. No significant excess after the time of the bursts is evident in the data.
4 UHECRs from SGR 1806-20?
The giant flare of December 27, 2004 from SGR 1806-20 represents one of the most intriguing events captured in almost three decades of monitoring the -ray sky. Such an energetic event clearly constitutes a potential candidate for acceleration of UHECRs. Secondary neutrons can be produced in collisions of relativistic protons (and nuclei) with the ambient plasma. Interestingly, those produced with an energy have a boosted sufficiently large to serve as Galactic messengers. The decay mean free path of a neutron is , the lifetime being boosted from its rest frame value, to its lab value by Because of the exponential depletion, about 20% of the neutrons survive the trip at , and about 58% at .
The location of the source, right ascension and declination , is within the f.o.v. of Auger, and below for about 9 hours per day. At the flaring emission 21:30:26.5 UTC, its zenith angle was and it remained for a 50 minute interval above the horizon. Unfortunately, this is outside the currently best understood region of the detector, i.e. .
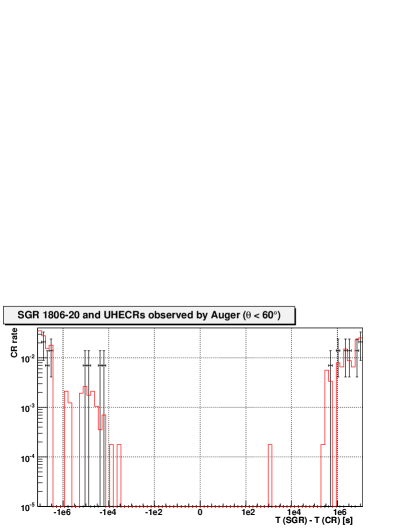
We have repeated the analysis described in the previous section for this exceptional burst. In Fig. 3 we show the results of such an analysis, indicating that no significant excess in the CR flux is evident after the burst. (The number of events coming from the direction of SGR 1806-20 within a cone is whereas for , .)
By extending our data analysis to higher zenith angles, we have verified that no events have been observed within a cone during the s of the flare, where The abscence of a signal can then be exploited to place an upper bound on the primary neutron flux, without assumptions on the Galactic magnetic field. To do so, we must determine the effective detection area and the trigger efficiency . We adopt the elementary hexagonal cell approach discussed in Ref. [16]. On December 27, 2004 an average of 364 Auger hexagones were fully active, each counting for on the ground (which amounts to as seen with an angle of ). Hence, the experiment presented to the potential ”beam” of neutrons emanating from the source. The trigger efficiency for is shown in Fig. 4.
Using the diffuse flux of cosmic rays we estimate a background , thus Poisson statistics implies an upper bound of 3.09 events at 95% CL from neutron fluxes, [17]. Equivalently, for some interval
| (1) |
In a logarithmic interval where a single power law approximation (for the integrand) is valid, we obtain [18]
| (2) |
where is the energy at the center of the logarithmic interval and we have taken (corresponding to one -folding of energy). The 95%CL upper limits on the energy weighted flux of neutrons are shown in Fig. 4.
5 Conclusion
We used the Auger data sample to search for UHECRs which are consistent with the position and time of astrophysical transients. No such coincidences were found in the data.

References
- [1] M. Milgrom and V. Usov, Astrophys. J. 449, L37 (1995).
- [2] T. Stanev, R. K. Schaefer and A. Watson, Astropart. Phys. 5, 75 (1996).
- [3] N. Gehrels et al. [Swift Science Collaboration], Astrophys. J. 611, 1005 (2004).
- [4] J. Abraham et al. [Pierre Auger Collaboration], Nucl. Instrum. Meth. A 523, 50 (2004).
- [5] D. Borkowski et al., GNC Circ. 2920 (2004); S. Mereghetti, et al, Astrophys. J. 624, L105 (2005); K. Hurley et al., Nature 434, 1098 (2005); D. M. Palmer et al., Nature 434, 1107 (2005); T. Terasawa et al., Nature 434, 1110 (2005).
- [6] P. M. Woods et al., Astrophys. J. 654, 470 (2006).
- [7] S. Corbel, P. Wallyn, T. M. Dame, P. Durouchoux, W. A. Mahoney, O. Vilhu, J. E. Grindlay, Astrophys. J. 478, 624 (1997); S. Corbel and S. S. Eikenberry, Astron. Astrophys. 419, 191 (2004); P. B. Cameron et al, Nature 434, 1112 (2005); N. M. McClure-Griffiths and B. M. Gaensler, Astrophys. J. 630, L161 (2005).
- [8] C. Thompson and R. C. Duncan, Mon. Not. Roy. Astron. Soc. 275, 255 (1995).
- [9] K. Ioka, S. Razzaque, S. Kobayashi and P. Meszaros, Astrophys. J. 633, 1013 (2005); K. Asano, R. Yamazaki and N. Sugiyama, Publ. Astron. Soc. Jap. 58, L7 (2006); F. Halzen, H. Landsman and T. Montaruli, arXiv:astro-ph/0503348; D. Fargion and M. Grossi, Nuovo Cim. 28C, 809 (2005).
- [10] L. A. Anchordoqui, H. Goldberg, F. Halzen and T. J. Weiler, Phys. Lett. B 593, 42 (2004).
- [11] A. Achterberg et al. [IceCube Collaboration], Phys. Rev. Lett. 97, 221101 (2006).
- [12] L. Baggio et al. [AURIGA Collaboration], Phys. Rev. Lett. 95, 081103 (2005).
- [13] B. Abbott [LIGO Scientific Collaboration], arXiv:astro-ph/0703419.
- [14] C. Bonifazi [Pierre Auger Collaboration], Proc. 29th ICRC, Pune 7, 17 (2005).
- [15] C. A. Meegan et al., Nature 355, 143 (1992).
- [16] D. Allard et al. [Pierre Auger Collaboration], Proc. 29th ICRC, Pune 7, 71 (2005).
- [17] G. J. Feldman and R. D. Cousins, Phys. Rev. D 57, 3873 (1998).
- [18] L. A. Anchordoqui, J. L. Feng, H. Goldberg and A. D. Shapere, Phys. Rev. D 66, 103002 (2002).