MEASUREMENT IN STAR
Abstract
We present preliminary results of production in p+p collisions at 200 GeV at central rapidity. This measurement was performed at the STAR experiment through the decay channel. In this manuscript we describe the experimental details, from the development of a specially designed trigger setup to the analysis methods used to discriminate electrons from hadrons. The production cross-section obtained 912822 pb is compatible with our expectations based on pQCD calculations.
1 Introduction
The excited states of heavy-quarkonium are predicted to be strongly modified in heavy-ion collisions with respect to p+p [1, 2]. Therefore a full spectroscopy of the states is good way to observe any suppression pattern that corroborates to the existence of deconfinement and the specific pattern of suppression can provide experimentalists with a thermometer of the QGP.
2 Experimental Setup
STAR [3, 4, 5] is a large acceptance, multi purpose experiment composed of many individual detector subsystems installed inside a large solenoidal magnet capable of creating uniform magnetic fields up to 0.5 Tesla. In the following, we describe the detectors which are relevant to the present analysis. The Time Projection Chamber (TPC) [6] has a pseudorapidity coverage of 1.8 for collisions in the center of STAR with full azimuthal coverage. For charged tracks in the acceptance, the TPC provides up to 45 independent spatial and specific ionization energy loss () measurements. The measurement, in combination with the momentum measurement, determines the particle mass within a limited kinematic region. The Barrel Electromagnetic Calorimeter (BEMC)[7], located just inside the coils of the STAR solenoidal magnet with a radius relative to beam line of 2.3 m, is a lead-scintillator sampling electromagnetic calorimeter with equal volumes of lead and scintillator. The electromagnetic energy resolution of the detector is . The results presented in this work used for the first time the full coverage of the BEMC in the 2006 RHIC run, consisting of 120 modules, with coverage from and full azimuthal coverage. Each BEMC module is composed of 40 towers (20 towers in by 2 towers in ) constructed to project to the center of the STAR detector. The tower size is . The tower depth is 21 radiation lengths (X0), corresponding to a little less than 1 hadronic interaction length.
2.1 Trigger Setup
The trigger looks for the decay channel and it is a two-level setup, where the high invariant mass allows the trigger to be simpler than other two-level triggers [8]. The L0 and L2 triggers for the are detailed below.
2.1.1 L0 Trigger
The L0 trigger is a fast hardware trigger, taking a decision for every bunch crossing. It is simply is a high-tower trigger, which consists of at least one BEMC tower with energy above the threshold of 3.5 GeV. When such an event happens it starts the L2 trigger.
2.1.2 L2 Trigger
The L2 trigger is a software level decision. It finds towers with energy similar to the L0 threshold and uses them as seeds to the L2 clusters, that are groups of 3 towers made by the seed plus the 2 surrounding towers with the highest energy. As the decay channel is , the L2 algorithm takes pairs of clusters and calculates the invariant mass of the cluster pair using the formula
| (1) |
where is the energy of the cluster (1 or 2) and is obtained as the angle formed by the two straight lines that go from the vertex to the cluster positions. The vertex is assumed to be at (0,0,0). The implemented trigger has a high efficiency, above 80 and a large rejection power (100 for each of the 2 levels, bringing it up to ). Due to the high invariant mass for which it is designed to work where background is much lower , the trigger is efficient on both, p+p multiplicities up to central Au+Au. This trigger also exploits the full STAR acceptance of 2 in and .
3 Electron Identification
The process of electron identification using the STAR barrel calorimeter is based on a pre-selection of electron candidates from the TPC measurement. Figure 1 (left) shows a typical TPC distribution for tracks where the number of points used to calculate the is greater than 20 and the momenta of the tracks 1 GeV/c. It is possible to see that electrons can be pre-selected by the range 35 keV/cm.

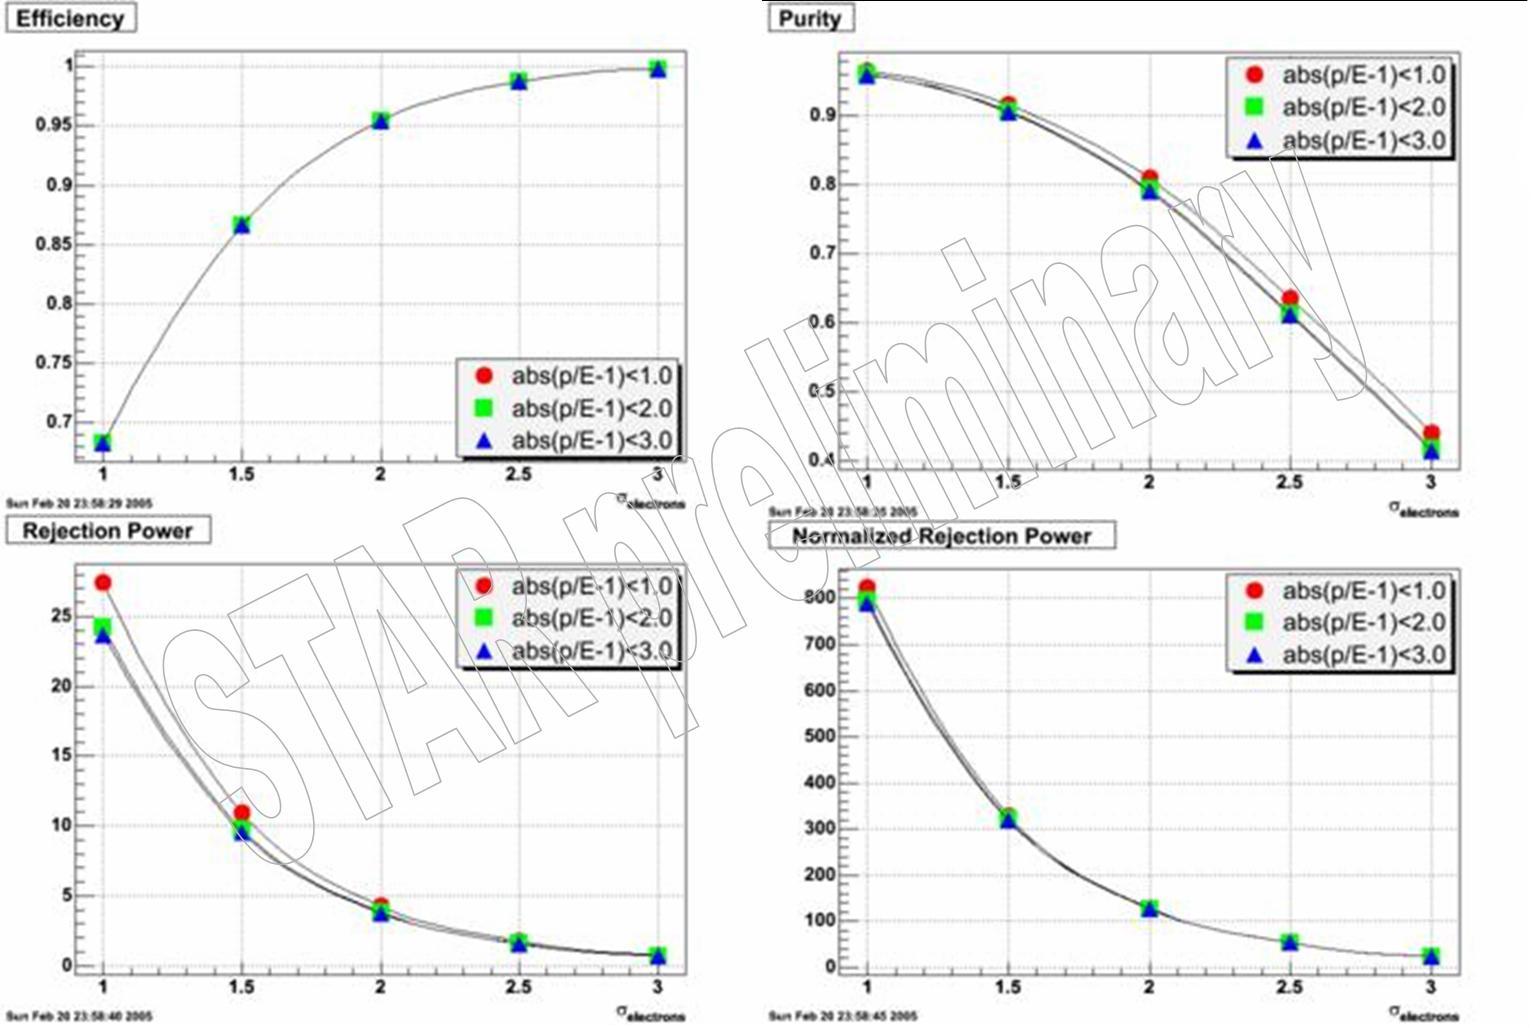
After the electron candidates are selected, their tracks are projected on the BEMC and the energy deposited in the tower hit by the track is compared to its momentum. Due to their small masses electrons deposit all their energies on the BEMC towers and thus should have an 1. Hadrons have a wider distribution of . Still on figure 1, the left panel shows the spectrum for the electron candidates in which it is possible to see a well defined electron peak. The peak is not centered at one due to energy leakage to surrounding towers. The residual hadronic background is shown as a thick line in the spectrum. With all this information it is possible to make a series of selected cuts that provide a good particle identification (PID) and hadron rejection for the desired electrons. The main cuts are 2 GeV/c, 3.45.0 keV/cm and 2. These are the set of cuts that give the relation efficiency purity on the electron identification with best signal-to-background.Some of the studies for the PID efficiency are presented on figures 1 (right) and 2. On the first one, it is possible to see that the efficiency approaches unity as increases, while the purity becomes poorer. This reflects the fact that the electron and hadron bands move to higher ranges with higher . Figure 2, on the other hand, shows how the purity and the efficiency vary with changes on the cuts parameters. This figure also shows another important feature that is the hadron rejection power of these cuts. The expressions used to calculate the efficiency, purity, rejection power and normalized rejection power are:
-
Efficiency: (selected electrons)/(total electrons);
-
Purity: (selected electrons)/(selected electrons+hadrons);
-
Rejection power: (selected electrons)/(selected hadrons);
-
Normalized RP: (probability of selected electrons)/(probability of selected hadrons).
The number of selected particles is the area of the Gaussian that falls within the cuts. The total number of particles is the area under the entire Gaussian. The probability of selected particles is the area of the Gaussian that falls within the cuts where the Gaussians have been normalized to unity for all species.

4 Results
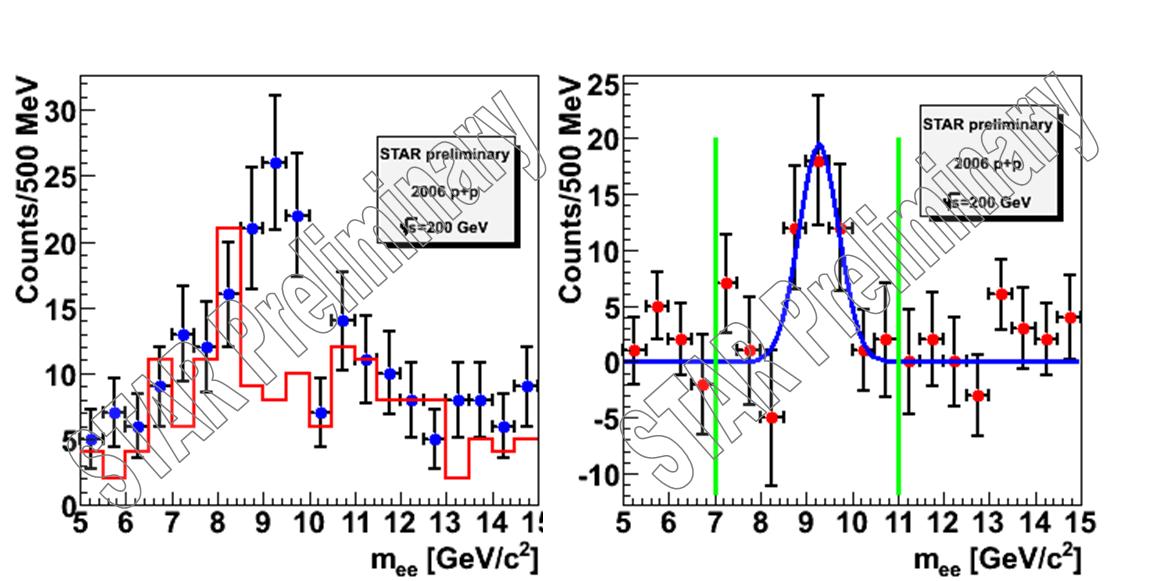
After making the electron identification, the electron sample is analyzed and the invariant mass between every two electrons are calculated. With the results obtained from pairs we calculate the invariant mass spectrum for unlike-sign pairs and construct a background spectrum using the like-sign pairs(). Figure 3 (left) show combinations of electron candidates (dots) and the corresponding combinatorial background (line). The vertical lines in figure 3 represent the boundaries that “confine” the data used to evaluate the significance of the signal. The value obtained for it is 3.0.

On figure 3 (right) it is possible to see the net signal after subtraction of combinatorial background. Given the magnetic field strength, the expected mass resolution for of the peak, obtained from simulations, is about 0.5 GeV/c2, consistent with the 0.5 GeV/c2 of figure 3. The other important remark is that the mean value of the fitted Gaussian is shifted down by 160 MeV/c2, which is due to Bremsstrahlung effects on the electrons when they pass through the inner materials of the STAR experiment (like the beam-pipe for example). With this resolution and the available statistics it is not possible from this measurement to discriminate between the 3 S states of the family. Considering this year′s acceptance, the overall efficiency in the measurement and the integrated luminosity it is possible to compute the cross section for the (1S+2S+3S) states using the expression
| (2) |
5 Perspectives
For the next year, RHIC will have a long Au+Au run, with much higher statistics, and we will be able to use the trigger with all the STAR acceptance for the first time in Au+Au. This will be our first opportunity to measure the S-states family in a heavy-ion environment. This measurement could shed some light on the sequential melting models.
In the mid/near term, RHIC and STAR will receive several upgrades that will enhance our measurement capabilities. First, the RHIC upgrade to RHIC-II with e-cooling will provide a substantial increase in the luminosity (40RHIC luminosity), which is today’s big constraint on the measurement. One specific remark is that the collision diamond the longitudinal distribution of beams intersection is expected to go from today’s =20 cm to =10 cm what makes the gain in the “usable luminosity” larger than the nominal increase. On the STAR side, there are also several upgrades that may help the quarkonium program and specifically the measurements. The main upgrades are the DAQ1000, which will increase considerably the trigger rates giving them enough capabilities to have zero dead time. Other upgrades that will help the quarkonium program are the full barrel Time-Of-Flight(ToF) and a muon detector. The ToF can increase the quality on the particle identification, helping to improve electron identification and to increase hadron rejection power. It can also help on other quarkonia trigger setups. With the muon detector it will be possible to make complementary measurements via the decay channel. With all these upgrades, it is estimated that the STAR experiment will be able to measure 11200 ’s (against 830 max., with RHIC), making the the strength of STAR in the quarkonium program.
Acknowledgements
This work was supported in part by the Brookhaven National Laboratory (BNL), by the Conselho Nacional de Desenvolvimento Científico e Tecnológico (CNPq) and by the Coordenação de Aperfeiçoamento de Pessoal de Nível Superior (CAPES).
References
References
- [1] C.-Y. Wong, hep-ph/0408020.
- [2] S. Digal, P. Petreczky, H. Satz,Phys. Lett., B514 (2001) 57.
- [3] J. Adams et al., STAR White Paper, nucl-ex/05010009.
- [4] K. H. Ackermann et al.,Nucl. Instrum. Meth., A 499, 624 (2003).
- [5] J. W. Harris and the STAR Collaboration,“The STAR experiment at the Relativistic Heavy Ion Collider”, Nucl. Phys., A 566, A566 (1994) 277c.
- [6] M. Anderson et al., Nucl. Instrum. Meth. A499:659-678,2003.
- [7] M. Beddo et al., Nucl. Instrum. Meth. A499:725-739,2003.
- [8] P. Djawotho for the STAR Collaboration, nucl-ex/0701075. (to be published in the proceedings of Quark Matter 2006 as a special issue of Journal of Physics G: Nuclear and Particle Physics).
- [9] A. D. Frawley, F. Karsch, T. Ullrich and R. Vogt, RHIC-II Heavy Flavor White Paper (2006); http://rhicii-science.bnl.gov/heavy/.