Is the Concentration of Dark Matter Halos at Virialization Universal ?
Abstract
Several recent studies suggest a correlation between dark matter halo mass and the shape of the density profile. We re-analyze simulations from Ricotti (2003) in which such a correlation was proposed. We use a standard analysis of the halo density profiles and compare the old simulations to new ones performed with Gadget2, including higher resolution runs. We confirm Ricotti’s result that, at virialization, the central log slopes , at 5%-10% of the virial radius are correlated with the halo mass and that the halo concentration, , is a universal constant. Our results do not contradict the majority of published papers: when using a split power law to fit the density profiles, due to the degeneracy, the fits are consistent with halos having a universal shape with or and concentrations that depend on the mass, in agreement with results published elsewhere.
Recently, several groups have found no evidence for convergence of the inner halo profile to a constant power law. The choice of a split power law parameterization used in this letter is motivated by the need to compare our results to previous ones and is formally valid because we are not able to resolve regions where the slope of the fitting function reaches its asymptotic constant value. Using a non-parameterized technique, we also show that the density profiles of dwarf galaxies at have a log slope shallower than within % of the virial radius.
1 Introduction
It is widely believed that dark matter halos have a universal density profile. In the last decade the debate focused largely on whether the slope of the density profile, , approaches values close to or at small radii. The concentration, , of dark halos supposedly incorporates all the physics: the dependence on the cosmological model, the halo mass and redshift of virialization. However, the determination of the inner slope of halos is uncertain due to the scatter of halo shapes and a well known degeneracy between and when fitting the density profiles. Indeed, only a few published simulations have sufficiently high resolution to partially resolve this degeneracy and these simulations only cover a limited range of halo masses (typically Milky-Way type or cluster type halos) at redshift .
In this paper, we re-analyze data from N-body simulations performed in Ricotti (2003), henceforth R03, and compare them to a new set of simulations performed using Gadget2 (Springel, 2005) at the same and higher resolution than in R03. The R03 results are of particular interest because, in R03, it was first found that the log slope of the inner parts (at 10% of the virialization radius for just virialized halos) of the dark matter density profile, , varies with the mass of the halo. This result may ease some tension between theory and observations. Indeed, for low mass halos (), which should correspond to dSph galaxies (e.g., Ricotti & Gnedin, 2005; Read et al., 2006) and perhaps some Low Surface Brightness (LSB) galaxies (e.g., de Blok & Bosma, 2002), R03 finds at 10% of the virial radius (where kpc). In R03, Milky-Way type halos with mass are well fitted by a NFW profile with (Navarro et al., 1996) and there is also some evidence that higher mass systems () have steeper cusps, . This is consistent with results in Moore et al. (1999), although this latter paper also proposes for rather small, galaxy mass halos (). It is important to clarify that the quoted values of in the inner part of the halos depend on the resolution of the simulations (e.g., in R03 is fixed to be about 10% of the virial radius). There is no reason to believe that converges to any asymptotic value as suggested by the arguments in R03 and and by high-resolution simulation of Milky-Way size halos (Navarro et al., 2004; Graham et al., 2005). Note that the result in R03 does not depend on this assumption. In R03 we show that NFW profile does not provide good fits for small mass halos at by comparing the shapes of the circular velocities of just virialized halos with widely different masses (hence, virialized at different redshifts). Our conclusion is that density profiles do not have an universal shape as often assumed before. A theoretical interpretation of this result is also proposed based on previous work by Subramanian et al. (2000) in which a simple relationship that relates to the slope of the power spectrum of initial density perturbations is provided. Our results are consistent with this simple scaling relationship, suggesting that the halo shape at a given mass or spatial scale depends on the the slope of the power spectrum at that scale. This result is based on formal fitting of the circular velocities of the halos with generalized NFW profiles. Colín et al. (2004) performed similar simulations and failed to find shallow cores in a similar mass range. Nevertheless, similar correlations have been found by others, (e.g. Jing & Suto, 2000; Taylor & Navarro, 2001; Cen et al., 2004). More recent work by Graham et al. (2005) and Merritt et al. (2005) also find a correlation between halo mass and the shape of the density profile. In this case they parameterize this correlation in terms of the Sérsic index, , rather than a central log-slope dependence. In (Navarro et al., 2004; Merritt et al., 2005) is argued that this parameterization provide a better fit of high-resolution halos than a split power-law.
The main motivation of this letter is to understand whether the R03 results are in contradiction with previous works and clarify if the discrepancy can be attributed to the method of analysis, the N-body code used by R03, or insufficient resolution of the simulation. Ricotti used a N-body integrator and analyzed the data using circular velocities instead of density profiles. Here we adopt the widely used “tree” N-body integrator Gadget2, with and particles and we develop a quantitative method to analyze the density profiles using a standard minimization technique.
2 Simulation Data and Analysis
All simulations used and referred to in this work have identical cosmological parameters: , , , and . R03 uses a integrator Gnedin & Bertschinger (1996) while our new simulations employ the tree code Gadget2 Springel (2005); Springel et al. (2001). The general notation we use to label each simulation is: Run-L, where Run = R03, GR03, G256 and G512 describe a different simulation and L = 1,32,256 refers to the box size (i.e., ). The runs “R03” refer to the original R03 simulations, “GR03” use the initial conditions in R03 but are re-run using Gadget2, “G256” and “G512” are new runs using Gadget2 with and particles, respectively. The purpose of running the new simulations GR03, G256 and G512 was to ensure the results in R03 were not affected by any irregularity in the simulation method employed. GR03 checks for problems with the R03 simulation parameters and code; G256 checks the initial conditions and G512 checks for resolution related issues.
The redshift of analysis in all simulations is . The larger box sizes are analyzed when the clustering of the most massive halos is similar, which turns out to be for and for . We extracted the halos using a Friends-of-Friends algorithm with linking length (chosen by analogy with the spherical collapse model). We follow the iterative method of Porciani et al. (2002) to ensure that the extracted halos are bound. At each stage the total energy of each particle is calculated. Particles which do not appear to be bound are excluded from the potential calculation in the next stage. An accurate determination of the halo centers is important, since from a miss-centered halo we would deduce a systematically flattened profile. We use three centering methods: i) Density Maximum. An algorithm for finding the density maximum uses an adaptive grid of cubes; where the number of particles inside a cube exceeds a certain threshold, the cube is subdivided and the process iterates. ii) Shrinking Sphere Center of Mass, as in Power et al. (2003). Here we calculate the center of mass (COM) and then iterate, including at each stage only particles within some sphere around the previously calculated center. iii) Potential Minimum. The particle with the minimum potential is chosen as the center. Generally we find that the potential minimum lies within the convergence radius of the shrinking sphere center. All three alternative centering procedures are used; if one procedure does not produce results within the convergence radius of each of the others, the halo is flagged as unusable for spherically averaged processing. We use the convergence criterion of Power et al. (2003) to determine a central region where the density distribution is unreliable. This yields a convergence radius inside which the profile is not considered during the fitting procedure.
We fit the density profiles using a standard minimization routine with a generalized NFW profile (Navarro et al., 1997) in which the concentration and inner slope are free parameters: , where and . It is obvious that this parameterization of the profile should be regarded valid only between the virial radius and the convergence radius which, for all the halos considered in this work, is a constant fraction % of the virial radius. In this paper, we use the Poisson error for our minimization procedure. It is widely noted (e.g. Jing, 2000; Navarro et al., 2004) that errors introduced by deviations from an “idealized” equilibrium profile (i.e. substructure, asphericity and irregularities) are likely to be at least as important as Poisson errors.
3 Results
When fitting the split power law to a halo, there is a degeneracy between and : the model is effectively constrained not to a point but to a line through the - plane, along which varies by only a small factor from its minimum to the edges of the region of interest . The location of locus of minima varies widely from halo to halo and may select non-physical configurations with . Perpendicular to this line, however, the value of increases rapidly. In Figure 1 left panel, we illustrate this degeneracy for the 10 most massive halos in R03-1. By constraining either or arbitrarily, each line can be reduced to a point, given by the intersection with a horizontal or vertical line respectively. When constraining , which gives NFW fits, the best-fit lies in the range . For , the best fit lies in the range111 Note that in Ricotti & Wilkinson (2004) it is found that a concentration parameter of is a better estimate than the original value in R03. We therefore adopt this value for obtaining numerical results (Table 1). . The results from the Gadget2 runs (GR03, G256 and G512) were in excellent agreement with the R03 runs.
By using an analysis of the peak circular velocity, R03 found that recently virialized halos are well described by a constant concentration . This value was then used to break the profile fitting degeneracy, giving values of which agree with the theoretical prediction of Subramanian et al. (2000) for a range of halo masses from the various box sizes – for more details see the original R03 paper. When one uses circular velocity fitting, as in R03, with a Poisson assumption we obtain a smaller range. If we use density fitting with the NFW constraint, illustrated by a vertical line in Figure 1, the first 40 halos in R03-1 give . This closely matches the results given in Colín et al. (2004) – who analyze their box at redshift instead of – once corrected for redshift as as in Bullock et al. (2001). The remainder of the results are shown in Table 1; all seem to be consistent and allow for fitting using either constraint. The increased mean in the G512-1 simulation occurs because the Poisson errors are reduced (more particles per bin) while the systematics due to departures from the fitted split power-law profile are constant, since these arise through “physical” processes which are not greatly changed in magnitude by the change in resolution.
We now consider whether there is any evidence for differences between the and boxes and their and counterparts. The line of minimum for the 10 most massive regular halos in R03-32 and R03-256 is plotted in the middle and right panels of Figure 1 respectively. Taking the 40 most massive halos and their intersections with the constraint gives () and (). The NFW constraint gives and respectively. Comparing with the results, there is a marginal difference in the results, and a clear difference in the results. The comparison simulations G256-32, G256-256 and GR03-256 show the same trend with box size (see Table 1).
It is important to note that neither the NFW profile plotted in Figure 3 of R03, nor the profiles with a shallower central slope have reached their asymptotic values at the convergence radii. The innermost resolved radii, however, satisfy , which cannot be obtained by a true NFW profile (which must have ). Unfortunately, using the density profile fitting we find that direct estimation of an individual profile’s logarithmic slope yields results too noisy to perform direct analysis near the convergence radius, even with the higher resolution G512 simulations.
3.1 A Non-parametric Method
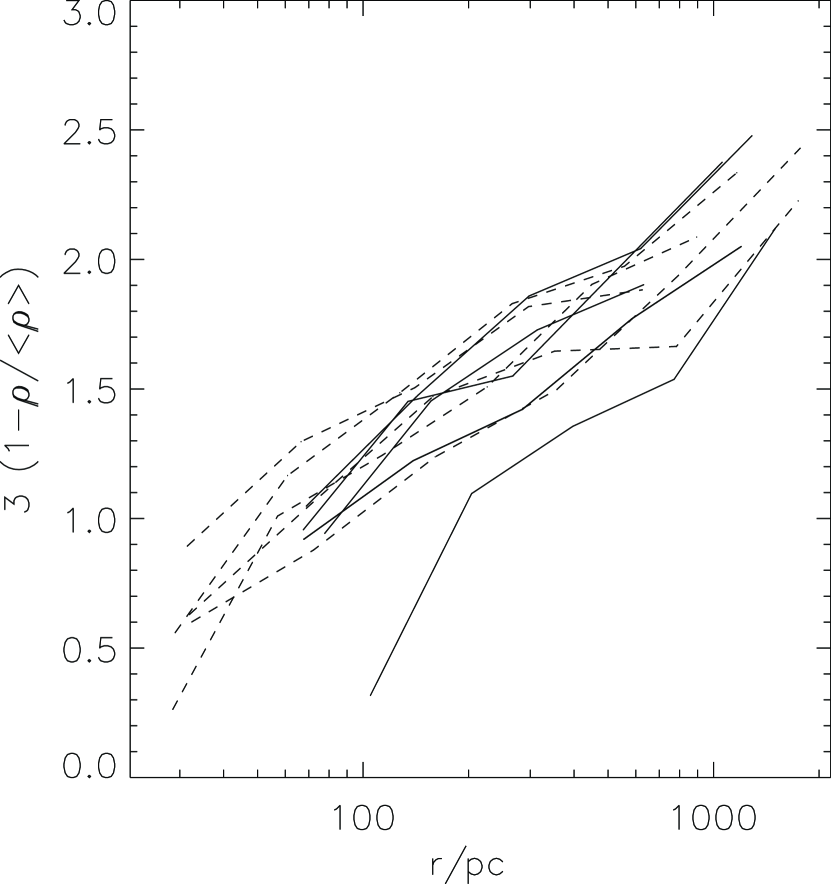
To circumvent the problems of the fitting degeneracy, we follow the method of Navarro et al. (2004). This procedure is similar to the one used by R03 where the circular velocities where analyzed instead of the density profiles. We make the assumption that the total mass interior to the convergence radius, , is representative of the “physical” halo, even if the inner profile is wrong. This being the case, gives a robust limit to the asymptotic power law of the halos: we cannot have a steeper than cusp. The – radius relation is plotted for some sample halos in Figure 2. The G512-1 halos are resolved to smaller radii than the R03 run. The sets are in approximate agreement where their data overlaps, but the innermost point of the G512 profiles have , suggesting that the profile interior to would not be well described by NFW but probably in agreement wiht the latest high-resolution simulation results (Navarro et al., 2004; Graham et al., 2005). However, is probably smaller than the cores which may have been observed in LSB (see e.g. Kleyna et al. (2003), de Blok et al. (2001) and Goerdt et al. (2006)). That said, Ricotti & Wilkinson (2004) have shown that the density profiles do provide good fits to the kinematic data from the Draco Local Group dSph.
4 Conclusions & Discussion
In R03, Ricotti have claimed that central slopes of dark matter density profiles (at a fixed fraction of the virial radius, dictated by the resolution of the simulation) are correlated with halo mass and that the halo concentration at the redshift of virialization is a universal constant. This result is consistent with the finding of recent high-resolution simulations at (Navarro et al., 2004; Graham et al., 2005) in which is found that the slope of the density profile in halos become flatter with decreasing radius without converging to any asymphotic value.
It’s often a misconception that the results in R03 contradict several published papers. For example, Merritt et al. (2005, 2006) found that the average inner slope for four dwarfs at with mass M⊙ is as compared with for 8 clusters. This does not contradict our result because clusters and dwarfs virialize at very different redshifts. The virial radius and concentration of dwarfs at has increased by a factor from the redshift of their formation, . Hence, the inner slope we measure, i.e., at 5%-10% of the virial radius in M⊙ halos at , should be compared to the slope at 0.5%-0.1% of the virial radius at in comparable mass dwarfs. In addition, in the abstract of the same paper, they confirm a dependence of the halo profile on the halo mass, which is the main result in R03. Diemand, Moore, Steidel (2005), found that in minihalos of mass M⊙ at the density profile has inner slope at 10% of the virial radius. But the number of particles in the three halos they look at is a factor of smaller than in our simulations. In addition the power spectrum of density fluctuations they use differs from ours as they use a power law with an exponential cut off at 0.6 parsec. It is not clear how the cut off in the power spectrum can affect the density profile. For example, contrary to our simulations, their halos do not have substructure.
Here, we have re-analyzed the results presented in R03 and run new simulations showing that R03 results are reproducible by using different N-body codes, higher-resolution simulations, and different analysis techniques. Part of the tension between R03 and previous results may be attributed to the method of analysis of the profiles. When fitting the density profiles, as is done in most of previous works, the fitting degeneracy between and does not allow one to understand whether is the slope or the concentration that depends on the mass of the dark halo. If one favors the Subramanian et al. (2000) scaling arguments which express a relation between and the initial power spectrum (thus, between and the enclosed mass ), it is found that the concentration of halos at the redshift of virialization is a universal constant. However, Figure 1 shows that the R03 results can be re-parameterized by taking a different cut through the degeneracy, leading to the more widely accepted notion of the NFW concentration depending on the halo mass and epoch (e.g Bullock et al., 2001; Colín et al., 2004). R03, by analyzing the circular velocities of small mass galaxies at , finds some evidence for cusps shallower than at radii % of the virial radius (in contradiction with NFW profiles). Here, using a different non-parameterized analysis we also find some evidence for a flatter than power-law of the density profile within % of the virial radius in galaxies with mass M⊙ at . Note that the scaling argumennt in Subramanian et al. (2000) advocated by R03 suggests that the density profile does not converges toward any given asymptotic value of the logarithmic slope but rather becomes gradually flatter toward the center. This is in good agreement with the results of recent high-resolution simulations at (Navarro et al., 2004; Graham et al., 2005). However, the present work does not have sufficient resolution to investigate this hypothesis and compare the goodness of different shapes for the fitting function.
Acknowledgments
We thank Justin Read for feedback. The simulations were run on the COSMOS supercomputer at the DAMTP, Cambridge. COSMOS is a UK-CCC facility which is supported by HEFCE and PPARC.
References
- Bertschinger (1995) Bertschinger, E. 1995, arXiv:astro-ph/9506070 only
- Bullock et al. (2001) Bullock, J. S., Kolatt, T. S., Sigad, Y., Somerville, R. S., Kravtsov, A. V., Klypin, A. A., Primack, J. R., & Dekel, A. 2001, MNRAS, 321, 559
- Cen et al. (2004) Cen, R.-Y., Dong, F., Bode, P., & Ostriker, J. P. 2004, ApJSubmitted
- Colín et al. (2004) Colín, P., Klypin, A., Valenzuela, O., & Gottlöber, S. 2004, ApJ, 612, 50
- de Blok & Bosma (2002) de Blok, W. J. G., & Bosma, A. 2002, A&A, 385, 816
- de Blok et al. (2001) de Blok, W. J. G., McGaugh, S. S., Bosma, A., & Rubin, V. C. 2001, ApJ, 552, L23
- Gnedin & Bertschinger (1996) Gnedin, N. Y., & Bertschinger, E. 1996, ApJ, 470, 115
- Goerdt et al. (2006) Goerdt, T., Moore, B., Read, J. I., Stadel, J., & Zemp, M. 2006, MNRAS, Submitted
- Graham et al. (2005) Graham, A. W., Merritt, D., Moore, B., Diemand, J., & Terzic, B. 2005, AJ, submitted
- Jing (2000) Jing, Y. P. 2000, ApJ, 535, 30
- Jing & Suto (2000) Jing, Y. P., & Suto, Y. 2000, ApJ, 529, L69
- Kleyna et al. (2003) Kleyna, J. T., Wilkinson, M. I., Gilmore, G., & Evans, N. W. 2003, ApJ, 588, L21
- Merritt et al. (2005) Merritt, D., Navarro, J. F., Ludlow, A., & Jenkins, A. 2005, ApJ, 624, L85
- Moore et al. (1999) Moore, B., Quinn, T., Governato, F., Stadel, J., & Lake, G. 1999, MNRAS, 310, 1147
- Navarro et al. (1996) Navarro, J. F., Frenk, C. S., & White, S. D. M. 1996, ApJ, 462, 563
- Navarro et al. (1997) Navarro, J. F., Frenk, C. S., & White, S. D. M. 1997, ApJ, 490, 493
- Navarro et al. (2004) Navarro, J. F., et al. 2004, MNRAS, 349, 1039
- Porciani et al. (2002) Porciani, C., Dekel, A., & Hoffman, Y. 2002, MNRAS, 332, 325
- Power et al. (2003) Power, C., Navarro, J. F., Jenkins, A., Frenk, C. S., White, S. D. M., Springel, V., Stadel, J., & Quinn, T. 2003, MNRAS, 338, 14
- Read et al. (2006) Read, J. I., Pontzen, A. P., & Viel, M. 2006, MNRAS, 371, 885
- Ricotti (2003) Ricotti, M. 2003, MNRAS, 344, 1237
- Ricotti & Gnedin (2005) Ricotti, M., & Gnedin, N. Y. 2005, ApJ, 629, 259
- Ricotti & Wilkinson (2004) Ricotti, M., & Wilkinson, M. I. 2004, MNRAS, 353, 867
- Springel (2005) Springel, V. 2005, MNRAS, 364, 1105
- Springel et al. (2001) Springel, V., Yoshida, N., & White, S. D. M. 2001, New Astronomy, 6, 79
- Subramanian et al. (2000) Subramanian, K., Cen, R., & Ostriker, J. P. 2000, ApJ, 538, 528
- Taylor & Navarro (2001) Taylor, J. E., & Navarro, J. F. 2001, ApJ, 563, 483
| Sim | Constraint: | Constraint: | ||||
|---|---|---|---|---|---|---|
| Mean | Variance | Mean | Variance | |||
| at | ||||||
| R03-1 | 0.6 | 11 | 1.4 | 12 | ||
| GR03-1 | 0.7 | 15 | 1.5 | 13 | ||
| G256-1 | 0.5 | 11 | 1.0 | 12 | ||
| G512-1 | 0.6 | 120 | 1.2 | 111 | ||
| at | ||||||
| R03-32 | 0.3 | 11 | 1.4 | 12 | ||
| G256-32 | 0.4 | 15 | 1.6 | 8 | ||
| at | ||||||
| R03-256 | 0.4 | 11 | 2.6 | 12 | ||
| GR03-256 | 0.4 | 15 | 3.0 | 14 | ||
| G256-256 | 0.4 | 16 | 3.6 | 15 | ||
Note. — Results for fitting a split power law profile to the 40 most massive halos in each simulation, with constraints as follows: (1) Fix (as in Ricotti & Wilkinson (2004)), and measure ; (2) Fix (as NFW/C04), and measure . There is no detectable correlation between the halo masses and any of the parameters analyzed here. Therefore the results are a true reflection of the ensemble of halos and their intrinsic scatter. Note that the for both constraint are comparable: there is no evidence that one is to be preferred over the other. The higher in the G512 halos is to be expected due to the constant systematics but smaller Poisson errors. The values obtained for the NFW concentration are in agreement with those obtained in other published results, once corrected for redshift (see e.g. Bullock et al. 2001)