Persistence of the 0.7 anomaly of quantum point contacts in high magnetic fields
Abstract
The spin degeneracy of the lowest subband that carries one-dimensional electron transport in quantum point contacts appears to be spontaneously lifted in zero magnetic field due to a phenomenon that is known as the 0.7 anomaly. We measured this energy splitting, and studied how it evolves into a splitting that is the sum of the Zeeman effect and a field-independent exchange contribution when applying a magnetic field. While this exchange contribution shows sample-to-sample fluctuations, it is for all QPCs correlated with the zero-field splitting of the 0.7 anomaly. This provides evidence that the splitting of the 0.7 anomaly is dominated by this field-independent exchange splitting.
A quantum point contact (QPC) is a short ballistic transport channel between two electron reservoirs. Its conductance as a function of channel width is quantizedvanWees1988 ; Wharam1988 and shows plateaus at integer multiples of , where the electron charge and Planck’s constant. Remarkably, almost all semiconductor QPCs show an additional plateau at . Earlier workThomas1996 ; Thomas1998 ; Kristensen2000 ; Cronenwett2002 ; Starikov2003 ; Reilly2005 ; DiCarlo2006 ; Rejec2006 related this ”0.7 anomaly” to a spontaneous removal of spin degeneracy in zero magnetic field for the lowest one-dimensional subband in the QPC.
Understanding the 0.7 anomaly has been the topic of on-going research for more than a decade now Fitzgerald2002 ; Ennslin2006 , and is of interest for spintronics and quantum information proposals where QPCs are a key element. It cannot be described with a single-particle theory, and QPCs are therefore also an important model system for studies of many-body physics in nanodevices. Recent progress includes evidence that the 0.7 anomaly has similarities with transport through a Kondo impurity Cronenwett2002 ; Meir2002 . This is now supported by numerical simulations of realistic QPC geometries that show that a bound spin-polarized many-body state can spontaneously form inside an open QPC system Rejec2006 . Graham et al. reported evidence that many-body effects also play a role in magnetic fields at crossings between Zeeman levels of different subbands Graham2003 , and at crossings of spin-split subbands with reservoir levels Graham2005 . We report here how the many-body effects in QPCs depend on the QPC geometry. We study spin-splittings within one-dimensional subbands, both in zero field and high magnetic fields. While this type of data from individual devices has been reported before Thomas1998 ; Cronenwett2001 , we report here data from a set of 12 QPCs with identical material parameters. This allows us to draw attention to an exchange contribution to the splitting in high magnetic fields, and to correlate this with the physics that underlies the 0.7 anomaly.
We realized our QPCs using a GaAs-AlGaAs heterostructure with a two-dimensional electron gas (2DEG) 114 nm below its surface (see Methods). A QPC is formed by applying a negative gate voltage to a pair of electrodes on the wafer surface. The 2DEG below the electrodes is then fully depleted, and tuning of allows for controlling the width of a short one-dimensional transport channel. Our QPCs had different values for the length and width for the electrode spacing that defines the device (inset of Fig. 1a). Note that should not be confused with the actual width of the transport channel that is controlled with .
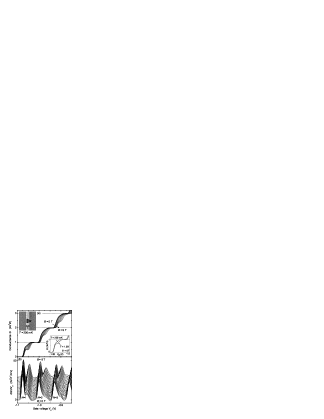
Figure 1a presents the differential conductance of a QPC as a function of , with the source-drain voltage . Increasing from pinch-off () lowers and widens the saddle-point-like potential that defines the short transport channel. Consequently, an increasing number of one-dimensional subbands gets energies below the Fermi level. In zero magnetic field, this results in a step of in the conductance each time an additional subband starts to contribute to transport. We label these spin-degenerate subbands with a number , starting with for the lowest subband. With a high in-plane magnetic field the spin degeneracy within each subband is lifted, and the conductance increases now in steps of .
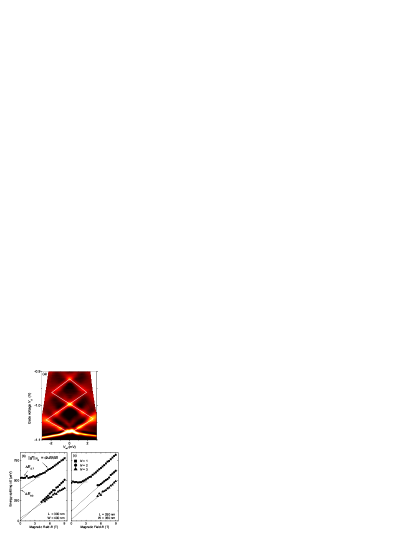
We use this type of data to determine the energy splitting between spin-up and spin-down levels within the subbands . The onset of transport through a next (spin-polarized) subband appears as a peak in transconductance () traces as in Fig. 1b, which we derive from traces as in Fig. 1a. We determine the peak spacing along the axis within each subband by fitting two peaks per subband on the transconductance traces (see Methods). Subsequently, transconductance data from non-linear transport measurements is used for converting values into energy splittings (Fig. 2a). Here, the onsets of conductance plateaus appear as diamond shaped patterns in the plane. The width of these diamonds along the axis defines the subband spacing (a measure for the degree of transverse confinement in the channel), and we use this to determine the spacing between the and subband. The slopes of the diamonds can be used to convert a gate-voltage scale into energy scale Patel1991 .
The 0.7 anomaly is clearly visible in the data set presented in Fig. 1. The conductance trace for zero field in Fig. 1a shows besides pronounced steps of an additional shoulder at , which becomes more pronounced at higher temperatures (inset of Fig. 1a). With increasing magnetic field, the 0.7 anomaly evolves into the first spin-resolved conductance plateau at . In Fig. 1b the 0.7 anomaly appears as a zero-field splitting in the transconductance peak for , which evolves into two spin-split peaks in high fields. In earlier work this observation was the basis for assuming that the 0.7 anomaly results from a spontaneous removal of spin degeneracy in zero field Thomas1996 ; Thomas1998 . For our analysis here we assume that the 0.7 anomaly is indeed related to such a spontaneous spin splitting for the first subband. In high fields, all 12 QPCs showed also for and higher a pronounced spin splitting into two transconductance peaks, but these subbands did not clearly show a zero-field splitting.
We studied how the spin splittings for increase with magnetic field from up to 9 T (Fig. 2b,c). We first concentrate on data for . At zero field shows the splitting associated with the 0.7 anomaly, that we label . It is observed in all our QPCs with a typical value of 0.5 meV. At high fields has a linear slope similar to the Zeeman effect. However, linear extrapolation of this slope down to shows that there is a large positive offset (unlike the usual Zeeman effect). We characterize the slope with an effective g-factor (note that one should be careful to interpret as an absolute indication for the g-factor of electrons in a QPC, since different methods for extracting a g-factor can give different results Cronenwett2002 ; Cronenwett2001 ). The high-field offset from a linear Zeeman effect is characterized with a parameter . Qualitatively, this type of data for looks similar for all 12 QPCs, and we use a suitable fitting procedure (see Methods) to characterize the traces for with the parameters , and . Notably, two-parameter fitting using spin- energy eigenvalues with does not yield good fits. For the traces as in Fig. 2b,c for , we cannot resolve a spin splitting at low fields, and we only provide the parameters and .
Fig. 2b,c show that appears in high fields as the sum of the Zeeman effect and the constant contribution . This suggest that the splittings in high field have, in particular for , a significant contribution from a field-independent exchange effect that results from each subband being in a ferromagnetic spin-polarized state. In high fields such an interpretation is less ambiguous than for zero field (where the possibility of a ferromagnetic ground state for spin-polarized subbands is the topic of debate Klironomos2006 ; Jaksch2006 ) since the Zeeman effect suppresses spin fluctuations. Thus, measuring can be used to determine this exchange splitting.
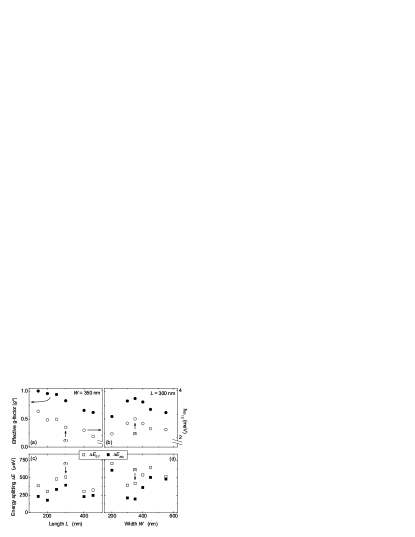
Fig. 3a,b present how the effective g-factor for varies with and of the QPCs. It is strongly enhanced up to a factor with respect to the g-factor for bulk 2DEG material Hannak1995 . This has been observed before Thomas1998 and is also attributed to many-body effects. In the same plot we present the subband spacing . The variation of is in good agreement with an electrostatic analysis Davies1995 of the degree of transverse confinement in the saddle-point-like potential of the QPC. Briefly, short and narrow QPCs yield the strongest transverse confinement (Fig. 3a). This is valid down to the point where the QPC width (where the depth of the 2DEG below the wafer surface), which results in the maximum for in Fig. 3b. Notably, the values of and are clearly correlated. While this is interesting on itself, for the current Letter we restrict ourselves to the conclusion that the variation of these effects with and is very regular. This indicates that part of the physics of our set of 12 QPCs depends in a regular manner on and . This is also supported by the observation that the gate voltage needed for pinching off a QPC varies in the expected way with and .
Next, we analyze how and depend on and . The open squares in Fig. 3c,d present this for . Overall, the dependence here is not very regular, possibly indicating that the exact appearance of the otherwise robust 0.7 anomaly is sensitive to small irregularities in the potential that defines the QPC (only the data in Fig. 3d suggests an anti-correlation with ). The black squares present how for varies with and . Also here the dependence is irregular. Remarkably, the irregular variations of and are clearly correlated throughout our set of 12 QPCs. This means that , which is derived from data in zero field, is correlated with , which is derived from data taken at fields in excess of 5 T. Furthermore, and have a similar order of magnitude. This points to the conclusion that the spontaneous energy splitting of the 0.7 anomaly is dominated by the same effect that causes the high-field offset . As we discussed, this is probably an exchange contribution.
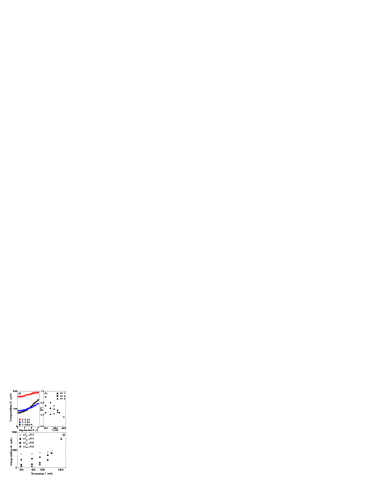
Using the temperature dependence of data (Fig. 4a), we find that the correlation between and remains intact at higher temperatures (Fig. 4c). Figure 4b shows that has a very different temperature dependence. This indicates that the g-factor enhancement and the 0.7 anomaly arise from different many-body effects. Figs. 2 and 4 also present data for the and subband. We analyzed the data for in the very same way as for , and the most important observation is that the parameter for is much smaller than for , and often close to zero. A high value is only observed for , just as 0.7 anomaly itself. Finally, we remark that most of our QPCs showed a zero-bias conductance peak in non-linear transport near the 0.7 anomaly. The temperature and magnetic field dependence of this peak (data not shown) is consistent with reports Cronenwett2002 that relate the 0.7 anomaly to transport through a Kondo impurity.
Our main conclusion is that the many-body electron physics that causes the spontaneous energy splitting of the 0.7 anomaly is related to a field-independent exchange effect that contributes to spin splittings in high magnetic fields. Our results are important for theory work that aims at developing a consistent picture of many-body effects in QPCs, and its consequences for transport of spin-polarized electrons and spin coherence in nanodevices.
METHODS
Device fabrication
Our devices were fabricated using a heterostructure with a 2DEG at 114 nm below the surface from modulation doping with Si. All QPCs were fabricated in close proximity of each other on the same wafer to ensure the same heterostructure properties for all QPCs. At 4.2 K, the mobility of the 2DEG was , and the electron density . Depletion gates were defined with standard electron-beam lithography and lift-off techniques, using deposition of 15 nm of Au with a Ti sticking layer. The reservoirs were connected to macroscopic leads via Ohmic contacts, which were realized by annealing a thin Au/Ge/Ni layer that was deposited on the surface.
Measurement techniques
Measurements were performed in a dilution refrigerator with the sample at temperatures from to 4.2 K. For all our data the temperature dependence saturated when cooling below mK. We therefore assume for this report that this is the lowest effective electron temperature that could be achieved.
For measuring the differential conductance we used standard lock-in techniques at 380 Hz, with an ac voltage bias . Only the contact was connected to the grounded shielding of our setup, and all gate voltages were applied with respect to this ground. The in-plane magnetic field was applied perpendicular to the current direction, and the current in the QPCs was along the crystal orientation. Alignment of the sample with the magnetic field was within 1∘, as determined from Hall voltage measurements on the 2DEG.
We have data from 12 different QPCs from a set of 16 that we cooled down. From these QPCs 4 could not be measured. For two this was due to the presence of strong telegraph noise in conductance signals. Two other QPCs did not show clear conductance plateaus.
Data analysis and fitting procedures
For analyzing QPC conductance values we had to subtract a magnetic field and temperature dependent series resistance (from the wiring and filters, Ohmic contacts and 2DEG) from the transport data that was obtained with a voltage-bias approach. The criterium here was to make the observed conductance plateaus coincide with integer multiples of or .
To determine the peak spacings in the transconductance traces, we assume that each subband contributes in a parallel manner to the QPC conductance. The transconductance curves can then be analyzed as a superposition of peaks, with one (two) peak(s) per (spin-split) subband. We carried out a least squares fitting with peak shapes (for example Gaussian or Lorentzian, we checked that our results do not depend significantly on the choice of peak shape we used here). The specific shape of a step between the quantized conductance plateaus depends on the shape of the saddle-point-like potential that defines the QPC Buttiker1990 , and can result in asymmetric transconductance peaks. We checked that this is not a significant effect for our analysis. In the analysis of and conversion of into we observed a weak dependence on magnetic field and temperature, and took this in account.
The energy splittings versus magnetic field from data taken at 200 mK (as in Figs. 2b,c) showed for all 12 different QPCs a clear constant part (typically for fields below 2 T), and a clear linear part (with an offset, typically for fields above 5 T). On these parts of the data we performed a least-square fitting with a constant or linear function to determine the parameters , and . We checked that the values of the derived parameters did not significantly depend on the choice for these magnetic field intervals that we used here.
Acknowledgements
We thank B. H. J. Wolfs, R. N. Schouten, S. F. Fischer, C. W. J. Beenakker and L. S. Levitov for help and useful discussions, and the Dutch Foundation for Fundamental Research on Matter (FOM), the Netherlands Organization for Scientific Research (NWO), and the German BMBF (in the framework of the nanoQUIT-program) for financial support.
References
- (1) B. J. van Wees et al., Quantized conductance of point contacts in a two-dimensional electron gas, Phys. Rev. Lett. 60, 848 (1988).
- (2) D. A. Wharam et al., One-dimensional transport and the quantisation of the ballistic resistance, J. Phys. C 21, L209 (1988).
- (3) K. J. Thomas et al., Possible Spin Polarization in a One-Dimensional Electron Gas, Phys. Rev. Lett. 77, 135 (1996).
- (4) K. J. Thomas et al., Interaction effects in a one-dimensional constriction, Phys. Rev. B 58, 4846 (1998).
- (5) A. Kristensen et al., Bias and temperature dependence of the 0.7 conductance anomaly in quantum point contacts, Phys. Rev. B 62, 10950 (2000).
- (6) S. M. Cronenwett et al., Low-Temperature Fate of the 0.7 Structure in a Point Contact: A Kondo-like Correlated State in an Open System, Phys. Rev. Lett. 88, 226805 (2002).
- (7) A. A. Starikov, I. I. Yakimenko, and K.-F. Berggren et al., Scenario for the 0.7-conductance anomaly in quantum point contacts, Phys. Rev. B 67, 235319 (2003).
- (8) D. J. Reilly, Phenomenological model for the 0.7 conductance feature in quantum wires, Phys. Rev. B 72, 033309 (2005).
- (9) L. DiCarlo et al., Shot-Noise Signatures of 0.7 Structure and Spin in a Quantum Point Contact, Phys. Rev. Lett. 97, 036810 (2006).
- (10) T. Rejec and Y. Meir, Magnetic impurity formation in quantum point contacts, Nature 442, 900 (2006).
- (11) R. Fitzgerald, Quantum Point Contact Mysteries Re-examined, Phys. Today 55, 21 (May 2002).
- (12) K. Ensslin, Pinning down the last spin, Nat. Phys. 2, 587 (2006).
- (13) Y. Meir, K. Hirose and N. S. Wingreen, Kondo Model for the ”0.7 Anomaly” in Transport through a Quantum Point Contact, Phys. Rev. Lett. 89, 196802 (2002).
- (14) A. C. Graham et al., Interaction Effects at Crossings of Spin-Polarized One-Dimensional Subbands, Phys. Rev. Lett. 91, 136404 (2003).
- (15) A. C. Graham, M. Pepper, M. Y. Simmons and D. A. Ritchie, Anomalous spin-dependent behavior of one-dimensional subbands, Phys. Rev. B 72, 193305 (2005).
- (16) S. M. Cronenwett, Coherence, Charging, and Spin Effects in Quantum Dots and Quantum Point Contacts, PhD thesis, Stanford University (2001).
- (17) N. K. Patel et al., Evolution of half plateaus as a function of electric field in a ballistic quasi-one-dimensional constriction, Phys. Rev. B 44, 10973 (1991).
- (18) A. D. Klironomos, J. S. Meyer and K. A. Matveev, Spontaneous spin polarization in quantum wires, Europhys. Lett. 74, 679 (2006).
- (19) P. Jaksch, I. Yakimenko and K.-F. Berggren. From quantum point contacts to quantum wires: Density-functional calculations with exchange and correlation effects, Phys. Rev. B 742, 235320 (2006).
- (20) R. M. Hannak, M. Oestreich, A. P. Heberle, W. W. Rühle and K. Köhler, Electron g factor in quantum wells determined by spin quantum beats, Solid State Commun. 93, 319 (1995).
- (21) J. H. Davies and I. A. Larkin, Modeling the patterned two-dimensional electron gas: Electrostatics, J. Appl. Phys. 77, 4504 (1995).
- (22) M. Büttiker, Quantized transmission of a saddle-point constriction, Phys. Rev. B 41, 7906 (1990).