Space Velocities of L- and T-type Dwarfs
Abstract
We have obtained radial velocities of a sample of 18 ultracool dwarfs with spectral types in the interval M6.5–T8 using high-resolution, near-infrared spectra obtained with NIRSPEC and the Keck II telescope. Among our targets there are two likely field stars of type late M, one M6.5 Pleiades brown dwarf, and fifteen L and T likely brown dwarfs of the solar neighborhood with estimated masses in the range 30–75 . Two dwarfs, vB 10 (M8V) and Gl 570 D (T7.5V/T8V), are known wide companions to low-mass stars. We have confirmed that the radial velocity of Gl 570 D is coincident with that of the K-type primary star Gl 570 A, thus providing additional support for their true companionship. The presence of planetary-mass companions around 2MASS J055919141404488 (T4.5V) has been analyzed using five NIRSPEC radial velocity measurements obtained over a period of 4.37 yr. Using our radial velocity data and the radial velocities of an additional set of eight L-type dwarfs compiled from the literature in combination with their proper motions and trigonometric parallaxes, we have computed space motions for the complete expanded sample, which comprises a total of 21 L and T dwarfs within 20 pc of the Sun. This ultracool dwarf population shows velocities that nicely overlap the typical kinematics of solar to M-type stars within the same spatial volume. However, the mean Galactic ( = 44.2 km s-1) and tangential ( = 36.5 km s-1) velocities of the L and T dwarfs appear to be smaller than those of G to M stars. A significant fraction (40%) of the L and T dwarfs lies near the Hyades moving group (0.4–2 Gyr), which contrasts with the 10–12% found for earlier-type stellar neighbors. Additionally, the distributions of all three components ( = 30.2, 16.5, 15.8 km s-1) and the distributions of the total Galactic ( = 19.1 km s-1) and tangential ( = 17.6 km s-1) velocities derived for the L and T dwarf sample are narrower than those measured for nearby G, K, and M-type stars, but similar to the dispersions obtained for F stars. This suggests that, in the solar neighborhood, the L- and T-type ultracool dwarfs in our sample (including brown dwarfs) is kinematically younger than solar-type to early M stars with likely ages in the interval 0.5–4 Gyr.
1 Introduction
L- and T-type dwarfs are very cool ( 2200 K), intrinsically faint objects of recent discovery (e.g., Nakajima et al., 1995; Ruiz et al., 1997; Delfosse et al., 1997; Martín et al., 1997; see review by Kirkpatrick, 2005), which are frequently referred to as “ultracool” dwarfs. Over 500 of these ultracool objects have been identified to date. Many of them are found isolated in the solar neighborhood, i.e., within 50 pc of the Sun; only a few appear as widely separated ( 10 AU) companions to stars (e.g., Nakajima et al., 1995; Rebolo et al., 1998; Burgasser et al., 2000; Kirkpatrick et al., 2001; Liu et al., 2002; Potter et al. 2002, 2002; Metchev & Hillenbrand, 2004) and as tight stellar companions (Freed et al., 2003). Yet their physical and kinematic properties are not fully known. According to theoretical evolutionary models (e.g., Burrows et al., 1997; Chabrier & Baraffe, 2000), the late L and T dwarfs of the solar neighborhood are brown dwarfs with likely substellar masses in the range 0.03–0.075 .
The detailed studies of low-resolution spectra and color–magnitude diagrams of L and Tdwarfs (e.g., Leggett et al., 2002; Patten et al., 2006; Kirkpatrick et al., 1999; Martín et al., 1999; Geballe et al., 2002; Burgasser et al., 2002) are beginning to shed light on the physical characteristics of these low-mass objects because an increasing number of trigonometric parallaxes (distances) have been determined for field ultracool dwarfs (Dahn et al., 2002; Tinney et al., 2003; Vrba et al., 2004; Knapp et al., 2004). Besides distance and proper motion, the additional ingredient for a complete kinematic study employing space velocity components is radial velocity. Reid et al. (2002), Mohanty & Basri (2003) and Bailer-Jones (2004) have obtained the first radial velocity measurements available for L-type dwarfs in the solar vicinity using high-resolution optical spectra. The marked low luminosities of the T dwarfs prevent accurate velocity determination at visible wavelengths.
Therefore, interpretation of the kinematics of the least massive (including the substellar) population of the solar vicinity is less developed than in the case of stars. Various groups have investigated the dynamics and age of the Galactic disk by examining the observed and simulated kinematics of nearby stars (e.g., Nordström et al., 2004, and references therein). It is found that the space velocity dispersion of stars increases with time to the power () with = 0.33 (Binney et al., 2000). Statistically, most solar-type to early M stars within 50 pc of the Sun show kinematic ages very similar to the age of our solar system at about 5 Gyr. A small fraction of these stars turn out to be members of stellar moving groups characterized by much younger ages from a few hundred megayears to a few gigayears (Zuckerman & Song, 2004). However, the nearby, coolest M dwarfs appear to behave differently. As noted by Reid et al. (2002) and Dahn et al. (2002), their kinematics suggest that the latest M stars of the solar neighborhood are on average younger than earlier-type stars.
Here, we report on radial velocity measurements of ultracool L and T dwarfs obtained from near-infrared spectra (Section 2). Radial velocity variability has been investigated for a few targets in Section 3. These data have been combined with trigonometric parallaxes and proper motions published in the literature to derive galactic velocities in Section 4. Our final remarks and conclusions are given in Section 5.
2 The sample and observations
The sample of targets is listed in Table Space Velocities of L- and T-type Dwarfs. It comprises three late M-type dwarfs, one of which (PPl 1 or Roque 15) is a young, lithium-bearing brown dwarf of the Pleiades cluster (Stauffer et al., 1998). The remaining targets are six L- and nine T-type field dwarfs recently discovered by the 2MASS, SLOAN, and Denis surveys. The discovery papers are all indicated in Table 1 of Zapatero Osorio et al. (2006). The spectral types given in the second column of Table Space Velocities of L- and T-type Dwarfs are taken from the literature (Kirkpatrick et al., 1997, 1999, 2000; Martín et al., 1999; Geballe et al., 2002; Burgasser et al., 2006; Phan-Bao et al., 2006). They were derived from optical and/or near-infrared low-resolution spectra and are in the interval M6.5–T8. There are objects that have been classified differently by the various groups; we provide all classifications in Table Space Velocities of L- and T-type Dwarfs, first that of Kirkpatrick et al. (1999) and Burgasser et al. (2006), second that of Geballe et al. (2002), and finally, the classification from Martín et al. (1999). In terms of effective temperature, our sample spans the range 2700–770 K (Leggett et al., 2000; Vrba et al., 2004). J033449 and vB 10 can be stars in our sample while the remaining targets are very likely substellar.
We collected high-resolution near-infrared spectra of the 18 ultracool dwarfs using the Keck II telescope and the NIRSPEC instrument, a cross-dispersed, cryogenic echelle spectrometer employing a 1024 1024 ALADDIN InSb array detector. These observations were carried out on different occasions from 2000 December through 2006 January and are part of our large program aimed at the study of radial velocity variability. The complete journal of the observations is shown in Table 1 of Zapatero Osorio et al. (2006), since these data were previously used to determine the rotational velocities of the sample, including the young, lithium-bearing field brown dwarf LP 94420. We note that the radial velocity of LP 94420 using NIRSPEC spectra is fully discussed in Martín et al. (2006). In the echelle mode, we selected the NIRSPEC-3 (-band) filter and an entrance slit width of 0432 (i.e., 3 pixels along the dispersion direction of the detector), except for eight targets (J222401, J172839, J163219, J134600, J162400, J155315, J121703, and GL 570D) for which we used an entrance slit width of 0576. The length of both slits was 12″. All observations were performed at an echelle angle of 63°. This instrumental setup provided a wavelength coverage from 1.148 up to 1.346 m split into ten different orders, a nominal dispersion ranging from 0.164 (blue wavelengths) to 0.191 Å/pix (red wavelengths), and a final resolution element of 0.55–0.70 Å at 1.2485 m (roughly the central wavelength of the spectra), corresponding to a resolving power 17800–22700. Individual exposure times were a function of the brightness of the targets, ranging from 120 to 900 s.
2.1 Data reduction
Raw data were reduced using the ECHELLE package within IRAF111IRAF is distributed by National Optical Astronomy Observatory, which is operated by the Association of Universities for Research in Astronomy, Inc., under contract with the National Science Foundation.. Spectra were collected at two or three different positions along the entrance slit. Nodded images were subtracted to remove sky background and dark current. White-light spectra obtained with the same instrumental configuration and for each target were used for flat-fielding the data. All spectra were calibrated in wavelength using the internal arc lamp lines of Ar, Kr, and Xe, which were typically acquired after observing the targets. The vacuum wavelengths of the arc lines were identified and we produced fits using a third-order Legendre polynomial along the dispersion axis and a second-order one perpendicular to it. The mean rms of the fits was 0.03 Å, or 0.7 km s-1. In order to correct for atmospheric telluric absorptions, near-infrared featureless stars of spectral types A0–A2 were observed several times and at different air masses during the various observing runs. The hydrogen line at 1.282 m, which is intrinsic to these hot stars, was removed from the spectra before using them for division into the corresponding science data. Finally, we multiplied the science spectra by the black-body spectrum for the temperature of 9480 K, which is suitable for A0V type (Allen, 2000).
We have plotted in Figures 1 to 3 all of our spectra corresponding to the echelle orders centered at 1.230 m, the K i doublet (1.2485 m), and 1.292 m. These are orders relatively free of strong telluric lines. Effective temperature (i.e., spectral type) decreases from top to bottom. Note that all spectra have been shifted in velocity to vacuum wavelengths for easy comparison of the atomic and molecular features. The signal-to-noise ratio of the data varies for different echelle orders and different targets depending on their brightness. In general, the red orders show better signal-to-noise ratio than the blue orders, except for the reddest order centered at 1.337 m in T dwarfs since these wavelengths are affected by strong methane and water vapor absorptions below 1300 K.
2.2 Data analysis: radial velocities
We note that systematic errors or different zero-point shifts may be present in the instrumental wavelength calibration of our data, which may affect the radial velocity measurements. Various authors (Tinney & Reid, 1998; Martín, 1999; Mohanty & Basri, 2003; Basri & Reiners, 2006) have reported on the stable heliocentric velocity of the M8V dwarf vB 10, finding an average value of 35.0 km s-1. From our two NIRSPEC spectra and using the centroids of the K i lines, we derived 35.0 and 34.3 km s-1 with an estimated uncertainty of 1.5 km s-1 associated with each individual determination. These measurements are fully consistent with those in the literature. Furthermore, we have compared NIRSPEC spectra corresponding to echelle orders that contain a considerable number of telluric lines and that were observed during a night and on different nights. We found that the telluric lines typically differ by less than 1 km s-1 in velocity. All this suggests that any systematic errors or different zero-point shifts in our radial velocities are likely smaller than the measurement uncertainties, which are typically 1 km s-1.
We derived heliocentric radial velocities, , via a cross-correlation of the spectra of our tarets against spectra of dwarfs of similar types with known heliocentric velocity. The details of the procedure are fully described in the literature (e.g., Marcy & Benitz, 1989). Summarizing, heliocentric radial velocities were obtained from the Doppler shift of the peak of the cross-correlation function between the targets and the templates. To determine the center of the cross-correlation peak we typically fit it with a Gaussian function using the task FXCOR in IRAF. This provides observed velocities that are corrected for the Earth’s motions during the observations and converted into heliocentric velocities. Only orders for which we unambiguously identified the peak of the cross-correlation function and obtained good Gaussian fits were employed (see Figure 4 for examples of cross-correlation functions and Gaussian fits). We typically used between 4 and 8 echelle orders depending on the signal-to-noise ratio of the data. All results were then averaged to produce the final measurements. Uncertainties are derived from the standard deviation of the mean.
We used the M8V-type dwarf vB 10 as the primary reference/template object for several reasons: first, it is a slow rotator (Mohanty & Basri, 2003), thus providing narrow cross-correlation peaks; second, its radial velocity is well determined in the literature to be 35.0 km s-1; and third, the signal-to-noise ratio of its NIRSPEC spectra is reasonably good (see Figures 1 to 3), minimizing the data noise introduced in the cross-correlation method. This technique assumes that the target and template spectra are of similar type and differ only in the rotation velocity. Nevertheless, Bailer-Jones (2004) has recently shown that M-type templates can also yield accurate velocities for L dwarfs. In our sample, the energy distribution of T dwarfs does differ significantly from M dwarfs, and we found that for the early T-type targets the cross-correlation with vB 10 gives reasonable results if the resonance lines of K i are avoided and only molecular (particularly water vapor) lines are used in the cross-correlation. For the late-type objects, cooler templates are required. We employed J222401 (L4.5V), J055914 (T4.5V), and J121703 (T7–8V) as secondary reference dwarfs to obtain the radial velocities of the L- and T-type objects in the sample. Rotation velocities of all targets are provided in column 10 of Table Space Velocities of L- and T-type Dwarfs (Zapatero Osorio et al., 2006). The three secondary templates have moderate rotation in the interval sin = 22–31 km s-1. However, the derived error bars on radial velocity do not appear to be significantly higher than using the slow rotator vB 10, suggesting that, for the spectral resolution and signal-to-noise ratio of our data, radial velocity accuracy shows little dependence on rotation velocity up to sin 30 km s-1.
Columns 5 through 8 of Table Space Velocities of L- and T-type Dwarfs show our measured for all objects observed on different occasions in this program. We also give the observing dates in columns 3 (Universal Time) and 4 (Modified Julian Date). Whenever there is more than one observation available per object, the first spectrum also acts as a template spectrum to obtain radial velocities via the cross-correlation technique, and the derived velocities are provided in column 9 of Table Space Velocities of L- and T-type Dwarfs. This minimizes the effects of using templates of different spectral types and serves as a test of consistency. Furthermore, such a procedure will allow us to study binarity. Previous radial velocities reported in the literature are listed in the eleventh column of the Table. We note that, with the exception of PPl 1 (see below), all of our measurements agree with the literature values to within 1- of the claimed uncertainty.
3 Binarity
Gl 570D is a known wide companion (1500 AU) to the multiple system Gl 570ABC (Burgasser et al., 2000). We have determined its heliocentric velocity to be 28.5 2.7 km s-1, which is coincident with the radial velocity of the K-type star Gl 570A ( = 27.0 0.3 km s-1) as measured by Nidever et al. (2002). This suggests that Gl 570D is not a short-period binary of mass ratio near 1. The secondary companion, Gl 570BC, is a spectroscopic binary whose radial velocities span the range 8.8–37.9 km s-1 (e.g., Marcy & Benitz, 1989).
Multiple NIRSPEC spectra obtained on different occasions are available for five dwarfs in our sample. These are shown in Table 2, where we also provide the time elapsed between the first and last observation and the mean heliocentric velocity per object with the associated average error bar. Inspection of all velocities listed in Table Space Velocities of L- and T-type Dwarfs reveals no obvious trace of moderate velocity perturbation in any of the dwarfs since all their measured agree within the uncertainties over the time span of the data. This indicates that the dwarfs of Table 2 are not very likely to be close equal-mass binaries.
To relate companion mass to the dispersion of our radial velocities we use the mass function derived from the Keplerian equations (e.g., Marcy & Benitz, 1989). The most constraining case in our sample is the T4.5V dwarf J055914. For it we can study the presence of planetary-mass companions in short (a few days or 0.01 AU) and intermediate (a few years or 0.4 AU) orbits. J055914 radial velocity curve exhibits 1- standard deviation of 0.50 km s-1. For a primary mass of about 60 , expected for mid-T field dwarfs with an age of 5 Gyr (Chabrier & Baraffe, 2000), and at the 3- level, companions more massive than 2 (short periods) and 10 (1-yr period) can be excluded. Figure 5 summarizes these results graphically. The region of parameter space excluded for planets around J055914 is comparable to the region excluded around stars. However, because of the time coverage of our observations of J055914, we cannot reach firm conclusions on the presence of companions with orbital periods between days and less than a year. Circular orbits have been adopted to compute these estimates. We consider these minimum mass estimates to represent approximate guidelines in future corroborative spectroscopic work.
Regarding J003618 and J053900, the null detection of radial velocity variations over a few years suggests that no companions of 10 or more can exist near them. Similarly, very close-in companions of a few Jupiter masses may be ruled out orbiting PPl 1 or J033449 with a periodicity of a few days. However, we stress that two radial velocity data points constitute statistically too few observations to reach a final conclusion on the presence of Jovian planets around these objects. Further measurements are certainly required to constrain firmly the minimum mass of any possible companion. However, this exercise indicates that companions with masses in the planetary domain lie near the detectability limit in our data.
Interestingly, Martín et al. (1998) measured the heliocentric velocity of the Pleiades brown dwarf PPl 1 at 15.4 1.6 km s-1, which deviates from our measurement (see Table 2) by more than 4 . Despite the fact that such a difference may suggest the presence of a second object (future observations are pending to test this hypothesis), its total amount seems to be rather large for a planetary companion even though it might account for the peak-to-peak amplitude of the primary radial velocity curve. This may indicate that the companion has a broad orbit and a mass above the deuterium-burning mass limit, i.e., 13 , thus, it belongs to the brown dwarf regime. From the locus of PPl 1 in the vs color-magnitude diagram of the Pleiades cluster, Pinfield et al. (2003) concluded that this object is a probable binary with a mass ratio in the interval = 0.75–1. We note that our NIRSPEC heliocentric velocity of PPl 1 is fully consistent with the systemic velocity of the Pleiades measured at 5.4 0.4 km s-1 (e.g., Liu et al., 1991; Kharchenko et al., 2005), hence providing additional evidence for its membership of this star cluster.
4 Galactic space motions and kinematics
Using our radial velocity measurements and the proper motions and trigonometric parallaxes provided in the literature by Dahn et al. (2002), Vrba et al. (2004), Knapp et al. (2004), and An et al. (2007) we have calculated the , , and heliocentric velocity components in the directions of the Galactic center, Galactic rotation and north galactic pole, respectively, with the formulation developed by Johnson & Soderblom (1987). Note that the right-handed system is employed and that we will not subtract the solar motion from our calculations. The uncertainties associated with each space-velocity component are obtained from the observational quantities and their error bars after the prescriptions of Johnson & Soderblom (1987). Our derivations are shown in Table 3. Unfortunately, two T dwarfs in the sample lack distance and proper motion measurements, thus preventing us from determining their Galactic velocities (these dwarfs are not shown in Table 3). No trigonometric parallaxes are available for PPl 1 and the M9V dwarf J033449; we have adopted the Pleiades distance for the former object (An et al., 2007) and the poorly constrained spectroscopic distance estimate of Phan-Bao et al. (2006) for the latter, which result in relatively large uncertainties associated with the derived velocities.
With the only exceptions of PPl 1 and J172839AB, the remaining objects in our sample with known trigonometric parallax lie within 20 pc of the Sun. To carry out a reliable statistical study of the kinematics of the least massive population in the solar neighborhood, we have enlarged our sample of ultracool dwarfs with an additional set of eight L-type objects of known trigonometric distance ( 20 pc), proper motion and radial velocity (Dahn et al., 2002; Mohanty & Basri, 2003; Bailer-Jones, 2004; Vrba et al., 2004). This additional set is shown in Table Space Velocities of L- and T-type Dwarfs, where we also provide our computations obtained in the manner previously described. Hence, space velocities are finally available for a total of 21 L and T dwarfs located at less than 20 pc from the Sun.
4.1 Star moving groups
For the following discussion, we will focus on the extended sample of L and T dwarfs. Their Galactic motions are depicted in the and planes in Fig. 6. As can be seen from the top panels, the space velocities of most L and T dwarfs appear to be rather scattered in these diagrams, and no preferred region (or clustering) of high density and small velocity dispersion is perceptible. Leggett (1992) summarized the criteria used for kinematically classifying old/young disk and halo stars as follows: objects with 100 km s-1 or high eccentricity in the plane are defined to be halo stars; objects with an eccentricity in the plane of 0.5 are defined to be old disk-halo stars; objects with 50 20, 30 0, and 25 10 km s-1 (i.e., the “young disk” ellipsoid) are defined to be young disk sources. Stars that lie outside this ellipsoid are defined to be old disk or young-old disk objects depending on their velocity. Employing these criteria and from the inspection of the velocities, none of the L and T dwarfs in our study seems to belong to the old-disk or halo kinematic categories; all of them can actually be grouped into the young disk and young–old disk kinematic classifications, suggesting that they are likely objects with ages typical of the solar system and younger.
To further develop this idea, we have superimposed in the bottom panels of Fig. 6 the location of known, nearby star moving groups (streams of stars with common motion through the Milky Way). The velocities and their associated 1- velocity dispersions used to depict the ellipsoids of the various moving groups shown in Fig. 6 are taken from the literature (Eggen, 1992; Chen et al., 1997; Dehnen, 1998; Chereul et al., 1999; Montes et al., 2001; Zuckerman & Song, 2004; Famaey et al., 2005; Zuckerman et al., 2006). Ordered by increasing age, the Pictoris (10–30 Myr), AB Dor (50 Myr), Carina-near (200 Myr), Ursa Majoris (300 Myr), and Hyades (0.4–2 Gyr) moving groups have been selected for the proximity of all their northern and southern stellar members to the Sun (typically less than 55 pc). The open star cluster Hyades (625 Myr) lies within the Hyades moving group. Other young moving groups and star clusters of recent discovery are not included in Fig. 6 because they only contain southern stars, like Tucana/Horologium and the TW Hydrae association, or are located farther away, like Cha and the Pleiades moving group (Zuckerman & Song, 2004). The Hyades moving group is the oldest dynamical stream considered in this work, with stellar ages (derived from A-F stars) spanning the interval 400 Myr to 2 Gyr (Chereul et al., 1999), but probably younger than the canonical age of the solar system.
From the bottom - and -planes of Fig. 6, it becomes apparent that only three dwarfs in our sample, namely J162400 (T6V), J121703 (T7V), and J020511AB (L7V), all have space velocity components roughly consistent with the Hyades moving group and fall inside the 1.5- ellipsoid. These are labeled in the bottom panels of Figure 6. We note that J020511AB is an equal-mass binary separated by 9.2 AU (Koerner et al., 1999), and that the expected amplitude of the radial velocity curve of each component is therefore less than 3 km s-1 for masses below the substellar limit. This has very little impact on the derived velocities of J020511AB.
Our results for J162400, J121703, and J020511AB are in agreement with the previous work by Bannister & Jameson (2007). These authors also found that J003618 (L3.5V/L4V) and J082521 (L7.5V) show proper motion consistent with the Hyades moving group; our measurements lie close to the 2- ellipsoid. Bannister & Jameson (2007) also commented on the fact that all these five ultracool dwarfs sit on a very tight sequence in color-magnitude diagrams (suggesting they are coeval objects) consistent with evolutionary models of 500 Myr. Nevertheless, recent works by Famaey et al. (2005) and De Simone et al. (2004) caution against assigning ages based solely on space motion and star moving group memberships. On the contrary, membership in open star clusters provides reliable age estimates. None of the L and T dwarfs in our sample appears to be unambiguous members of the Hyades star cluster. Recently, Bihain et al. (2006) found that the velocity (or proper motion) dispersion of Pleiades brown dwarfs (120 Myr) is about a factor of four times higher than that of solar-mass stars in the cluster. In our sample, only J121703 has space velocities close to the 4- ellipsoid centered at = 42, = 19, = 1 km s-1 (velocity dispersion 0.3 km s-1, De Bruijne et al., 2001), which corresponds to the 625 Myr-old Hyades.
Further study of the bottom - and -planes of Fig. 6 reveals that about 40% of the L and T dwarfs lie near the Hyades moving group either within the 2- ellipsoid or “touching” it (i.e., the error bars cross the 2- ellipsoid). To analyze the significance of such an apparent concentration, we have collected accurate radial velocities, Hipparcos distances and parallaxes of F-, G-, K- and M-type stars within 20 pc of the Sun from the catalog of Kharchenko (2004). A total of 10 F stars, 25 solar-type stars, 58 K, and 52 early M (M0–M5) stars were selected. Their Galactic motions were calculated as for our L–T sample contained within the same spatial volume. The left panels of Fig. 7 show the space velocities of these stars and of our extended sample as a function of heliocentric distance.
After inspection of the space velocity distribution of the G to early M stars in the - and -planes, we found that only 10–12% of the stars (very similar statistics for all three stellar spectral types) lie within or in the “surroundings” of the Hyades moving group, which contrasts with the higher value, 40%, derived for the ultracool dwarfs. Furthermore, under the assumption that the L–T population follows a Poissonian distribution with the same object density than the G to early-M stars, we have estimated the probability of finding eight out of 21 (40%) ultracool dwarfs close to the Hyades moving group to be lower than 1%, indicating that this concentration is significant to a confidence level of about 99%. This suggests that, on average, the L and T population is kinematically younger than the majority of the stars in the solar neighborhood.
4.2 Galactic kinematics and age of the ultracool dwarfs
From the left panels of Fig. 7 it is evident that the components of the L and T dwarfs overlap the range of space velocities observed for the G, K, and early M stars, i.e., they are neither larger nor dramatically smaller despite the reduced mass of the L- and T-type objects. We can discuss this further by producing the histograms shown in the middle panels of Fig. 7, which depict the distributions for the three populations (K-type stars, early M stars, and the L and T ultracool dwarfs). The cumulative distributions are displayed in the right-most panels of Fig. 7. We can compare these distributions quantitatively using the Kolmogorov–Smirnov test. Such comparison globally shows that there is a probability of more than 15% that the ultracool dwarfs and the K and M0–M5 stars are drawn from the same kinematic population. While this holds for a comparison between the and velocity dispersions of the L–T dwarfs and the K–M stellar samples, the test suggests larger differences for the distributions (galactic rotation) of the K-type stars and the ultracool dwarfs; however, these differences are not statistically meaningful and we will not discuss them further.
In addition, the width of the histograms of Fig. 7, represented by the parameters , is relevant for a complete kinematic analysis. It is well established that all three velocity dispersions increase with age (Spitzer & Schwarzschild, 1951; Mayor, 1974; Wielen, 1977). We have obtained , and for each stellar and substellar populations (see Table Space Velocities of L- and T-type Dwarfs). The Galactic motion dispersions of the G- to M5-type stars are in full agreement with the values obtained for the thin disk of the Galaxy available in the literature (e.g., Hawley et al., 1996; Bensby et al., 2003), even though all these works include a larger number of stars and volumes in their studies. All the L and T dwarfs in our sample have typical perpendicular distances to the Galactic plane in the interval 15 pc. Our and derivations for the F-type stars also coincide with the literature; however, the derived value appears smaller than the 20 km s-1 found for the thin disk A and F stars by Bensby et al. (2003). This could be explained as statistical noise due to the relative small number (10) of F stars in our study.
We have found that the Galactic velocity distributions corresponding to the ultracool L–T dwarfs are narrower (i.e., lower dispersions in all three space velocities) than those of G to M5 stars. However, our derived , and for the L–T dwarfs are remarkably similar to results obtained for M-type emission-line stars (e.g., Hawley et al., 1996) and very active M7-type stars (West et al., 2006), which are generally assigned ages of less than 3 Gyr (Reid et al., 2002). We also note that if the 40% of the L and T dwarfs lying within and near the Hyades moving group in the planes is removed from the statistical analysis, the three parameters , and will gently increase; nevertheless, they remain smaller than the Galactic velocity dispersions observed for solar to early-M stars. Interestingly, all three of L and T dwarfs resemble the velocity dispersions of F-type stars (Table Space Velocities of L- and T-type Dwarfs), suggesting that the two populations (despite their very different mass) share similar ages on average.
There are various empirical calibrations of the relationship between velocity dispersion, particularly , and age (Mayor, 1974; Haywood et al., 1997; e.g., Nordström et al., 2004, and references therein) that we can use to estimate the mean age for our kinematic samples. According to the -age relations provided in Tables 2 (A and F stars) and 3 (G-K-M stars) by Mayor (1974), the mean age of the 20-pc sample of F stars is about 2 Gyr, and that of the G to early M stars is about 5 Gyr (i.e., the age of the Sun). Wielen (1977) published a mathematical relation between age and the dispersion of the total Galactic velocity (see also Schmidt et al. (2007)). We have computed the mean Galactic velocity, , and its associated dispersion, , for all spectral types listed in Table Space Velocities of L- and T-type Dwarfs. Galactic velocities comprise the three components of the space velocities and as such, may summarize the statistical effects seen in each velocity component (unless they are canceled out). The kinematical ages derived from Wielen (1977) equation are also provided in the Table. The L–T population shows a kinematical age in the range 0.5–2.3 Gyr; it thus appears to be a factor of two younger than the low-mass stars of the solar neighborhood. From the analysis of the tangential velocities of a sample of late M and L dwarfs, Dahn et al. (2002) and Schmidt et al. (2007) also concluded that these objects have a mean age of 2–4 Gyr, consistent with our derivation. The fact that the late M-type stars of the solar vicinity appear to be younger, on average, than earlier-type stars was previously suggested in the literature (Hawkins & Bessell, 1988; Kirkpatrick et al., 1994; Reid et al., 1994, 2002). Here, we extend this result to the coolest spectral types (L and T) including the brown dwarf population.
Finally, various groups have also pointed out that nearby, very low-mass stars tend to have smaller space motions compared to the earlier-type stars, although the difference is claimed to be of marginal significance (Reid et al., 2002; Dahn et al., 2002). We provide in Table Space Velocities of L- and T-type Dwarfs the average proper motion, , for the F, G, K, M0–M5, L and T dwarf populations with known trigonometric parallaxes considered in this work (1- dispersions are given in brackets). Nevertheless, the information on the mean distance and the mean proper motion is better encapsulated in the mean tangential velocity, , which we also provide in Table Space Velocities of L- and T-type Dwarfs. To complete the spectral sampling between the early M stars and the ultracool dwarfs of our study we have collected the data of 29 M6–M9 objects at less than 23 pc of the Sun from Table 5 of Reid et al. (2002). These authors obtained accurate radial velocities for these objects and combined them with astrometric proper motions and photometric parallaxes to compute Galactic velocities. We show in Table Space Velocities of L- and T-type Dwarfs our derivation of , and the mean Galactic velocity, proper motion, and tangential velocity for the reduced sample of M6–M9 objects extracted from Reid et al. (2002).
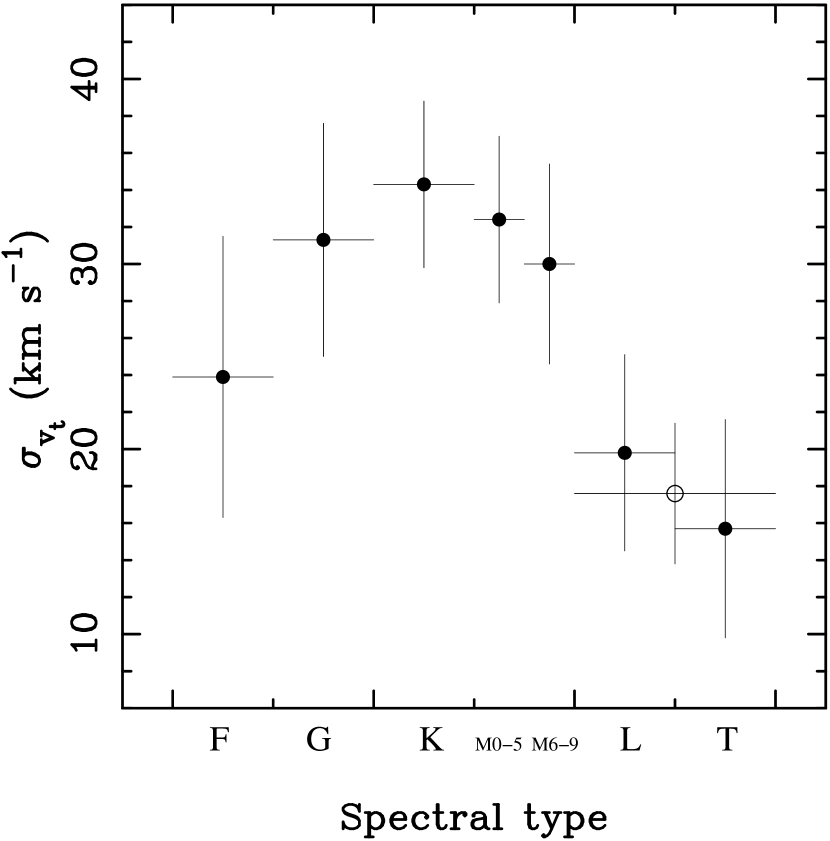
Figure 8 illustrates the dependence of , and their associated dispersions (, ) on spectral type (or mass). We note that the values corresponding to the F-type stars have less statistical weight because they have been derived from a low number of objects. After comparison with the literature values, the Galactic velocity dispersion of F stars shown in Table Space Velocities of L- and T-type Dwarfs is likely to be increased by a few km s-1. The diagrams of Fig. 8 (which do not incorporate this correction) cover a wide range of masses, from 2 (F-type stars) down to 50 (or 0.05 , T-types). Note that we have split our full sample of ultracool dwarfs into the two L and T types. As seen in the right panels of Fig. 8, K-type stars display the largest mean Galactic and tangential velocities, while F stars and the ultracool dwarfs have smaller values. We note that the mean velocities of M6–M9 stars are comparable to those of the ultracool L and T dwarfs, in perfect agreement with the results obtained for late-M and L-type objects by Schmidt et al. (2007).
The - and -spectral type relations shown in the right panels of Fig. 8 present similar structure: an increasing trend from F to K stars to decrease at cooler types; the L and T population displays the smallest velocity dispersions. We ascribe this behavior to the likely younger kinematical ages of the ultracool and very low-mass objects in the solar neighborhood. There is a hint in our data suggesting that T dwarfs are slightly younger than L dwarfs; further observations and larger samples are required to confirm it. This result may be affected by an observational bias in the way L and T dwarfs are discovered. Since brown dwarfs cool down and grow fainter with age, it is expected that magnitude-limited surveys would find younger objects in general. However, according to state-of-the-art evolutionary model predictions on substellar temperatures and luminosities and the fact that our study is limited to a distance of 20–23 pc, this bias is not largely contaminating our sample of ultracool dwarfs. Any model explaining the population of the Galaxy should account for the relations shown in Fig. 8 quantitatively, which may provide a constraint on the field mass function and the stellar/substellar formation rate.
5 Conclusions
Radial velocities have been obtained for a sample of 18 M6.5–T8 dwarfs using high-resolution ( = 17800–22700), near-infrared (1.148–1.346 m) spectra collected with the NIRSPEC instrument on the Keck II telescope. The sample comprises one M6.5 Pleiades brown dwarf, two late-M field dwarfs, and 15 L and T likely brown dwarfs of the solar neighborhood with masses in the range 30–75 . Our radial velocity measurements further confirm the membership of PPl 1 in the Pleiades cluster, and the true physical companionship of the T7.5V/T8V Gl 570 D dwarf in the Gl 570 multiple system. From five velocity measurements obtained for 2MASS J055919141404488 (T4.5V) over 4.37 yr and the observed velocity dispersion of 0.5 km s-1, we discard the possible presence of massive jovian planets near this brown dwarf with orbits of a few days or around a year.
All the L and T dwarfs in our sample lie 24 pc from the Sun, and trigonometric parallaxes and proper motions are available for nearly all of them from Dahn et al. (2002), Vrba et al. (2004), and Knapp et al. (2004). We have used our radial velocity determinations and astrometric data from the literature to derive Galactic velocities. The total number of ultracool dwarfs within 20 pc of the Sun is augmented up to 21 with the addition of eight L dwarfs of known trigonometric distance, proper motion and radial velocity available in the literature. We have compared the Galactic and tangential velocities of the ultracool dwarf population to those of F, G, K, and M stars contained in the same volumen. The distributions of the complete expanded L and T sample show a smaller dispersion than the G to M stars and a comparable dispersion to the F-type stars. Similar behavior is observed for the total Galactic velocity and tangential velocity dispersions, suggesting that the least massive population, which includes brown dwarfs, is kinematically younger. Furthermore, we find that a significant fraction (40%) of the L and T dwarfs in our sample lies near the location of the Hyades moving group in the and planes in contrast to the low rate (10–12%) observed for stars. This, in addition to the lower dispersions observed in all space velocities, suggests that our sample of L and T dwarfs (many are brown dwarfs) is kinematically young with likely ages below 5 Gyr.
References
- Allen (2000) Allen, W. B. 2000, Allen’s Astrophysical Quantities. Fourth edition, ed. Arthur N. Cox, New York: Springer Verlag, p. 151
- An et al. (2007) An, D., Terndrup, D. M., Pinsonneault, M. H., Paulson, D. B., Hanson, R. B., & Stauffer, J. R. 2007, ApJ, 655, 233
- Bailer-Jones (2004) Bailer-Jones, C. A. L. 2004, A&A, 419, 703
- Bannister & Jameson (2007) Bannister, N. P., & Jameson, R. F. 2007, MNRAS, tmp, L44
- Basri & Reiners (2006) Basri, G., & Reiners, A. 2006, AJ, 132, 663
- Bensby et al. (2003) Bensby, T., Feltzing, S., & Lundström, I. 2003, A&A, 410, 527
- Bihain et al. (2006) Bihain, G., Rebolo, R., Béjar, V. J. S., Caballero, J. A., Bailer-Jones, C. A. L., Mundt, R., Acosta-Pulido, J. A., & Manchado Torres, A. 2006, A&A, 458, 805
- Binney et al. (2000) Binney, J., Dehnen, W., & Bertelli, G. 2000, MNRAS, 318, 658
- Burgasser et al. (2000) Burgasser, A. J., Kirkpatrick, J. D., Cutri, R. M., et al. 2000, ApJ, 531, L57
- Burgasser et al. (2002) Burgasser, A. J., Adam, J., Kirkpatrick, J. D., et al. 2002, ApJ, 564, 421
- Burgasser et al. (2006) Burgasser, A. J., Geballe, T. R., Leggett, S. K., Kirkpatrick, J. D., & Golimowski, D. A. ApJ, 637, 1067
- e.g., Burrows et al. (1997) Burrows, A., Marley, M., Hubbard, W. B., et al. 1997, ApJ, 491, 856
- Chabrier & Baraffe (2000) Chabrier, G., & Baraffe, I. 2000, ARA&A, 38, 337
- Chen et al. (1997) Chen, B., Asiain, R., Figueras, F., & Torra, J. 1997, A&A, 318, 29
- Chereul et al. (1999) Chereul, E., Crézé, M., & Bienaymé, O. 1999, A&ASS, 135, 5
- Dahn et al. (2002) Dahn, C. C., et al. 2002, AJ, 124, 1170
- Dehnen (1998) Dehnen, W. 1998, AJ, 115, 2384
- Delfosse et al. (1997) Delfosse, X., Tinney, C. G., Forveille, T., et al. 1997, A&A, 327, L25
- velocity dispersion 0.3 km s-1, De Bruijne et al. (2001) De Bruijne, J. H. J., Hoogerwerf, R., & De Zeeuw, P. T. 2001, A&A, 367, 111
- De Simone et al. (2004) De Simone, R., Wu, X., & Tremaine, S. 2004, MNRAS, 350, 627
- Eggen (1992) Eggen, O. J. 1992, AJ, 104, 1482
- Famaey et al. (2005) Famaey, B., Jorisse, A., Luri, X., Mayor, M., Udry, S., Dejonghe, H., Turon, C. 2001, A&A, 430, 165
- Freed et al. (2003) Freed, M., Close, L. M., & Siegler, N. 2003, ApJ, 584, 453
- Geballe et al. (2002) Geballe, T. R., Knapp, G. R., Leggett, S. K., et al. 2002, ApJ, 564, 466
- Hawkins & Bessell (1988) Hawkins, M. R. S., & Bessell, M. S. 1988, MNRAS, 234, 177
- e.g., Hawley et al. (1996) Hawley, S. L., Gizis, J. E., & Reid, I. N. 1996, AJ, 112, 2799
- Haywood et al. (1997) Haywood, M., Robin, A. C., Creze, M. 1997, A&A, 320, 428; 320, 440
- Johnson & Soderblom (1987) Johnson, D. R. H., & Soderblom, D. R. 1987, AJ, 93, 864
- Kharchenko (2004) Kharchenko, N. V. 2004, KFNT, 20, 366
- Kharchenko et al. (2005) Kharchenko, N. V., Piskunov, A. E., Röser, S., Schilbach, E., & Scholz, R.-D. 2005, A&A, 438, 1163
- Kirkpatrick et al. (1994) Kirkpatrick, J. D., McGraw, J. T., Hess, T. R., Liebert, J., & McCarthy, D. W. 1994, ApJS, 94, 749
- Kirkpatrick et al. (1997) Kirkpatrick, J. D., Henry, T. J., & Irwin, M. J. 1997, AJ, 113, 1421
- Kirkpatrick et al. (1999) Kirkpatrick, J. D., Reid, I. N., Liebert, J., et al. 1999, ApJ, 519, 802
- Kirkpatrick et al. (2000) Kirkpatrick, J. D., Reid, I. N., Liebert, J., et al. 2000, AJ, 120, 447
- Kirkpatrick et al. (2001) Kirkpatrick, J. D., Dahn, C. C., Monet, D. G., Reid, I. N., Gizis, J. E., Liebert, J., & Burgasser, A. J. 2001, AJ, 121, 3235
- see review by Kirkpatrick (2005) Kirkpatrick, J. D. 2005, ARA&A, 43, 195
- Knapp et al. (2004) Knapp, G., et al. 2004, AJ, 127, 3553
- Koerner et al. (1999) Koerner, D. W., Kirkpatrick, J. D., McElwain, M. W., & Bonaventura, N. R. 1999, ApJ, 526, L25
- Leggett et al. (2000) Leggett, S. K., Allard, F., Dahn, C., Hauschildt, P. H., Kerr, T. H., & Rayner, J. 2000, ApJ, 535, 965
- e.g., Leggett et al. (2002) Leggett, S. K., Golimowski, D. A., Fan, X., et al. 2002, ApJ, 564, 452
- Leggett (1992) Leggett, S. K. 1992, ApJS, 82, 351
- e.g., Liu et al. (1991) Liu, T., Janes, K. A., & Bania, T. M. 1991, ApJ, 377, 141
- Liu et al. (2002) Liu, M. C., Fischer, D. A., Graham, J. R., Lloyd, J. P., Marcy, G. W., & Butler, R. P. 2002, ApJ, 571, 519
- e.g., Marcy & Benitz (1989) Marcy, G. W., & Benitz, K. J. 1989, ApJ, 344, 441
- Martín (1999) Martín, E. L. 1999, MNRAS, 302, 59
- Martín et al. (1997) Martín, E. L., Basri, G., Delfosse, X., & Forveille, T. 1997, A&A, 327, L29
- Martín et al. (1998) Martín, E. L., Basri, G., Gallegos, J. E., Rebolo, R., Zapatero Osorio, M. R., & Béjar, V. J. S. 1998, ApJ, 499, L61
- Martín et al. (1999) Martín, E. L., Delfosse, X., Basri, G., Goldman, B., Forveille, T., & Zapatero Osorio, M. R. 1999, AJ, 118, 2466
- Martín et al. (2006) Martín, E. L., Günther, E., Zapatero Osorio, M. R., Bouy, H., & Wainscoat, R. 2006, ApJ, 644, L75
- Mayor (1974) Mayor, M. 1974, A&A, 32, 321
- Metchev & Hillenbrand (2004) Metchev, S. A., & Hillenbrand, L. A. 2004, ApJ, 617, 1330
- Mohanty & Basri (2003) Mohanty, S., & Basri, G. 2003, ApJ, 583, 451
- Montes et al. (2001) Montes, D., López-Santiago, J., Fernández-Figueroa, M. J., & Gálvez, M. C. 2001, A&A, 379, 976
- e.g., Nakajima et al. (1995) Nakajima, T., Oppenheimer, B. R., Kulkarni, S. R., Golimowski, D. A., Metthews, K., & Durrance, S. T. 1995, Nature, 378, 463
- Nidever et al. (2002) Nidever, D. K., Marcy, G. W., Butler, R. P., Fischer, D. A., & Vogt, S. S. 2002, ApJS, 141, 503
- e.g., Nordström et al. (2004, and references therein) Nordström, B., Mayor, M., Andersen, J., et al. 2004, A&A, 418, 989
- Patten et al. (2006) Patten, B. M., Stauffer, J. R., Burrows, A., et al. 2006, ApJ, 651, 502
- Perryman et al. (1997) Perryman, M. A. C., Lindegren, L., Kovalevsky, J. et al. 1997, A&A, 323, L49
- Phan-Bao et al. (2006) Phan-Bao, N., Bessell, M. S., Martín, E. L., et al. 2006, MNRAS, 366, L40
- Pinfield et al. (2003) Pinfield, D. J., Dobbie, P. D., Jameson, R. F., Steele, I. A., Jones, H. R. A., & Katsiyannis, A. C. 2003, MNRAS, 342, 1241
- Potter et al. 2002 (2002) Potter, D., Martín, E. L., Cushing, M. C., Baudoz, P., Brandner, W., Guyon, O., Neuhäuser, R. 2002, ApJ, 567, L133
- Rebolo et al. (1998) Rebolo, R., Zapatero Osorio, M. R., Madruga, S., Béjar, V. J. S., Arribas, S., Licandro, J. 1998, Science, 282, 1309
- Reid et al. (1994) Reid, I. N., Tinney, C. G., & Mould, J. 1994, AJ, 108, 1456
- Reid et al. (2002) Reid, I. N., Kirkpatrick, J. D., Liebert, J., Gizis, J. E., Dahn, C. C., & Monet, D. G. 2002, AJ, 124, 519
- Ruiz et al. (1997) Ruiz, M. T., Leggett, S. K., & Allard, F. 1997, ApJ, 491, L107
- Schmidt et al. (2007) Schmidt, S. J., Cruz, J. L., Bongiorno, B. J., Liebert, J., & Reid, I. N. 2007, AJ, 133, 2258
- Spitzer & Schwarzschild (1951) Spitzer, L. Jr, & Schwarzschild, M. 1951, ApJ, 114, 385
- Stauffer et al. (1998) Stauffer, J. R., Schultz, G., & Kirkpatrick, J. D. 1998, ApJ, 499, L199
- Tinney & Reid (1998) Tinney, C. G., & Reid, I. N. 1998, MNRAS, 301, 1031
- Tinney et al. (2003) Tinney, C. G., Burgasser, A. J., Kirkpatrick, J. D. 2003, AJ, 126, 975
- Vrba et al. (2004) Vrba, F. J., Henden, A. A., Luginbuhl, C. B., et al. 2004, AJ, 127, 2948
- West et al. (2006) West, A. A., Bochanski, J. J., Hawley, S. L., Cruz, K. L., Covey, K. R., Silvestri, N. M., Reid, I. N., & Liebert, J. 2006, AJ, 132, 2507
- Wielen (1977) Wielen, R. 1977, A&A, 60, 263
- Zapatero Osorio et al. (2006) Zapatero Osorio, M. R., Martín, E. L., Bouy, H., Tata, R., Deshpande, R., & Wainscoat, R. J. 2006, ApJ, 647, 1405
- Zuckerman & Song (2004) Zuckerman, B., & Song, I. 2004, ARA&A, 42, 685
- Zuckerman et al. (2006) Zuckerman, B., Bessell, M. S., Song, I., & Kim, S. 2006, ApJ, 649, L115


| Reference object | |||||||||||
|---|---|---|---|---|---|---|---|---|---|---|---|
| Object | SpT | Obs. date | MJD | vB 10aaHeliocentric radial velocities (km s-1) used in the cross-correlation: 35.0 (vB 10), 37.8 (J222401), 13.8 (J055914), and 5.0 (J121703). | J222401aaHeliocentric radial velocities (km s-1) used in the cross-correlation: 35.0 (vB 10), 37.8 (J222401), 13.8 (J055914), and 5.0 (J121703). | J055914aaHeliocentric radial velocities (km s-1) used in the cross-correlation: 35.0 (vB 10), 37.8 (J222401), 13.8 (J055914), and 5.0 (J121703). | J121703aaHeliocentric radial velocities (km s-1) used in the cross-correlation: 35.0 (vB 10), 37.8 (J222401), 13.8 (J055914), and 5.0 (J121703). | OtherbbThe dwarf’s earliest spectrum acts as the reference spectrum in the cross-correlation. | sin ccAverage rotational velocity from Zapatero Osorio et al. (2006). | Previous | Reference |
| (50000) | (km s-1) | (km s-1) | (km s-1) | (km s-1) | (km s-1) | (km s-1) | (km s-1) | ||||
| PPl 1 | M6.5 | 2005 Oct 26 | 3669.51110 | 5.51.6 | 20.7 | 15.41.6 | 1 | ||||
| 2005 Oct 28 | 3671.51447 | 5.31.9 | 5.32.3 | ||||||||
| vB10 | M8V | 2001 Jun 15 | 2075.58951 | 35.01.5ddHeliocentric velocity obtained from the centroids of the K i lines. | 6.5eeRotational velocity from Mohanty & Basri (2003). | 35.0 | |||||
| 2001 Nov 02 | 2215.20560 | 34.31.5ddHeliocentric velocity obtained from the centroids of the K i lines. | 35.22.0 | 2 | |||||||
| DENIS-P J033411.39495333.6 | M9V | 2005 Oct 26 | 3669.48071 | 70.21.0 | 15 | ||||||
| 2005 Oct 28 | 3671.48317 | 69.81.0 | 69.81.0 | ||||||||
| 2MASS J003616171821104 | L3.5V/L4V | 2004 Dec 05 | 3344.31265 | 18.21.6 | 18.61.4 | 36.0 | |||||
| 2005 Oct 28 | 3671.43118 | 17.61.5 | 17.71.0 | ||||||||
| 2MASS J222443810158521 | L4.5V | 2001 Jun 15 | 2075.61089 | 37.81.0 | 30.7 | 37.43.4 | 3 | ||||
| SDSS J053951.99005902.0 | L5V | 2001 Nov 02 | 2215.45928 | 11.52.7 | 11.51.9 | 33.2 | |||||
| 2005 Oct 27 | 3670.50549 | 11.82.3 | 11.31.8 | ||||||||
| 2MASS J172811503948593AB | L7V | 2001 Jun 15 | 2075.54466 | 12.21.7 | 12.81.0 | 24.1 | |||||
| 2MASS J163229111904407 | L8V/L7.5V/dL6 | 2001 Jun 15 | 2075.51675 | 5.53.7 | 5.92.2 | 21.8 | 5: | 2 | |||
| DENIS-P J0255.04700 | L9V/dL6 | 2005 Oct 27 | 3670.44084 | 17.93.6 | 17.52.8 | 16.03.8 | 41.0 | 13.02.0 | 2 | ||
| SDSSp J125453.90012247.4 | T2V | 2006 Jan 19 | 3754.61049 | 0.15.4 | 0.92.2 | 28.4 | |||||
| 2MASS J055919141404488 | T4.5V | 2001 Nov 02 | 2075.41290 | 13.12.8 | 13.83.7 | 22.8 | |||||
| 2004 Dec 05 | 3344.54854 | 14.61.3 | 14.03.8 | ||||||||
| 2005 Oct 26 | 3669.57615 | 13.71.6 | 13.61.6 | ||||||||
| 2005 Oct 27 | 3670.53068 | 14.21.6 | 13.01.9 | ||||||||
| 2005 Oct 28 | 3671.54024 | 14.31.9 | 13.81.0 | ||||||||
| 2MASS J150319612525196 | T5V | 2006 Jan 19 | 3754.66827 | 40.15.8 | 39.92.6 | 40.52.1 | 32.1 | ||||
| SDSS J162414.37002915.6 | T6V | 2001 Jun 15 | 2075.44304 | 30.73.0 | 36.6 | ||||||
| SDSS J134646.45003150.4 | T6.5V | 2001 Jun 15 | 2075.34518 | 23.11.5 | 15 | ||||||
| 2MASS J155302281532369 | T7V | 2001 Jun 15 | 2075.41290 | 32.83.3 | 32.93.0 | 29.4 | |||||
| 2MASS J121711100311131 | T7V/T8V | 2001 Jun 15 | 2075.25577 | 5.01.6 | 31.4 | ||||||
| Gl 570D | T7.5V/T8V | 2001 Jun 15 | 2075.38494 | 28.92.4 | 28.23.1 | 30.7 | |||||
| 2MASS J041519540935066 | T8V | 2005 Oct 26 | 3669.55271 | 49.61.2 | 51.04.3 | 33.5 | |||||
| Object | SpT | t | ||
|---|---|---|---|---|
| (km s-1) | ||||
| PPl 1 | M6.5 | 2.0 d | 5.4 1.7 | 2 |
| J033449 | M9V | 2.0 d | 70.0 1.0 | 2 |
| J003618 | L3.5V/L4V | 0.90 yr | 18.1 1.5 | 2 |
| J053900 | L5V | 3.98 yr | 11.7 2.1 | 2 |
| J055914 | T4.5V | 4.37 yr | 13.8 0.2aaThe associated velocity uncertainty corresponds to the error of the mean. | 5 |
| Object | SpT | aaFrom Perryman et al. (1997); Dahn et al. (2002); Vrba et al. (2004); Knapp et al. (2004); An et al. (2007). | aaFrom Perryman et al. (1997); Dahn et al. (2002); Vrba et al. (2004); Knapp et al. (2004); An et al. (2007). | aaFrom Perryman et al. (1997); Dahn et al. (2002); Vrba et al. (2004); Knapp et al. (2004); An et al. (2007). | |||
|---|---|---|---|---|---|---|---|
| (pc) | (mas yr-1) | (mas yr-1) | (km s-1) | (km s-1) | (km s-1) | ||
| PPl 1bbDistance and proper motion of the Pleiades cluster. | M6.5V | 133.8 | 19.7 | 44.8 | 6.42.3 | 27.65.0 | 14.04.7 |
| vB 10ccDistance and proper motion of the primary stars (Perryman et al., 1997). | M8V | 5.9 | 578.8 | 1331.6 | 52.60.8 | 8.10.7 | 5.10.2 |
| J033449ddSpectroscopic parallax from Phan-Bao et al. (2006). | M9V | 8.2 | 2350.0 | 470.0 | 66.218.7 | 95.725.0 | 5.821.7 |
| J003618 | L3.5V/L4V | 8.8 | 899.1 | 120.0 | 40.00.8 | 4.81.5 | 11.51.7 |
| J222401 | L4.5V | 11.5 | 463.8 | 865.8 | 10.60.6 | 64.50.9 | 6.40.8 |
| J053900 | L5V | 13.1 | 164.4 | 315.9 | 20.01.8 | 4.31.0 | 14.40.7 |
| J172839AB | L7V | 24.1 | 25.9 | 36.8 | 0.41.0 | 9.31.4 | 9.81.1 |
| J163219 | L8V/L7.5V/dL6 | 15.4 | 294.5 | 56.6 | 5.31.4 | 8.31.3 | 20.41.6 |
| J025547 | L9V/dL6 | 6.3 | 1036.6 | 598.5 | 5.45.0 | 39.25.1 | 3.54.0 |
| J125401 | T2V | 11.8 | 478.7 | 130.1 | 25.60.8 | 9.70.9 | 4.61.9 |
| J055914 | T4.5V | 10.3 | 562.1 | 342.4 | 22.81.1 | 15.81.0 | 21.30.6 |
| J162400 | T6V | 11.2 | 378.6 | 2.5 | 31.02.5 | 19.30.8 | 2.31.7 |
| J134600 | T6.5V | 13.7 | 473.1 | 132.3 | 29.31.8 | 20.01.6 | 17.41.4 |
| J121703 | T7V/T8V | 9.8 | 1057.8 | 91.6 | 44.03.6 | 23.12.2 | 0.21.5 |
| Gl 570DccDistance and proper motion of the primary stars (Perryman et al., 1997). | T7.5V/T8V | 5.9 | 1034.1 | 1725.5 | 49.62.0 | 22.30.8 | 31.61.4 |
| J041509 | T8V | 5.7 | 2192.8 | 527.3 | 64.20.9 | 43.30.7 | 15.11.0 |
| Object | SpT | Ref | |||||||
|---|---|---|---|---|---|---|---|---|---|
| (pc) | (mas yr-1) | (mas yr-1) | (km s-1) | (km s-1) | (km s-1) | (km s-1) | |||
| 2MASS J074642562000321 | L0.5V | 12.2 | 374.044 | 57.905 | 54 | 56.24.4 | 15.31.6 | 0.71.8 | 1, 3 |
| 2MASS J143928361929149 | L1V | 14.4 | 1229.791 | 406.714 | 28 | 82.62.1 | 39.50.9 | 13.24.5 | 1, 2, 3 |
| Kelu 1AB | L2V | 18.7 | 284.790 | 10.941 | 17 | 12.81.2 | 24.61.4 | 12.41.2 | 2, 3 |
| DENIS-P J1058.71548 | L3V | 17.3 | 252.931 | 41.419 | 19 | 20.30.3 | 19.01.5 | 5.51.3 | 2, 3 |
| DENIS-P J1228.21547AB | L5V | 20.2 | 133.868 | 179.598 | 2.5 | 19.01.5 | 5.43.1 | 8.73.7 | 2, 3 |
| 2MASS J150747691627386 | L5V | 7.3 | 161.476 | 888.547 | 39 | 25.33.9 | 17.01.1 | 39.82.9 | 1, 3 |
| DENIS-P J0205.41159AB | L7V | 19.8 | 434.348 | 54.871 | 7 | 34.82.1 | 21.80.8 | 6.44.6 | 2, 3 |
| 2MASS J082519682115521 | L7.5V | 10.6 | 506.522 | 292.729 | 20 | 27.34.0 | 16.91.7 | 15.12.5 | 1, 3, 4 |
| SpT | aa Values in brackets correspond to the width of the distributions (or ). | aa Values in brackets correspond to the width of the distributions (or ). | aa Values in brackets correspond to the width of the distributions (or ). | aa Values in brackets correspond to the width of the distributions (or ). | Age | Ref. | ||||
|---|---|---|---|---|---|---|---|---|---|---|
| (pc) | (″ yr-1) | (km s-1) | (km s-1) | (km s-1) | (km s-1) | (km s-1) | (Gyr) | |||
| F | 10 | 15.4 (3.4) | 0.44 (0.59) | 30.9 | 10.3 | 18.1 | 32.1 (22.9) | 27.0 (23.9) | 2.2 | 1, 5 |
| G | 25 | 15.6 (3.9) | 0.68 (0.82) | 41.3 | 29.3 | 20.5 | 59.5 (35.9) | 48.0 (31.3) | 9.0 | 1, 5 |
| K | 58 | 14.0 (3.4) | 0.78 (0.80) | 43.7 | 32.9 | 15.9 | 61.3 (33.9) | 51.0 (34.3) | 7.6 | 1, 5 |
| M0–M5 | 52 | 10.3 (4.0) | 1.12 (1.38) | 47.1 | 30.7 | 19.5 | 55.1 (33.8) | 47.6 (32.4) | 7.5 | 1, 5 |
| M6–M9 | 31bbfootnotemark: | 17.4 (5.9) | 0.45 (0.45) | 36.5 | 20.6 | 15.7 | 44.0 (29.6) | 32.5 (30.0) | 3.8 | 2, 8 |
| L and Tcc Includes the 29 objects extracted from Reid et al. (2002) and the two field M dwarfs in our sample. | 13 | 10.3 (3.2) | 0.92 (0.64) | 30.0 | 19.9 | 15.2 | 43.8 (17.4) | 37.5 (14.3) | 0.9 | 2, 5–7 |
| L and Tdd Extended sample. | 21 | 12.2 (4.4) | 0.77 (0.57) | 30.2 | 16.5 | 15.8 | 44.2 (19.1) | 36.5 (17.6) | 1.2 | 2–7 |